Georgia Ammonium Phosphate Market (2025-2031) Outlook | Value, Analysis, Forecast, Companies, Size, Industry, Share, Growth, Trends & Revenue
Market Forecast By Type (Mono-Ammonium Phosphate (MAP), Di-Ammonium Phosphate (DAP), Ammonium Polyphosphate), By Application (Fertilizer, Animal Feed, Flame-Retardant, Water Treatment, Food & Beverages, others) And Competitive Landscape
| Product Code: ETC095539 | Publication Date: Jun 2021 | Updated Date: Jan 2025 | Product Type: Report | |
| Publisher: 6Wresearch | No. of Pages: 70 | No. of Figures: 35 | No. of Tables: 5 | |
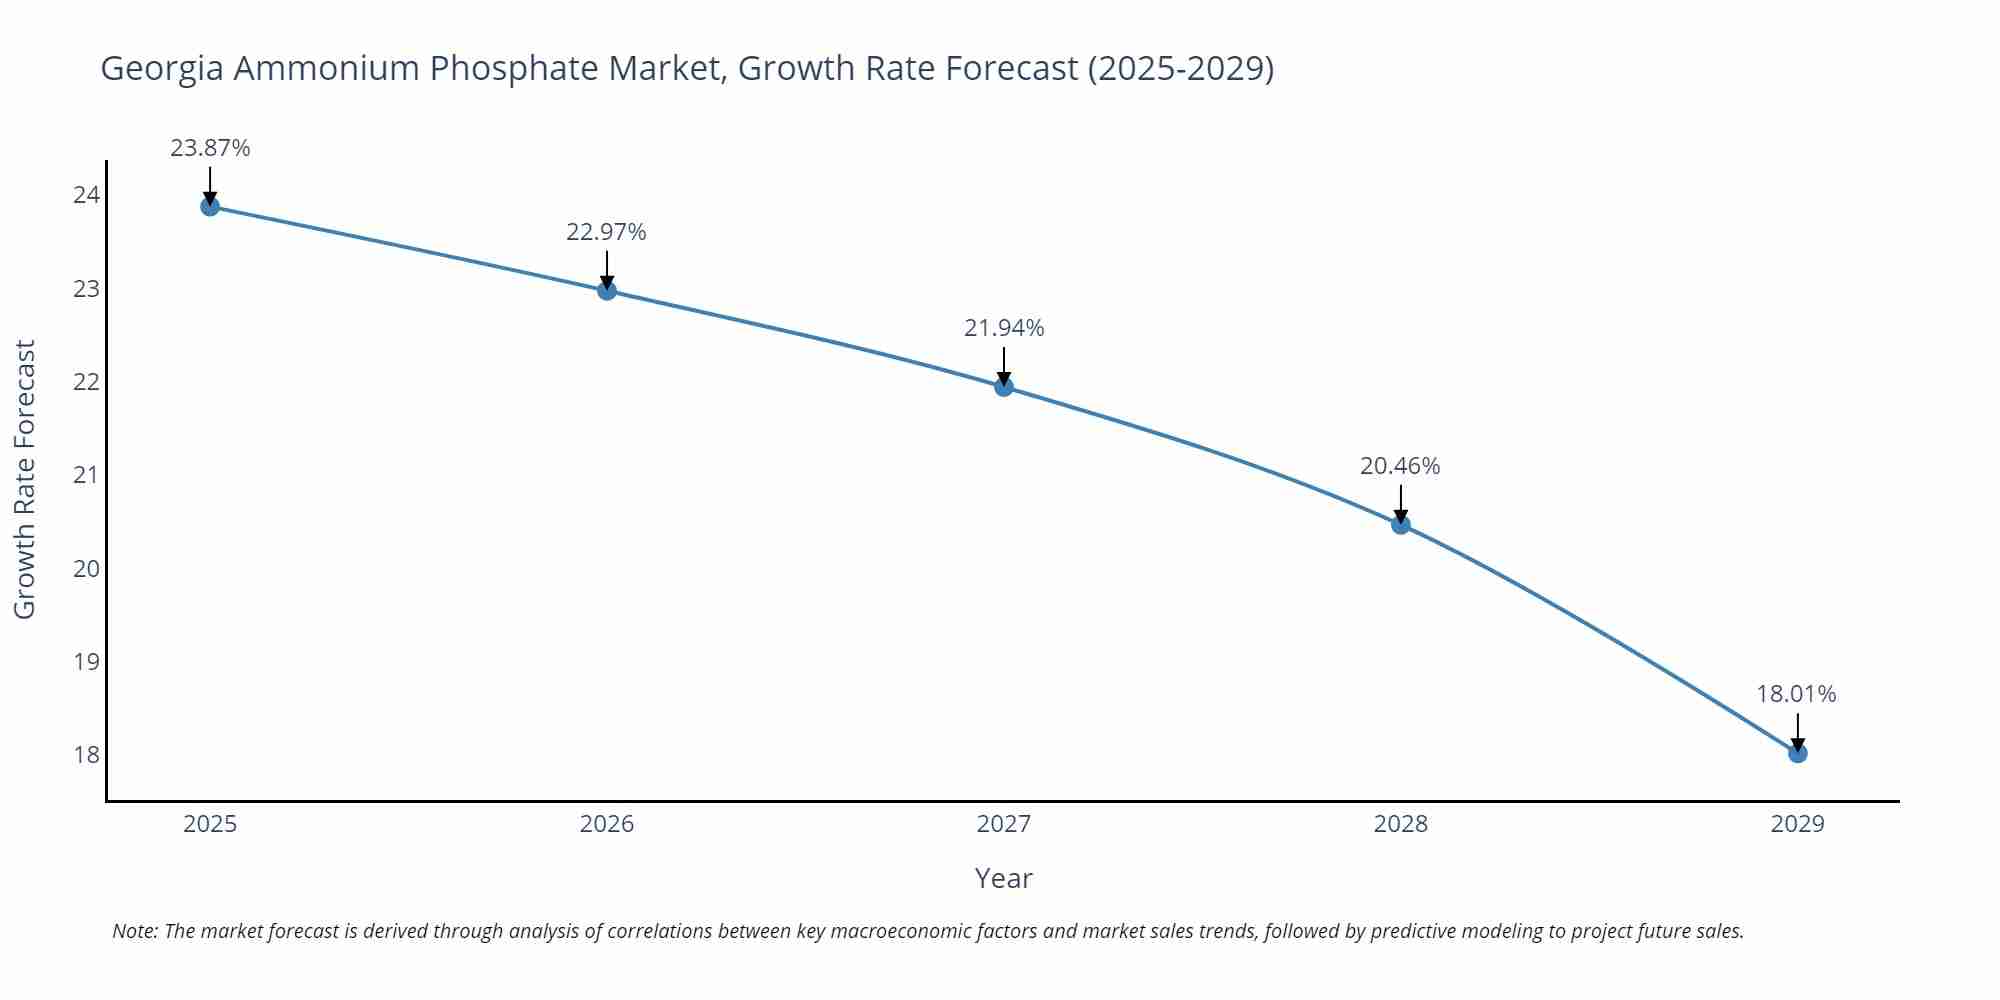
Georgia Ammonium Phosphate Market Size Growth Rate
The Georgia Ammonium Phosphate Market could see a tapering of growth rates over 2025 to 2029. Starting high at 23.87% in 2025, the market steadily declines to 18.01% by 2029.
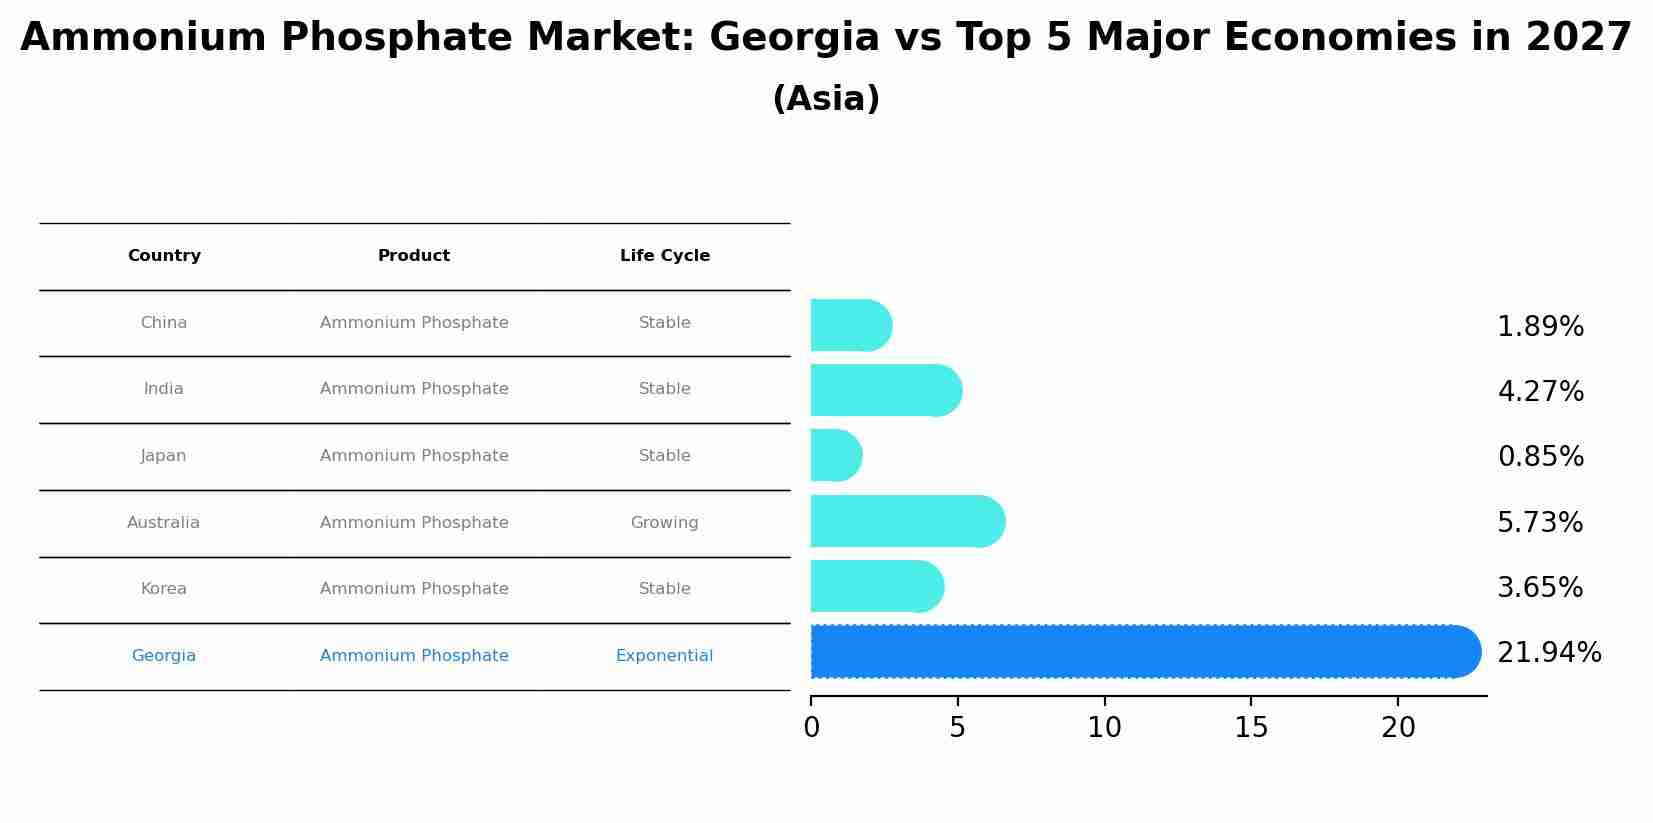
Ammonium Phosphate Market: Georgia vs Top 5 Major Economies in 2027 (Asia)
By 2027, Georgia's Ammonium Phosphate market is forecasted to achieve a exponential growth rate of 21.94%, with China leading the Asia region, followed by India, Japan, Australia and South Korea.
Key Highlights of the Report:
- Georgia Ammonium Phosphate Market Outlook
- Market Size of Georgia Ammonium Phosphate Market, 2021
- Forecast of Georgia Ammonium Phosphate Market, 2031
- Historical Data and Forecast of Georgia Ammonium Phosphate Revenues & Volume for the Period 2021 - 2031
- Georgia Ammonium Phosphate Market Trend Evolution
- Georgia Ammonium Phosphate Market Drivers and Challenges
- Georgia Ammonium Phosphate Price Trends
- Georgia Ammonium Phosphate Porter's Five Forces
- Georgia Ammonium Phosphate Industry Life Cycle
- Historical Data and Forecast of Georgia Ammonium Phosphate Market Revenues & Volume By Type for the Period 2021 - 2031
- Historical Data and Forecast of Georgia Ammonium Phosphate Market Revenues & Volume By Mono-Ammonium Phosphate (MAP) for the Period 2021 - 2031
- Historical Data and Forecast of Georgia Ammonium Phosphate Market Revenues & Volume By Di-Ammonium Phosphate (DAP) for the Period 2021 - 2031
- Historical Data and Forecast of Georgia Ammonium Phosphate Market Revenues & Volume By Ammonium Polyphosphate for the Period 2021 - 2031
- Historical Data and Forecast of Georgia Ammonium Phosphate Market Revenues & Volume By Application for the Period 2021 - 2031
- Historical Data and Forecast of Georgia Ammonium Phosphate Market Revenues & Volume By Fertilizer for the Period 2021 - 2031
- Historical Data and Forecast of Georgia Ammonium Phosphate Market Revenues & Volume By Animal Feed for the Period 2021 - 2031
- Historical Data and Forecast of Georgia Ammonium Phosphate Market Revenues & Volume By Flame-Retardant for the Period 2021 - 2031
- Historical Data and Forecast of Georgia Ammonium Phosphate Market Revenues & Volume By Water Treatment for the Period 2021 - 2031
- Historical Data and Forecast of Georgia Ammonium Phosphate Market Revenues & Volume By Food & Beverages for the Period 2021 - 2031
- Historical Data and Forecast of Georgia Ammonium Phosphate Market Revenues & Volume By others for the Period 2021 - 2031
- Georgia Ammonium Phosphate Import Export Trade Statistics
- Market Opportunity Assessment By Type
- Market Opportunity Assessment By Application
- Georgia Ammonium Phosphate Top Companies Market Share
- Georgia Ammonium Phosphate Competitive Benchmarking By Technical and Operational Parameters
- Georgia Ammonium Phosphate Company Profiles
- Georgia Ammonium Phosphate Key Strategic Recommendations
Frequently Asked Questions About the Market Study (FAQs):
6W monitors the market across 60+ countries Globally, publishing an annual market outlook report that analyses trends, key drivers, Size, Volume, Revenue, opportunities, and market segments. This report offers comprehensive insights, helping businesses understand market dynamics and make informed decisions.
Yes, we provide customisation as per your requirements. To learn more, feel free to contact us on sales@6wresearch.com
1 Executive Summary |
2 Introduction |
2.1 Key Highlights of the Report |
2.2 Report Description |
2.3 Market Scope & Segmentation |
2.4 Research Methodology |
2.5 Assumptions |
3 Georgia Ammonium Phosphate Market Overview |
3.1 Georgia Country Macro Economic Indicators |
3.2 Georgia Ammonium Phosphate Market Revenues & Volume, 2021 & 2031F |
3.3 Georgia Ammonium Phosphate Market - Industry Life Cycle |
3.4 Georgia Ammonium Phosphate Market - Porter's Five Forces |
3.5 Georgia Ammonium Phosphate Market Revenues & Volume Share, By Type, 2021 & 2031F |
3.6 Georgia Ammonium Phosphate Market Revenues & Volume Share, By Form, 2021 & 2031F |
4 Georgia Ammonium Phosphate Market Dynamics |
4.1 Impact Analysis |
4.2 Market Drivers |
4.3 Market Restraints |
5 Georgia Ammonium Phosphate Market Trends |
6 Georgia Ammonium Phosphate Market, By Types |
6.1 Georgia Ammonium Phosphate Market, By Type |
6.1.1 Overview and Analysis |
6.1.2 Georgia Ammonium Phosphate Market Revenues & Volume, By Type, 2018 - 2027F |
6.1.3 Georgia Ammonium Phosphate Market Revenues & Volume, By Mono-Ammonium Phosphate (MAP), 2018 - 2027F |
6.1.4 Georgia Ammonium Phosphate Market Revenues & Volume, By Di-Ammonium Phosphate (DAP), 2018 - 2027F |
6.1.5 Georgia Ammonium Phosphate Market Revenues & Volume, By Ammonium Polyphosphate, 2018 - 2027F |
6.2 Georgia Ammonium Phosphate Market, By Application |
6.2.1 Overview and Analysis |
6.2.2 Georgia Ammonium Phosphate Market Revenues & Volume, By Fertilizer, 2018 - 2027F |
6.2.3 Georgia Ammonium Phosphate Market Revenues & Volume, By Animal Feed, 2018 - 2027F |
6.2.4 Georgia Ammonium Phosphate Market Revenues & Volume, By Flame-Retardant, 2018 - 2027F |
6.2.5 Georgia Ammonium Phosphate Market Revenues & Volume, By Water Treatment, 2018 - 2027F |
6.2.6 Georgia Ammonium Phosphate Market Revenues & Volume, By Food & Beverages, 2018 - 2027F |
6.2.7 Georgia Ammonium Phosphate Market Revenues & Volume, By others, 2018 - 2027F |
7 Georgia Ammonium Phosphate Market Import-Export Trade Statistics |
7.1 Georgia Ammonium Phosphate Market Export to Major Countries |
7.2 Georgia Ammonium Phosphate Market Imports from Major Countries |
8 Georgia Ammonium Phosphate Market Key Performance Indicators |
9 Georgia Ammonium Phosphate Market - Opportunity Assessment |
9.1 Georgia Ammonium Phosphate Market Opportunity Assessment, By Type, 2021 & 2031F |
9.2 Georgia Ammonium Phosphate Market Opportunity Assessment, By Application, 2021 & 2031F |
10 Georgia Ammonium Phosphate Market - Competitive Landscape |
10.1 Georgia Ammonium Phosphate Market Revenue Share, By Companies, 2021 |
10.2 Georgia Ammonium Phosphate Market Competitive Benchmarking, By Operating and Technical Parameters |
11 Company Profiles |
12 Recommendations |
13 Disclaimer |
Pricing
- Single User License$ 1,995
- Department License$ 2,400
- Site License$ 3,120
- Global License$ 3,795

Search
Related Reports
- Middle East OLED Market (2025-2031) | Outlook, Forecast, Revenue, Growth, Companies, Analysis, Industry, Share, Trends, Value & Size
- Taiwan Electric Truck Market (2025-2031) | Outlook, Industry, Revenue, Size, Forecast, Growth, Analysis, Share, Companies, Value & Trends
- South Korea Electric Bus Market (2025-2031) | Outlook, Industry, Companies, Analysis, Size, Revenue, Value, Forecast, Trends, Growth & Share
- Vietnam Electric Vehicle Charging Infrastructure Market (2025-2031) | Outlook, Analysis, Forecast, Trends, Growth, Share, Industry, Companies, Size, Value & Revenue
- Vietnam Meat Market (2025-2031) | Companies, Industry, Forecast, Value, Trends, Analysis, Share, Growth, Revenue, Size & Outlook
- Vietnam Spices Market (2025-2031) | Companies, Revenue, Share, Value, Growth, Trends, Industry, Forecast, Outlook, Size & Analysis
- Iran Portable Fire Extinguisher Market (2025-2031) | Value, Forecast, Companies, Industry, Analysis, Trends, Growth, Revenue, Size & Share
- Philippines Animal Feed Market (2025-2031) | Companies, industry, Size, Share, Revenue, Analysis, Forecast, Growth, Outlook
- India Lingerie Market (2025-2031) | Companies, Growth, Forecast, Outlook, Size, Value, Revenue, Share, Trends, Analysis & Industry
- India Smoke Detector Market (2025-2031) | Trends, Share, Analysis, Revenue, Companies, Industry, Forecast, Size, Growth & Value
Industry Events and Analyst Meet
2nd CYBER FIRST QATAR EDITION

Truck Trailer and Tyre Expo 2025

Dairy, Food and Bakery Expo 2025

Dairy and Food Expo 2025

India Green Energy Expo
Our Clients
Whitepaper
- Middle East & Africa Commercial Security Market Click here to view more.
- Middle East & Africa Fire Safety Systems & Equipment Market Click here to view more.
- GCC Drone Market Click here to view more.
- Middle East Lighting Fixture Market Click here to view more.
- GCC Physical & Perimeter Security Market Click here to view more.
6WResearch In News
- Doha a strategic location for EV manufacturing hub: IPA Qatar
- Demand for luxury TVs surging in the GCC, says Samsung
- Empowering Growth: The Thriving Journey of Bangladesh’s Cable Industry
- Demand for luxury TVs surging in the GCC, says Samsung
- Video call with a traditional healer? Once unthinkable, it’s now common in South Africa
- Intelligent Buildings To Smooth GCC’s Path To Net Zero