UAE Power Cables Market (2018-2024) | Growth, Companies, Value, Revenue, Analysis, Size, Industry, Forecast, Outlook, Share & Trends
Market Forecast By Voltage Rating (Low Voltage (Up to 1kV), Medium Voltage (1.1kV - 33kV), High Voltage (33.1kV - 132kV) and Extra High Voltage (132.1kV - 440kV), By Applications (Oil, Gas & Petrochemicals, Buildings & Industrial and Infrastructure), By Regions (Abu Dhabi, Dubai, Sharjah and Rest of UAE) and Competitive Landscape
| Product Code: ETC000476 | Publication Date: Dec 2021 | Updated Date: Apr 2025 | Product Type: Report | |
| Publisher: 6Wresearch | Author: Ravi Bhandari | No. of Pages: 145 | No. of Figures: 80 | No. of Tables: 21 |
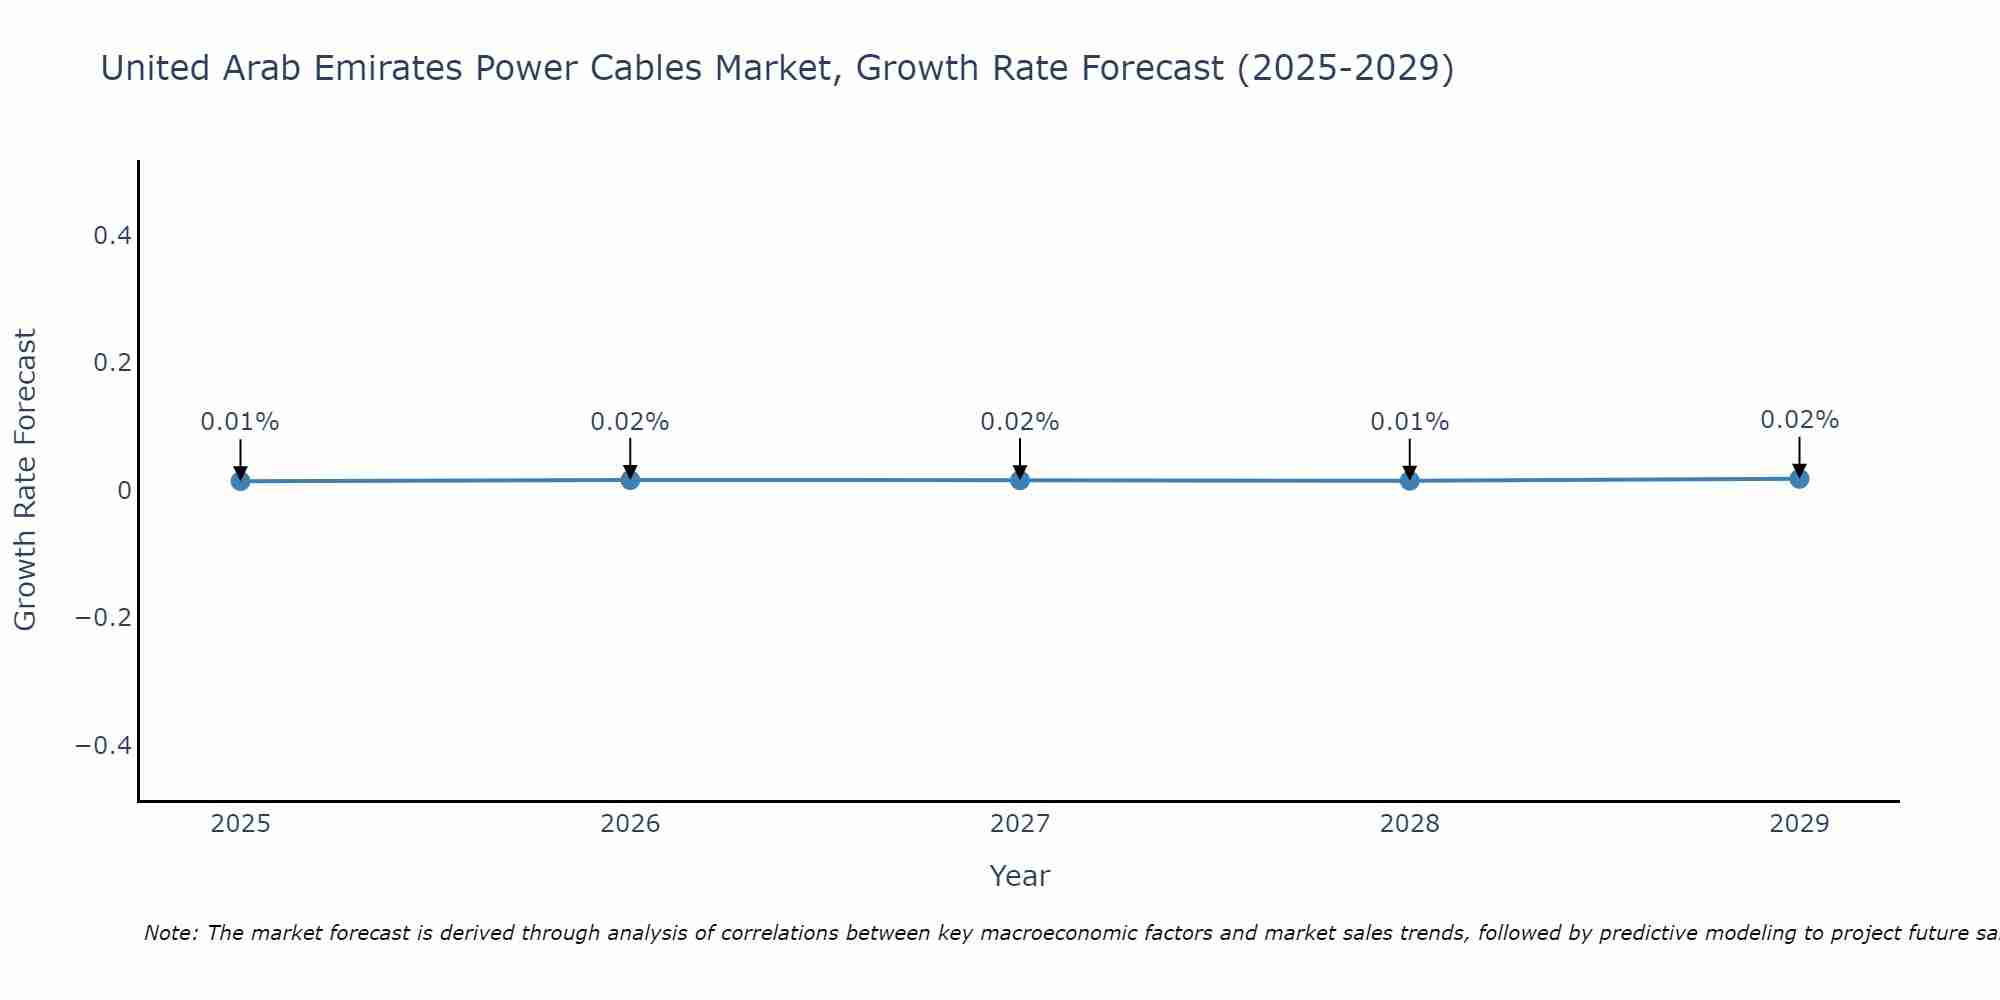
United Arab Emirates Power Cables Market Size Growth Rate
The United Arab Emirates Power Cables Market is projected to witness mixed growth rate patterns during 2025 to 2029. From 0.01% in 2025, the growth rate steadily ascends to 0.02% in 2029.
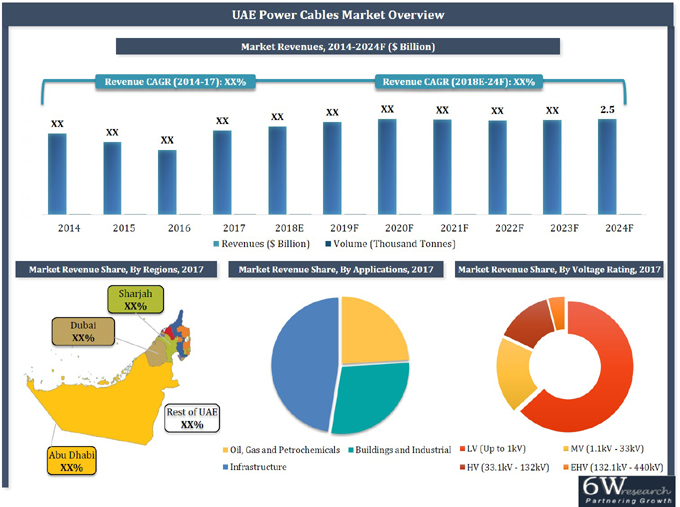
Since 2011, the prices of copper and aluminium have registered a strong downtrend. Copper prices have fallen by over 50% and aluminium prices plunged by more than 40% over the past five years. UAE power cables market recorded a decline in 2015 and 2016 in terms of revenue, attributed to declining in copper and aluminium prices. Though in 2017, the market improved with the recovery of copper and aluminium prices.
According to 6Wresearch, the UAE power cables market size is projected to reach $2.5 billion by 2024. Sustained economic diversification efforts and a substantial flow of investments in mega infrastructure projects would fuel the market for power cables in UAE. The market is expected to grow during the forecast period, owing to upcoming projects in the real estate, hospitality, tourism and infrastructure sectors as the country aim to attract 20 million visitors a year by 2020, as a result of the World Expo in Dubai.
Amongst all applications, the infrastructure sector dominated the UAE Power Cables Market Share on account of the construction of new roads, metro, railways and airport expansion projects, power transmission and distribution projects and power grid interconnection projects. Healthy growth is expected in buildings and industrial applications during the forecast period.
The key market players in UAE power cables include- Ducab, Riyadh Cables, Jeddah Cables, Oman Cables, National Cables, Elsewedy Electric, Prysmian Group, Nexans and Brugg Cables.
The UAE Power Cables Market report thoroughly covers the power cables market by voltage ratings, applications and regions. The UAE Power Cables Market Outlook report provides an unbiased and detailed analysis of the UAE Power Cables Market trends, opportunities/high growth areas, market drivers which would help the stakeholders to devise and align their market strategies according to the current and future market dynamics.
UAE power cable market is anticipated to gain momentum in the upcoming six years on the back of the rising substantial growth of the telecommunication sector in the country. The rising in the spectrum of 5G network access with the growing 5G internet subscriber compared to 4G. Also, the growing hospitality sector in the country is leaving a positive impact on the market growth underpinned by the growing expansion of hotels providing WiFi services is also strengthening the telecom sector and this is estimated to bolster the demand for power cables for the efficient transmission and is estimated to boost the growth of the UAE power cable market in the upcoming six years.
Key Highlights of the Report:
• UAE Power Cables Market Overview
• UAE Power Cables Market Outlook
• UAE Power Cables Market Forecast
• UAE Power Cables Market Size and UAE Power Cables Market Forecast Revenues until 2024
• Historical Data of UAE Power Cables Market Revenues & Volume for the Period 2014-2017
• Market Size & Forecast of UAE Power Cables Market Revenues & Volume until 2024
• Historical Data of UAE Power Cables Market Revenues by kV Rating for the Period 2014-2017
• Market Size & Forecast of UAE Power Cables Market Revenues by kV Rating until 2024
• Historical Data of UAE Power Cables Market Revenues by Application for the Period 2014-2017
• Market Size & Forecast of UAE Power Cables Market Revenues by Application until 2024
• Historical Data of UAE Power Cables Market Revenues by Region for the Period 2014-2017
• Market Size & Forecast of UAE Power Cables Market Revenues by Region until 2024
• Market Drivers and Restraints
• UAE Power Cables Market Trends and Developments
• Players Manufacturing Capacity
• UAE Power Cables Market share, By Players
• UAE Power Cables Market Overview on Competitive Landscape
• Key Company Profiles
• Key Strategic Recommendations
Markets Covered
The UAE Power Cables Market report provides a detailed analysis of the following market segments:
• By Voltage Ratings
o Low Voltage (Up to 1kV)
o Medium Voltage (1.1kV - 33kV)
o High Voltage (33.1kV - 132kV)
o Extra High Voltage (132.1kV - 440kV)
• By Applications
o Oil, Gas and Petrochemicals
o Buildings and Industrial
o Infrastructure
• By Regions
o Abu Dhabi
o Dubai
o Sharjah
o Rest of the UAE
Frequently Asked Questions About the Market Study (FAQs):
6Wresearch actively monitors the UAE Power Cables Market and publishes its comprehensive annual report, highlighting emerging trends, growth drivers, revenue analysis, and forecast outlook. Our insights help businesses to make data-backed strategic decisions with ongoing market dynamics. Our analysts track relevent industries related to the UAE Power Cables Market, allowing our clients with actionable intelligence and reliable forecasts tailored to emerging regional needs.
Yes, we provide customisation as per your requirements. To learn more, feel free to contact us on sales@6wresearch.com
1. Executive Summary
2. Introduction
2.1. Report Description
2.2. Key Highlights of the Report
2.3. Market Scope & Segmentation
2.4. Research Methodology
2.5. Assumptions
3. Global Power Cables Market Overview
3.1. Global Power Cables Market Revenues (2014-2024F)
3.2. Global Power Cables Market Revenue Share, By Regions (2017)
4. UAE Power Cable Market Overview
4.1. UAE Power Cables Market Revenues & Volume (2014-2024F)
4.2. Industry Life Cycle
4.3. Porter's Five Forces Model
4.4. UAE Power Cable Market Revenue Share, By kV Rating (2017 & 2024F)
4.5. UAE Power Cable Market Revenue Share, By Applications (2017 & 2024F)
4.6. UAE Power Cable Market Revenue Share, By Regions (2017 & 2024F)
5. UAE Power Cables Market Dynamics
5.1. Impact Analysis
5.2. Market Drivers
5.3. Market Restraints
6. UAE Power Cables Market Trends
6.1. Development of Smart Grids
6.2. Shifting Preference for Aluminium Cable over Copper
6.2. Increasing focus towards Specialized Cables
7. UAE Power Cables Market, By Voltage Rating
7.1 UAE up to 1 kV Power Cables Market Overview
7.1.1 UAE up to 1 kV Power Cables Market Revenues (2017-2024F)
7.1.2 UAE up to 1 kV Power Cables Market Revenue Share, By Applications (2017 & 2024F)
7.1.3 UAE up to 1 kV Power Cables Market Revenues, By Applications (2017-2024F)
7.2 UAE 1.1-3.3 kV Power Cables Market Overview
7.2.1 UAE 1.1-3.3 kV Power Cables Market Revenues (2017-2024F)
7.2.2 UAE 1.1-3.3 kV Power Cables Market Revenue Share, By Applications (2017 & 2024F)
7.2.3 UAE 1.1-3.3 kV Power Cables Market Revenues, By Applications (2017-2024F)
7.3 UAE 33.1-132 kV Power Cables Market Overview
7.3.1 UAE 33.1-132 kV Power Cables Market Revenues (2017-2024F)
7.3.2 UAE 33.1-132 kV Power Cables Market Revenue Share, By Applications (2017 & 2024F)
7.3.3 UAE 33.1-132 kV Power Cables Market Revenues, By Applications (2017-2024F)
7.4 UAE 132.1-440 kV Power Cables Market Overview
7.4.1 UAE 132.1-440 kV Power Cables Market Revenues (2017-2024F)
7.4.2 UAE 132.1-440 kV Power Cables Market Revenue Share, By Applications (2017 & 2024F)
7.4.3 UAE 132.1-440 kV Power Cables Market Revenues, By Applications (2017-2024F)
8. UAE Power Cables Market, By Applications
8.1 UAE Oil, Gas and Petrochemicals Application Power Cables Market Revenues (2017-2024F)
8.1.1 UAE Oil, Gas and Petrochemicals Application Low Voltage Power Cables Market Revenues (2017-2024F)
8.1.2 UAE Oil, Gas and Petrochemicals Application Medium Voltage Power Cables Market
Revenues (2017-2024F)
8.2 UAE Buildings and Industrial Application Power Cables Market Revenues (2017-2024F)
8.2.1 UAE Buildings and Industrial Application Low Voltage Power Cables Market Revenues (2017-2024F)
8.2.2 UAE Buildings and Industrial Application Medium Voltage Power Cables Market Revenues (2017-2024F)
8.3 UAE Infrastructure Application Power Cables Market Revenues (2017-2024F)
8.3.1 UAE Infrastructure Application Low Voltage Power Cables Market Revenues (2017-2024F)
8.3.2 UAE Infrastructure Application Medium Voltage Power Cables Market Revenues (2017-2024F)
8.3.3 UAE Infrastructure Application Medium Voltage Power Cables Market Revenues (2017-2024F)
8.3.4 UAE Infrastructure Application Extra High Voltage Power Cables Market Revenues (2017-2024F)
9. UAE Power Cables Regional Market Overview
9.1 Overview and Analysis
9.2 UAE Power Cables Market Revenues, By Regions (2014-2024F)
10. UAE Power Cables Market, Key Performance Indicators
10.1 UAE Power Sector Outlook
10.2 UAE Oil & Gas Sector Outlook
10.3 UAE Government Spending Outlook
10.4 UAE Construction Sector Outlook
10.5 UAE Hospitality Market Outlook
11. UAE Power Cables Market Competitive Landscape
11.1 UAE Power Cables Market Key Vendors - Manufacturing Capabilities
11.2 UAE Power Cables Market Revenue Share, By Companies (2017)
11.3 Competitive Benchmarking, By Voltage Ratings
12. Company Profiles
12.1. Ducab
12.2. Riyadh Cables Group Company
12.3. National Cables Industry
12.4. Oman Cables Industry
12.5. Elsewedy Electric L.L.C - UAE
12.6. Power Plus Cable Co. L.L.C.
12.7. Saudi Cable Company
12.8. Alfanar Company Ltd.
12.9. Prysmian Group
12.10. NEXANS MIDDLE EAST
12.11. Jeddah Cables Company
12.12. Brugg Cable Middle East DMCC
13. Key Strategic Pointers
14. Disclaimer
List of Figures
1. Global Power Cables Market Revenues, 2014-2024F ($ Billion)
2. Global Power Cables Market Revenue Share, 2017
3. UAE Power Cables Market Revenues & Volume, 2014-2024F ($ Billion, Thousand Tonnes)
4. UAE Power Cables Market Industry Life Cycle, 2017
5. UAE Power Cables Market Revenue Share, By kV Ratings, 2017 & 2024F
6. UAE Power Cables Market Revenue Share, By Application, 2017
7. UAE Power Cables Market Revenue Share, By Application, 2024F
8. UAE Power Cables Market Revenue Share, By Region, 2017 & 2024F
9. UAE's Manufacturing Sector Revenues Contribution to the Overall GDP, 2015 - 2023F ($ Billion)
10. Volume of Total Non - Oil Foreign Trade Between UAE & The Rest of World, 2012 - 2016 ($ Million)
11. Volume of Total Direct Foreign Trade Between UAE & The Rest of World, 2012 - 2016 ($ Million)
12. Volume of Total Free - Zones Foreign Trade Between UAE & The Rest of World, 2012 - 2016 ($ Million)
13. UAE Pharmaceutical Market Revenues, 2016 - 2025F ($ Billion)
14. UAE Electricity Generation, 2012-2016 (TWh)
15. Dubai World Expo 2020 Project Value ($ Million)
16. Share of Dubai World Expo 2020 Project Value
17. Fluctuation in Raw Material Prices: Copper VS. Aluminium, 2014-2023F ($ per Tonne)
18. UAE up to 1kV Power Cables Market Revenues, 2014-2024F ($ Million)
19. UAE up to 1kV Power Cables Market Revenue Share, By Application, 2017
20. UAE up to 1kV Power Cables Market Revenue Share, By Application, 2024F
21. UAE 1.1-33kV Power Cables Market Revenues, 2014-2024F ($ Million)
22. UAE 1.1-33kV Power Cables Market Revenue Share, By Application, 2017
23. UAE 1.1-33kV Power Cables Market Revenue Share, By Application, 2024F
24. UAE 33.1-132kV Power Cables Market Revenues, 2014-2024F ($ Million)
25. UAE 33.1-132kV Power Cables Market Revenue Share, By Application, 2017
26. UAE 33.1-132kV Power Cables Market Revenue Share, By Application, 2024F
27. UAE 132.1-440kV Power Cables Market Revenues, 2014-2024F ($ Million)
28. UAE 132.1-440kV Power Cables Market Revenue Share, By Application, 2017
29. UAE 132.1-440kV Power Cables Market Revenue Share, By Application, 2024F
30. UAE Power Cables Market Revenues, By Oil, Gas and Petrochemicals Application, 2014-2024F ($ Million)
31. UAE Low Voltage Power Cables Market Revenues, By Oil, Gas and Petrochemicals Application,
2014-2024F ($ Million)
32. UAE Medium Voltage Power Cables Market Revenues, By Oil, Gas and Petrochemicals Application,
2014-2024F ($ Million)
33. UAE Power Cables Market Revenues, By Buildings and Industrial Application, 2014-2024F ($ Million)
34. UAE Medium Voltage Power Cables Market Revenues, By Buildings and Industrial Application,
2014-2024F ($ Million)
35. UAE Medium Voltage Power Cables Market Revenues, By Buildings and Industrial Application,
2014-2024F ($ Million)
36. UAE Power Cables Market Revenues, By Infrastructure Application, 2014-2024F ($ Million)
37. UAE Low Voltage Power Cables Market Revenues, By Infrastructure Application, 2014-2024F ($ Million)
38. UAE Medium Voltage Power Cables Market Revenues, By Infrastructure Application, 2014-2024F ($ Million)
39. UAE High Voltage Power Cables Market Revenues, By Infrastructure Application, 2014-2024F ($ Million)
40. UAE Extra High Voltage Power Cables Market Revenues, By Infrastructure Application, 2014-2024F ($ Million)
41. UAE Power Cables Market Revenues, By Regions, 2014-2024F ($ Million)
42. Abu Dhabi Peak Electricity Demand Forecasts, 2010-2020F (MW)
43. Abu Dhabi Peak Electricity Demand Forecasts, 2021-2030F (MW)
44. UAE Power Construction Contractor Awards, 2016-2018 ($ Million)
45. Share of GCC Power Construction Project value as of 27th October 2017 (%)
46. UAE Crude Oil Production, 2014-2023F (Thousand Barrels/Day)
47. UAE Oil & Gas Spending, 2014-2023F ($ Billion)
48. UAE Crude Oil and Natural Gas Production, 2005-2016 (Thousand barrels per day, Billion Cubic Metres)
49. UAE Actual Government Spending Vs Actual Government Revenues, 2012-2021F ($ Billion)
50. UAE Budget Allocation for Financial Year 2015 & 2016 ($ Billion)
51. UAE Building Construction Contractor Awards, 2016-2017, ($ Million)
52. UAE Building Construction Projects Value by Status, 2017
53. UAE Infrastructure - Construction Industry , 2016 - 2026F ($ Billion)
54. Net Value of Construction Projects in Execution & Planning Stages in Dubai, By Sector, 2016
55. UAE Road, Bridge, and Tunnel Contractor Awards, 2017-2018 ($ Million)
56. UAE Road, Bridge, and Tunnel Project Value and Number of Projects, 2017 ($ Million)
57. UAE Road, Bridge, and Tunnel Project Value, By Stages of Construction, 2017 (%)
58. UAE Rail Projects Value and Number of Projects, 2017 ($ Million)
59. Total UAE Existing and Future Hospitality Supply, As of Q1 2017, Number of Keys
60. Abu Dhabi Existing and Future Supply, As of Q1 2017, Number of Keys
61. Dubai Existing and Future Supply, As of Q1 2017, Number of Keys
62. Ajman Existing and Future Supply, As of Q1 2017, Number of Keys
63. Ras Al Khaimah Existing and Future Supply, As of Q1 2017, Number of Keys
64. Fujairah Existing and Future Supply, As of Q1 2017, Number of Keys
65. Sharjah Existing and Future Supply, As of Q1 2017, Number of Keys
66. AL Ain Existing and Future Supply, As of Q1 2017, Number of Keys
67. Abu Dhabi Western Region Existing and Future Supply, As of Q1 2017, Number of Keys
68. UAE Hotel and Restaurant Industry Value, 2014 - 2023F ($ Billion)
69. Abu Dhabi, Supply Breakdown, % Number of Keys, As of Q1 2017
70. Dubai, Supply Breakdown, % Number of Keys, As of Q1 2017
71. Ajman, Supply Breakdown, % Number of Keys, As of Q1 2017
72. Ras Al Khaimah, Supply Breakdown, % Number of Keys, As of Q1 2017
73. Fujairah, Supply Breakdown, % Number of Keys, As of Q1 2017
74. Sharjah, Supply Breakdown, % Number of Keys, As of Q1 2017
75. Al Ain, Supply Breakdown, % Number of Keys, As of Q1 2017
76. Abu Dhabi Western Region, Supply Breakdown, % Number of Keys, As of Q1 2017
77. UAE Low Voltage Power Cables Market Revenue Share, By Companies, 2017
78. UAE Medium Voltage Power Cables Market Revenue Share, By Companies, 2017
79. UAE High Voltage Power Cables Market Revenue Share, By Companies, 2017
80. UAE Extra High Voltage Power Cables Market Revenue Share, By Companies, 2017
List of Tables
1. Upcoming Industrial Plants in UAE (2017-2020)
2. Upcoming World Expo 2020 Projects
3. UAE up to 1kV Power Cables Market Revenues, By Application, 2014-2017 ($ Million)
4. UAE up to 1kV Power Cables Market Revenues, By Application, 2018E-2024F ($ Million)
5. UAE 1.1-33kV Power Cables Market Revenues, By Application, 2014-2017 ($ Million)
6. UAE 1.1-33kV Power Cables Market Revenues, By Application, 2018E-2024F ($ Million)
7. UAE 33.1-132kV Power Cables Market Revenues, By Application, 2014-2016 ($ Million)
8. UAE 33.1-132kV Power Cables Market Revenues, By Application, 2018#-2024F ($ Million)
9. UAE 132.1-440kV Power Cables Market Revenues, By Application, 2014-2016 ($ Million)
10. UAE 132.1-440kV Power Cables Market Revenues, By Application, 2018E-2024F ($ Million)
11. Dubai Underground Power Cable Lines, 2014-16 (In Km.)
12. Dubai Overhead Power Cable Lines, 2014-16 (In Km.)
13. UAE upcoming Power Plant Projects
14. UAE Oil & Gas Projects
15. Major Building Construction Projects in UAE for Which Construction is Expected to Commence in 2017
16. Upcoming Construction Projects In Dubai
17. Upcoming Construction Projects In Abu Dhabi
18. Upcoming Construction Projects In Sharjah
19. List of Major Car Park, Road, and Rail Projects in the UAE
20. Upcoming Roads-Bridges and Infrastructure Projects in the UAE
21. UAE Power Cables Market Key Vendors - Manufacturing Capacity, By Company, 2017 (Tonnes per annum)
Global Go To Market Strategy - 2030
Export potential enables firms to identify high-growth global markets with greater confidence by combining advanced trade intelligence with a structured quantitative methodology. The framework analyzes emerging demand trends and country-level import patterns while integrating macroeconomic and trade datasets such as GDP and population forecasts, bilateral import–export flows, tariff structures, elasticity differentials between developed and developing economies, geographic distance, and import demand projections. Using weighted trade values from 2020–2024 as the base period to project country-to-country export potential for 2030, these inputs are operationalized through calculated drivers such as gravity model parameters, tariff impact factors, and projected GDP per-capita growth. Through an analysis of hidden potentials, demand hotspots, and market conditions that are most favorable to success, this method enables firms to focus on target countries, maximize returns, and global expansion with data, backed by accuracy.
By factoring in the projected importer demand gap that is currently unmet and could be potential opportunity, it identifies the potential for the Exporter (Country) among 190 countries, against the general trade analysis, which identifies the biggest importer or exporter.
To discover high-growth global markets and optimize your business strategy:
Click Here
Pricing
- Single User License$ 1,995
- Department License$ 2,400
- Site License$ 3,120
- Global License$ 3,795

Leadership Perspectives from Industry Events
Search
Thought Leadership and Analyst Meet


Our Clients
6WResearch In News
- India Export Attractiveness Tracker 2026
- India Air Conditioner Market Set for Strong Rebound in 2026 After Weather-Led Correction and GST-Driven Recovery: 6Wresearch
- ADAS in India: How Automatic Emergency Braking, Blind Spot Detection & Driver Monitoring are Transforming Road Safety
- Doha a strategic location for EV manufacturing hub: IPA Qatar
- Demand for luxury TVs surging in the GCC, says Samsung
- Empowering Growth: The Thriving Journey of Bangladesh’s Cable Industry
Latest Reports
- Qatar Access and Home Network Market (2026-2032)
- Nicaragua RPG Gaming Market (2026-2032)
- New Zealand RPG Gaming Market (2026-2032)
- Netherlands RPG Gaming Market (2026-2032)
- Nauru RPG Gaming Market (2026-2032)
- Namibia RPG Gaming Market (2026-2032)
- Mozambique RPG Gaming Market (2026-2032)
- Montenegro RPG Gaming Market (2026-2032)
- Mongolia RPG Gaming Market (2026-2032)
- Monaco RPG Gaming Market (2026-2032)
Industry Events and Analyst Meet

EV India Expo 2026

HIMTEX 2026

India Refining Summit 2026

India EV Show 2026

EV tech India Expo 2026
Whitepaper
- Middle East & Africa Commercial Security Market Click here to view more.
- Middle East & Africa Fire Safety Systems & Equipment Market Click here to view more.
- GCC Drone Market Click here to view more.
- Middle East Lighting Fixture Market Click here to view more.
- GCC Physical & Perimeter Security Market Click here to view more.