Global Gas Genset Market (2016-2022) | Industry, Value, Revenue, Trends, Size, Share, Outlook, Analysis, Forecast, Growth & Companies
Market Forecast By Rating Types (Below 60 kW, 60 - 300 kW, 300.1 - 1000 kW and Above 1000 kW), Applications (Standby, Primary and Peak Shave), Verticals (Industrial, Commercial, Infrastructure and Residential), and Regions (North America (US and Canada), Latin America (Brazil, Mexico, and Others), Asia-Pacific (India, China, and Others), Europe (Germany, UK, Russia, and Others), Middle-East (Saudi Arabia, UAE, Qatar, and Others) and Africa (South Africa and Others).
| Product Code: ETC000293 | Publication Date: Jan 2016 | Product Type: Report | ||
| Publisher: 6Wresearch | Author: Ravi Bhandari | No. of Pages: 177 | No. of Figures: 67 | No. of Tables: 42 |
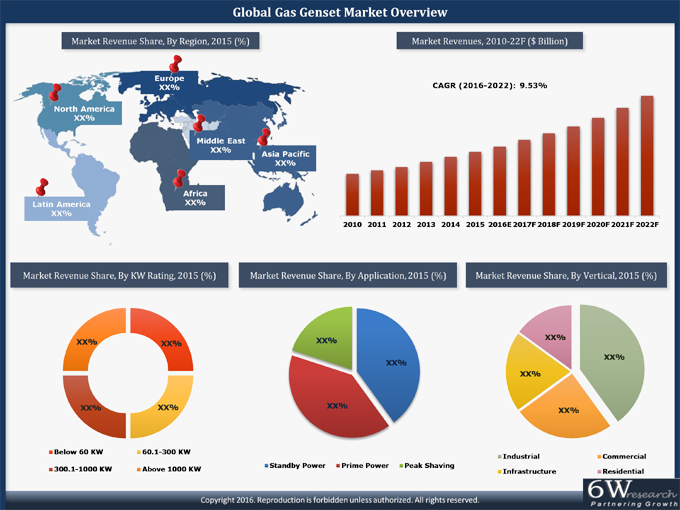
Growing public & private infrastructures, surging industrial, commercial, retail, and hospitality sectors have increased the energy demand throughout the globe. To meet this demand, Gensets are readily getting deployed to provide prime, standby, and peak shave power across various sectors.According to 6Wresearch, the Global Gas Genset market is projected to reach $7.1 billion by 2022. In the global Genset market, the diesel Genset segment has generated the majority of the market revenues; however, with growing environmental concerns a shift towards gas-powered Gensets would be witnessed over the next six years. The global Gas Genset market is driven by several growth factors such as energy deficit, the need to generate power from cleaner fuels, rising carbon emissions, and expanding pipeline infrastructure. Amongst all regions, Asia-Pacific is the leading revenue contributing region in the global market.
In terms of power rating, the market is dominated by the 300.1-1000 kW segment in 2015 followed by the 60.1-300 kW segment. The major companies in the global gas Genset market include- Caterpillar, Cummins, GE, Dresser-Rand, Generac, Himoinsa, Wartsila, MTU, and others.
The report thoroughly covers the gas Genset market by KW ratings, verticals, applications, and countries. The report provides an unbiased and detailed analysis of the ongoing trends, opportunities/high growth areas, market drivers, which would help the stakeholders to decide and align their market strategies according to the current and future market dynamics.
Global Gas Genset Market is going to generate the gas. Gas generator going to generate gas by using chemical reactions and solid or liquid sources. Gas Genset used on a global level and the gas Genset refers to a device that uses a rocket propellant and gas is used in large quantities. The global Genset market is estimated to gain traction in the coming timeframe on the back of rising back up energy requirement as emergence in the household. (in what?). Additionally, the increased commercial sector in developed and developing countries such as offices, malls, and airports has been supporting Gas Genset equipment demand during emergencies and is anticipated to generate high sales revenues in the market. Further, rising adoption for natural-based power generators in developed countries such as Japan and Germany owing to increased environmental concern where gas Genset emits minimal carbon dioxide emission is estimated to bolster prominent growth of the global gas Genset market in the upcoming six years.
The global Gas Genset market is projected to secure tremendous growth throughout the forecast period owing to rising allocation across multiple sectors. On the basis of the region, the Asia Pacific gas Genset market is estimated to bolster the growth of the market owing to the rising need for uninterruptible power supply source systems in the country. India gas Genset is experiencing extensive growth due to the accelerating use of gas Genset in rural areas to keep on the parties and in religious programs, As in India, rural areas attain less electricity access where gas Gensets plays a significant role in providing adequate electricity access during power outages and is estimated to bolster the growth of the gas Genset market globally.
Key Highlights of the Report:
• Historical data of Global Gas Genset Market Revenues for the Period 2010-2015.
• Market Size & Forecast of Global Gas Genset Market Revenues for the Period until 2022.
• Historical data of Global Gas Genset Market Volume for the Period 2010-2015.
• Market Size & Forecast of Global Gas Genset Market Volume for the Period until 2022.
• Market Size & Forecast of Global Gas Genset Market by KW Rating until 2022.
• Market Size & Forecast of Global Gas Genset Market by Application until 2022.
• Market Size & Forecast of Global Gas Genset Market by Vertical until 2022.
• Market Size & Forecast of Global Gas Genset Market by Region until 2022.
• Market Size & Forecast of Global Gas Genset Market by Country until 2022.
• Market Drivers and Restraints.
• Market Trends and Developments.
• Major Players Market Share.
• Company Profiles.
• Key Strategic Pointers.
Markets Covered
The report provides a detailed analysis of the following market segments:
• By KW Ratings
o Below 60 kW
o 60 - 300 kW
o 300.1 - 1000 kW
o Above 1000 kW
• By Applications
o Standby Power
o Primary Power
o Peak Shaving
• By Verticals
o Industrial
o Commercial
o Infrastructure
o Residential
• By Regions
o North America
• US
• Canada
o Latin America
• Brazil
• Mexico
• Others
o Asia-Pacific
• India
• China
• Others
o Europe
• Germany
• UK
• Russia
• Others
o Middle-East
• Saudi Arabia
• UAE
• Qatar
• Others
o Africa
• South Africa
• Others
Frequently Asked Questions About the Market Study (FAQs):
6Wresearch actively monitors the Global Gas Genset Market and publishes its comprehensive annual report, highlighting emerging trends, growth drivers, revenue analysis, and forecast outlook. Our insights help businesses to make data-backed strategic decisions with ongoing market dynamics. Our analysts track relevent industries related to the Global Gas Genset Market, allowing our clients with actionable intelligence and reliable forecasts tailored to emerging regional needs.
Yes, we provide customisation as per your requirements. To learn more, feel free to contact us on sales@6wresearch.com
TABLE OF CONTENTS
1 Executive Summary
2 Introduction
2.1 Key Highlights of the Report
2.2 Report Description
2.3 Market Scope & Segmentation
2.4 Methodology Adopted and Key Data Points
2.5 Assumptions
3 Global Gas Genset Market Overview
3.1 Global Gas Genset Market Revenues & Volume (2010-2022F)
3.2 Industry Life Cycle
3.3 Porter's 5 Forces Model
3.4 Global Gas Genset Market Revenue Share, By Power Rating (2015 & 2022F)
3.5 Global Gas Genset Market Revenues, By Power Rating (2010-2022F)
3.6 Global Gas Genset Market Revenue Share, By Application (2015 & 2022F)
3.7 Global Gas Genset Market Revenues, By Application (2010-2022F)
3.8 Global Gas Genset Market Revenue Share, By Vertical (2015 & 2022F)
3.9 Global Gas Genset Market Revenues, By Vertical (2010-2022F)
3.10 Global Genset Market Revenue Share, By Region (2015 & 2022F)
4 Global Gas Genset Market Dynamics
4.1 Market Drivers
4.1.1 Commercial and Industrial Growth
4.1.2 Inadequate Grid Infrastructure
4.1.3 Increasing Construction Activities
4.1.4 Low Natural Gas Prices
4.1.5 Rapid Rate of Industrialization
4.2 Market Restraints
4.2.1 Increasing Adoption of Renewal Energy Sources
4.2.2 Increasing Demand for Used Gensets
4.2.3 Lack of Gas Supply Infrastructure
4.2.4 High Penetration of Diesel Gensets
5 Global Gas Genset Market Trends
5.1 Increasing Adoption of Industry-specific Gensets
5.2 Emerging Demand for Hybrid Gensets
5.3 Growing Marine Genset Market
6 North America Gas Genset Market Overview
6.1 North America Gas Genset Market Revenues & Volume (2010-2022F)
6.2 North America Gas Genset Market Revenue Share, By Power Rating (2015 & 2022F)
6.3 North America Gas Genset Market Revenues, By Power Rating (2010-2022F)
6.4 North America Gas Genset Market Revenue Share, By Application (2015 & 2022F)
6.5 North America Gas Genset Market Revenues, By Application (2010-2022F)
6.6 North America Gas Genset Market Revenue Share, By Vertical (2015 & 2022F)
6.7 North America Gas Genset Market Revenues, By Vertical (2010-2022F)
6.8 North America Gas Genset Market Revenues, By Country
6.8.1 U.S. Gas Genset Market Revenues (2010-2022F)
6.8.1.1 U.S. Electricity Generation & Consumption (2000-2012)
6.8.2 Canada Gas Genset Market Revenues (2010-2022F)
6.8.2.1 Canada Electricity Generation & Consumption (2000-2012)
7 Latin America Gas Gensets Market Overview
7.1 Latin America Gas Gensets Market Revenues & Volume (2010-2022F)
7.2 Latin America Gas Genset Market Revenue Share, By Power Rating (2015 & 2022F)
7.3 Latin America Gas Genset Market Revenues, By Power Rating (2010-2022F)
7.4 Latin America Gas Genset Market Revenue Share, By Application (2015 & 2022F)
7.5 Latin America Gas Genset Market Revenues, By Application (2010-2022F)
7.6 Latin America Gas Genset Market Revenue Share, By Vertical (2015 & 2022F)
7.7 Latin America Gas Genset Market Revenues, By Vertical (2010-2022F)
7.8 Latin America Gas Genset Market Revenues, By Country
7.8.1 Brazil Gas Genset Market Revenues (2010-2022F)
7.8.1.1 Brazil Electricity Generation & Consumption (2000-2012)
7.8.2 Mexico Gas Genset Market Revenues (2010-2022F)
7.8.2.1 Mexico Electricity Generation & Consumption (2000-2012)
7.8.3 Other Latin American Countries Gas Genset Market Revenues (2010-2022F)
8 Europe Gas Genset Market Overview
8.1 Europe Gas Genset Market Revenues & Volume (2010-2022F)
8.2 Europe Gas Genset Market Revenue Share, By Power Rating (2015 & 2022F)
8.3 Europe Gas Genset Market Revenues, By Power Rating (2010-2022F)
8.4 Europe Gas Genset Market Revenue Share, By Application (2015 & 2022F)
8.5 Europe Gas Genset Market Revenues, By Application (2010-2022F)
8.6 Europe Gas Genset Market Revenue Share, By Vertical (2015 & 2022F)
8.7 Europe Gas Genset Market Revenues, By Vertical (2010-2022F)
8.8 Europe Gas Genset Market Revenues, By Country
8.8.1 Germany Gas Genset Market Revenues (2010-2022F)
8.8.1.1 Germany Electricity Generation & Consumption (2000-2012)
8.8.2 Russia Gas Genset Market Revenues (2010-2022F)
8.8.2.1 Russia Electricity Generation & Consumption (2000-2012)
8.8.3 UK Gas Genset Market Revenues (2010-2022F)
8.8.3.1 UK Electricity Generation & Consumption (2000-2012)
8.8.4 Other European Countries Gas Genset Market Revenues (2010-2022F)
9 Middle East Gas Genset Market Overview
9.1 Middle East Gas Genset Market Revenues & Volume (2010-2022F)
9.2 Middle East Gas Genset Market Revenue Share, By Power Rating (2015 & 2022F)
9.3 Middle East Gas Genset Market Revenues, By Power Rating (2010-2022F)
9.4 Middle East Gas Genset Market Revenue Share, By Application (2015 & 2022F)
9.5 Middle East Gas Genset Market Revenues, By Application (2010-2022F)
9.6 Middle East Gas Genset Market Revenue Share, By Vertical (2015 & 2022F)
9.7 Middle East Gas Genset Market Revenues, By Vertical (2010-2022F)
9.8 Middle East Gas Genset Market Revenues, By Country
9.8.1 Saudi Arabia Gas Genset Market Revenues (2010-2022F)
9.8.1.1 Saudi Arabia Electricity Generation & Consumption (2000-2012)
9.8.2 UAE Gas Genset Market Revenues (2010-2022F)
9.8.2.1 UAE Electricity Generation & Consumption (2000-2012)
9.8.3 Qatar Gas Genset Market Revenues (2010-2022F)
9.8.3.1 Qatar Electricity Generation & Consumption (2000-2012)
9.8.4 Other Middle Eastern Countries Gas Genset Market Revenues (2010-2022F)
10 Africa Gas Genset Market Overview
10.1 Africa Gas Genset Market Revenues & Volume (2010-2022F)
10.2 Africa Gas Genset Market Revenue Share, By Power Rating (2015 & 2022F)
10.3 Africa Gas Genset Market Revenues, By Power Rating (2010-2022F)
10.4 Africa Gas Genset Market Revenue Share, By Application (2015 & 2022F)
10.5 Africa Gas Genset Market Revenues, By Application (2010-2022F)
10.6 Africa Gas Genset Market Revenue Share, By Vertical (2015 & 2022F)
10.7 Africa Gas Genset Market Revenues, By Vertical (2010-2022F)
10.8 Africa Gas Genset Market Revenues, By Country
10.8.1 South Africa Gas Genset Market Revenues (2010-2022F)
10.8.1.1 South Africa Electricity Generation & Consumption (2000-2012)
10.8.2 Other African Countries Gas Genset Market Revenues (2010-2022F)
11 Asia Pacific Gas Genset Market Overview
11.1 Asia Pacific Gas Genset Market Revenues & Volume (2010-2022F)
11.2 Asia Pacific Gas Genset Market Revenue Share, By Power Rating (2015 & 2022F)
11.3 Asia Pacific Gas Genset Market Revenues, By Power Rating (2010-2022F)
11.4 Asia Pacific Gas Genset Market Revenue Share, By Application (2015 & 2022F)
11.5 Asia Pacific Gas Genset Market Revenues, By Application (2010-2022F)
11.6 Asia Pacific Gas Genset Market Revenue Share, By Vertical (2015 & 2022F)
11.7 Asia Pacific Gas Genset Market Revenues, By Vertical (2010-2022F)
11.8 Asia Pacific Gas Genset Market Revenues, By Country
11.8.1 China Gas Genset Market Revenues (2010-2022F)
11.8.1.1 China Electricity Generation & Consumption (2000-2012)
11.8.2 India Gas Genset Market Revenues (2010-2022F)
11.8.2.1 India Electricity Generation & Consumption (2000-2012)
11.8.3 Other Asia Pacific Countries Gas Genset Market Revenues (2010-2022F)
12 Competitive Landscape
12.1 Global Gas Genset Market Revenue Share, By Company (2014)
12.2 Competitive Benchmarking, By Gas Genset Rating
12.3 Competitive Benchmarking, By Operating Parameter
13 Company Profiles
13.1 Briggs & Stratton Corporation
13.2 Caterpillar Inc.
13.3 Cummins Inc.
13.4 Dresser-Rand Group, Inc.
13.5 Generac Holdings Inc.
13.6 General Electric Company
13.7 Himoinsa SL
13.8 Kohler Co.
13.9 MTU Onsite Energy GmbH
13.10 W RTSIL OYJ ABP
14 Key Strategic Pointers
15 Disclaimer
List of Figures
Figure 1 Global Gas Genset Market Revenues & Volume, 2010-2022F ($ Billion & Thousand Units)
Figure 2 Global Gas Genset Market- Industry Life Cycle
Figure 3 Global Gas Genset Market-Porters 5 Forces Model
Figure 4 Global Gas Genset Market Revenue Share, By Power Rating, 2015 & 2022F
Figure 5 Global Gas Genset Market Revenue Share, By Application, 2015 & 2022F
Figure 6 Global Gas Genset Market Revenue Share, By Vertical, 2015 & 2022F
Figure 7 Global Gas Genset Market Revenue Share, By Region, 2015
Figure 8 Global Construction Market Revenues, 2014-2022F ($ Trillion)
Figure 9 Comparison of Natural Gas Prices and Crude Oil Prices, 2005-2014 ($ per million Btu)
Figure 10 Renewable Energy Share in Global Electricity Production, 2014
Figure 11 Global Gas Genset & Diesel Genset Market Revenues, 2014-2022F ($ Billion)
Figure 12 North America Gas Genset Market Revenues & Volume, 2010-2022F ($ Million & Thousand Units)
Figure 13 North America Gas Genset Market Revenue Share, By Power Rating, 2015 & 2022F
Figure 14 North America Gas Genset Market Revenue Share, By Application, 2015 & 2022F
Figure 15 North America Gas Genset Market Revenue Share, By Vertical, 2015 & 2022F
Figure 16 U.S. Gas Genset Market Revenues, 2010-2022F ($ Million)
Figure 17 U.S. Electricity Generation & Consumption, 2000-2012 (Trillion kWh )
Figure 18 Canada Gas Genset Market Revenues, 2010-2022F ($ Million)
Figure 19 Canada Electricity Generation & Consumption, 2000-2012 (Terawatt hour)
Figure 20 Latin America Gas Genset Market Revenues & Volume, 2010-2022F ($ Million & Thousand Units)
Figure 21 Latin America Gas Genset Market Revenue Share, By Power Rating, 2015 & 2022F
Figure 22 Latin America Gas Genset Market Revenue Share, By Application, 2015 & 2022F
Figure 23 Latin America Gas Genset Market Revenue Share, By Vertical, 2015 & 2022F
Figure 24 Brazil Gas Genset Market Revenues, 2010-2022F ($ Million)
Figure 25 Brazil Electricity Generation & Consumption, 2000-2012 (Terawatt hour)
Figure 26 Mexico Gas Genset Market Revenues, 2010-2022F ($ Million)
Figure 27 Mexico Electricity Generation & Consumption, 2000-2012 (Terawatt hour)
Figure 28 Other Latin American Countries Gas Genset Market Revenues, 2010-2022F ($ Million)
Figure 29 Europe Gas Genset Market Revenues & Volume, 2010-2022F ($ Million & Thousand Units)
Figure 30 Europe Gas Genset Market Revenue Share, By Power Rating, 2015 & 2022F
Figure 31 Europe Gas Genset Market Revenue Share, By Application, 2015 & 2022F
Figure 32 Europe Gas Genset Market Revenue Share, By Vertical, 2015 & 2022F
Figure 33 Germany Gas Genset Market Revenues, 2010-2022F ($ Million)
Figure 34 Germany Electricity Generation & Consumption, 2000-2012 (Terawatt hour)
Figure 35 Russia Gas Genset Market Revenues, 2010-2022F ($ Million)
Figure 36 Russia Electricity Generation & Consumption, 2000-2012 (Terawatt hour)
Figure 37 UK Gas Genset Market Revenues, 2010-2022F ($ Million)
Figure 38 UK Electricity Generation & Consumption, 2000-2012 (Terawatt hour)
Figure 39 Other European Countries Gas Genset Market Revenues, 2010-2022F ($ Million)
Figure 40 Middle East Gas Genset Market Revenues & Volume, 2010-2022F ($ Million & Thousand Units)
Figure 41 Middle East Gas Genset Market Revenue Share, By Power Rating, 2015 & 2022F
Figure 42 Middle East Gas Genset Market Revenue Share, By Application, 2015 & 2022F
Figure 43 Middle East Gas Genset Market Revenue Share, By Vertical, 2015 & 2022F
Figure 44 Saudi Arabia Gas Genset Market Revenues, 2010-2022F ($ Million)
Figure 45 Saudi Arabia Electricity Generation & Consumption, 2000-2012 (Terawatt hour)
Figure 46 UAE Gas Genset Market Revenues, 2010-2022F ($ Million)
Figure 47 UAE Electricity Generation & Consumption, 2000-2012 (Terawatt hour)
Figure 48 Qatar Gas Genset Market Revenues, 2010-2022F ($ Million)
Figure 49 Qatar Electricity Generation & Consumption, 2000-2012 (Terawatt hour)
Figure 50 Other Middle Eastern Gas Genset Market Revenues, 2010-2022F ($ Million)
Figure 51 Africa Gas Genset Market Revenues & Volume, 2010-2022F ($ Million & Thousand Units)
Figure 52 Africa Gas Genset Market Revenue Share, By Power Rating, 2015 & 2022F
Figure 53 Africa Gas Genset Market Revenue Share, By Application, 2015 & 2022F
Figure 54 Africa Gas Genset Market Revenue Share, By Vertical, 2015 & 2022F
Figure 55 South Africa Gas Genset Market Revenues, 2010-2022F ($ Million)
Figure 56 South Africa Electricity Generation & Consumption, 2000-2012 (Terawatt hour)
Figure 57 Other African Countries Gas Genset Market Revenues, 2010-2022F ($ Million)
Figure 58 Asia Pacific Gas Genset Market Revenues & Volume, 2010-2022F ($ Million & Thousand Units)
Figure 59 Asia Pacific Gas Genset Market Revenue Share, By Power Rating, 2015 & 2022F
Figure 60 Asia Pacific Gas Genset Market Revenue Share, By Application, 2015 & 2022F
Figure 61 Asia Pacific Gas Genset Market Revenue Share, By Vertical, 2015 & 2022F
Figure 62 China Gas Genset Market Revenues, 2010-2022F ($ Million)
Figure 63 China Electricity Generation & Consumption, 2000-2012 (Terawatt hour)
Figure 64 India Gas Genset Market Revenues, 2010-2022F ($ Million)
Figure 65 India Electricity Generation & Consumption, 2000-2012 (Terawatt hour)
Figure 66 Other Asia Pacific Countries Gas Genset Market Revenues, 2010-2022F ($ Million)
Figure 67 Global Gas Genset Market Revenue Share, By Company, 2014
List of Tables
Table 1 Global Gas Genset Market Revenues, By Power Rating, 2010-2015 ($ Million)
Table 2 Global Gas Genset Market Revenues, By Power Rating, 2016E-2022F ($ Million)
Table 3 Global Gas Genset Market Revenues, By Application, 2010-2015 ($ Million)
Table 4 Global Gas Genset Market Revenues, By Application, 2016E-2022F ($ Million)
Table 5 Global Gas Genset Market Revenues, By Vertical, 2010-2015 ($ Million)
Table 6 Global Gas Genset Market Revenues, By Vertical, 2016E-2022F ($ Million)
Table 7 North America Gas Genset Market Revenues, By Power Rating, 2010-2015 ($ Million)
Table 8 North America Gas Genset Market Revenues, By Power Rating, 2016E-2022F ($ Million)
Table 9 North America Gas Genset Market Revenues, By Application, 2010-2015 ($ Million)
Table 10 North America Gas Genset Market Revenues, By Application, 2016E-2022F ($ Million)
Table 11 North America Gas Genset Market Revenues, By Vertical, 2010-2015 ($ Million)
Table 12 North America Gas Genset Market Revenues, By Vertical, 2016E-2022F ($ Million)
Table 13 Latin America Gas Genset Market Revenues, By Power Rating, 2010-2015 ($ Million)
Table 14 Latin America Gas Genset Market Revenues, By Power Rating, 2016E-2022F ($ Million)
Table 15 Latin America Gas Genset Market Revenues, By Application, 2010-2015 ($ Million)
Table 16 Latin America Gas Genset Market Revenues, By Application, 2016E-2022F ($ Million)
Table 17 Latin America Gas Genset Market Revenues, By Vertical, 2010-2015 ($ Million)
Table 18 Latin America Gas Genset Market Revenues, By Vertical, 2016E-2022F ($ Million)
Table 19 Europe Gas Genset Market Revenues, By Power Rating, 2010-2015 ($ Million)
Table 20 Europe Gas Genset Market Revenues, By Power Rating, 2016E-2022F ($ Million)
Table 21 Europe Gas Genset Market Revenues, By Application, 2010-2015 ($ Million)
Table 22 Europe Gas Genset Market Revenues, By Application, 2016E-2022F ($ Million)
Table 23 Europe Gas Genset Market Revenues, By Vertical, 2010-2015 ($ Million)
Table 24 Europe Gas Genset Market Revenues, By Vertical, 2016E-2022F ($ Million)
Table 25 Middle East Gas Genset Market Revenues, By Power Rating, 2010-2015 ($ Million)
Table 26 Middle East Gas Genset Market Revenues, By Power Rating, 2016E-2022F ($ Million)
Table 27 Middle East Gas Genset Market Revenues, By Application, 2010-2015 ($ Million)
Table 28 Middle East Gas Genset Market Revenues, By Application, 2016E-2022F ($ Million)
Table 29 Middle East Gas Genset Market Revenues, By Vertical, 2010-2015 ($ Million)
Table 30 Middle East Gas Genset Market Revenues, By Vertical, 2016E-2022F ($ Million)
Table 31 Africa Gas Genset Market Revenues, By Power Rating, 2010-2015 ($ Million)
Table 32 Africa Gas Genset Market Revenues, By Power Rating, 2016E-2022F ($ Million)
Table 33 Africa Gas Genset Market Revenues, By Application, 2010-2015 ($ Million)
Table 34 Africa Gas Genset Market Revenues, By Application, 2016E-2022F ($ Million)
Table 35 Africa Gas Genset Market Revenues, By Vertical, 2010-2015 ($ Million)
Table 36 Africa Gas Genset Market Revenues, By Vertical, 2016E-2022F ($ Million)
Table 37 Asia Pacific Gas Genset Market Revenues, By Power Rating, 2010-2015 ($ Million)
Table 38 Asia Pacific Gas Genset Market Revenues, By Power Rating, 2016E-2022F ($ Million)
Table 39 Asia Pacific Gas Genset Market Revenues, By Application, 2010-2015 ($ Million)
Table 40 Asia Pacific Gas Genset Market Revenues, By Application, 2016E-2022F ($ Million)
Table 41 Asia Pacific Gas Genset Market Revenues, By Vertical, 2010-2015 ($ Million)
Table 42 Asia Pacific Gas Genset Market Revenues, By Vertical, 2016E-2022F ($ Million)
The global Gas Genset market is forecast to exhibit steady growth on account of rising power demand, unreliable grid infrastructure, industrialization, commercialization, and construction of large-scale public infrastructure. The Asia Pacific is the key revenue-generating region in Global Gas Genset Market in 2015 followed by North America.
Global Go To Market Strategy - 2030
Export potential enables firms to identify high-growth global markets with greater confidence by combining advanced trade intelligence with a structured quantitative methodology. The framework analyzes emerging demand trends and country-level import patterns while integrating macroeconomic and trade datasets such as GDP and population forecasts, bilateral import–export flows, tariff structures, elasticity differentials between developed and developing economies, geographic distance, and import demand projections. Using weighted trade values from 2020–2024 as the base period to project country-to-country export potential for 2030, these inputs are operationalized through calculated drivers such as gravity model parameters, tariff impact factors, and projected GDP per-capita growth. Through an analysis of hidden potentials, demand hotspots, and market conditions that are most favorable to success, this method enables firms to focus on target countries, maximize returns, and global expansion with data, backed by accuracy.
By factoring in the projected importer demand gap that is currently unmet and could be potential opportunity, it identifies the potential for the Exporter (Country) among 190 countries, against the general trade analysis, which identifies the biggest importer or exporter.
To discover high-growth global markets and optimize your business strategy:
Click Here
Pricing
- Single User License$ 4,560
- Department License$ 5,055
- Site License$ 5,595
- Global License$ 6,000

Leadership Perspectives from Industry Events
Search
Thought Leadership and Analyst Meet


Our Clients
6WResearch In News
- India Air Conditioner Market Set for Strong Rebound in 2026 After Weather-Led Correction and GST-Driven Recovery: 6Wresearch
- ADAS in India: How Automatic Emergency Braking, Blind Spot Detection & Driver Monitoring are Transforming Road Safety
- Doha a strategic location for EV manufacturing hub: IPA Qatar
- Demand for luxury TVs surging in the GCC, says Samsung
- Empowering Growth: The Thriving Journey of Bangladesh’s Cable Industry
- Demand for luxury TVs surging in the GCC, says Samsung
Latest Reports
- Nicaragua RPG Gaming Market (2026-2032)
- New Zealand RPG Gaming Market (2026-2032)
- Netherlands RPG Gaming Market (2026-2032)
- Nauru RPG Gaming Market (2026-2032)
- Namibia RPG Gaming Market (2026-2032)
- Mozambique RPG Gaming Market (2026-2032)
- Montenegro RPG Gaming Market (2026-2032)
- Mongolia RPG Gaming Market (2026-2032)
- Monaco RPG Gaming Market (2026-2032)
- Micronesia RPG Gaming Market (2026-2032)
Industry Events and Analyst Meet

EV India Expo 2026

HIMTEX 2026

India Refining Summit 2026

India EV Show 2026

EV tech India Expo 2026
Whitepaper
- Middle East & Africa Commercial Security Market Click here to view more.
- Middle East & Africa Fire Safety Systems & Equipment Market Click here to view more.
- GCC Drone Market Click here to view more.
- Middle East Lighting Fixture Market Click here to view more.
- GCC Physical & Perimeter Security Market Click here to view more.