Armenia Power Quality Equipment Market (2026-2032) | Size, Growth, Segmentation, Outlook, Value, Industry, Analysis, Share, Trends, Revenue, Companies & Forecast
Market Forecast By Equipment (UPS, Harmonic Filters, Surge Protection Devices, Voltage Regulators, Static VAR compensators, Power Quality Meters), By Phase (Single , Three Phase) And Competitive Landscape
| Product Code: ETC5762603 | Publication Date: Nov 2023 | Updated Date: Feb 2026 | Product Type: Market Research Report | |
| Publisher: 6Wresearch | Author: Sumit Sagar | No. of Pages: 60 | No. of Figures: 30 | No. of Tables: 5 |
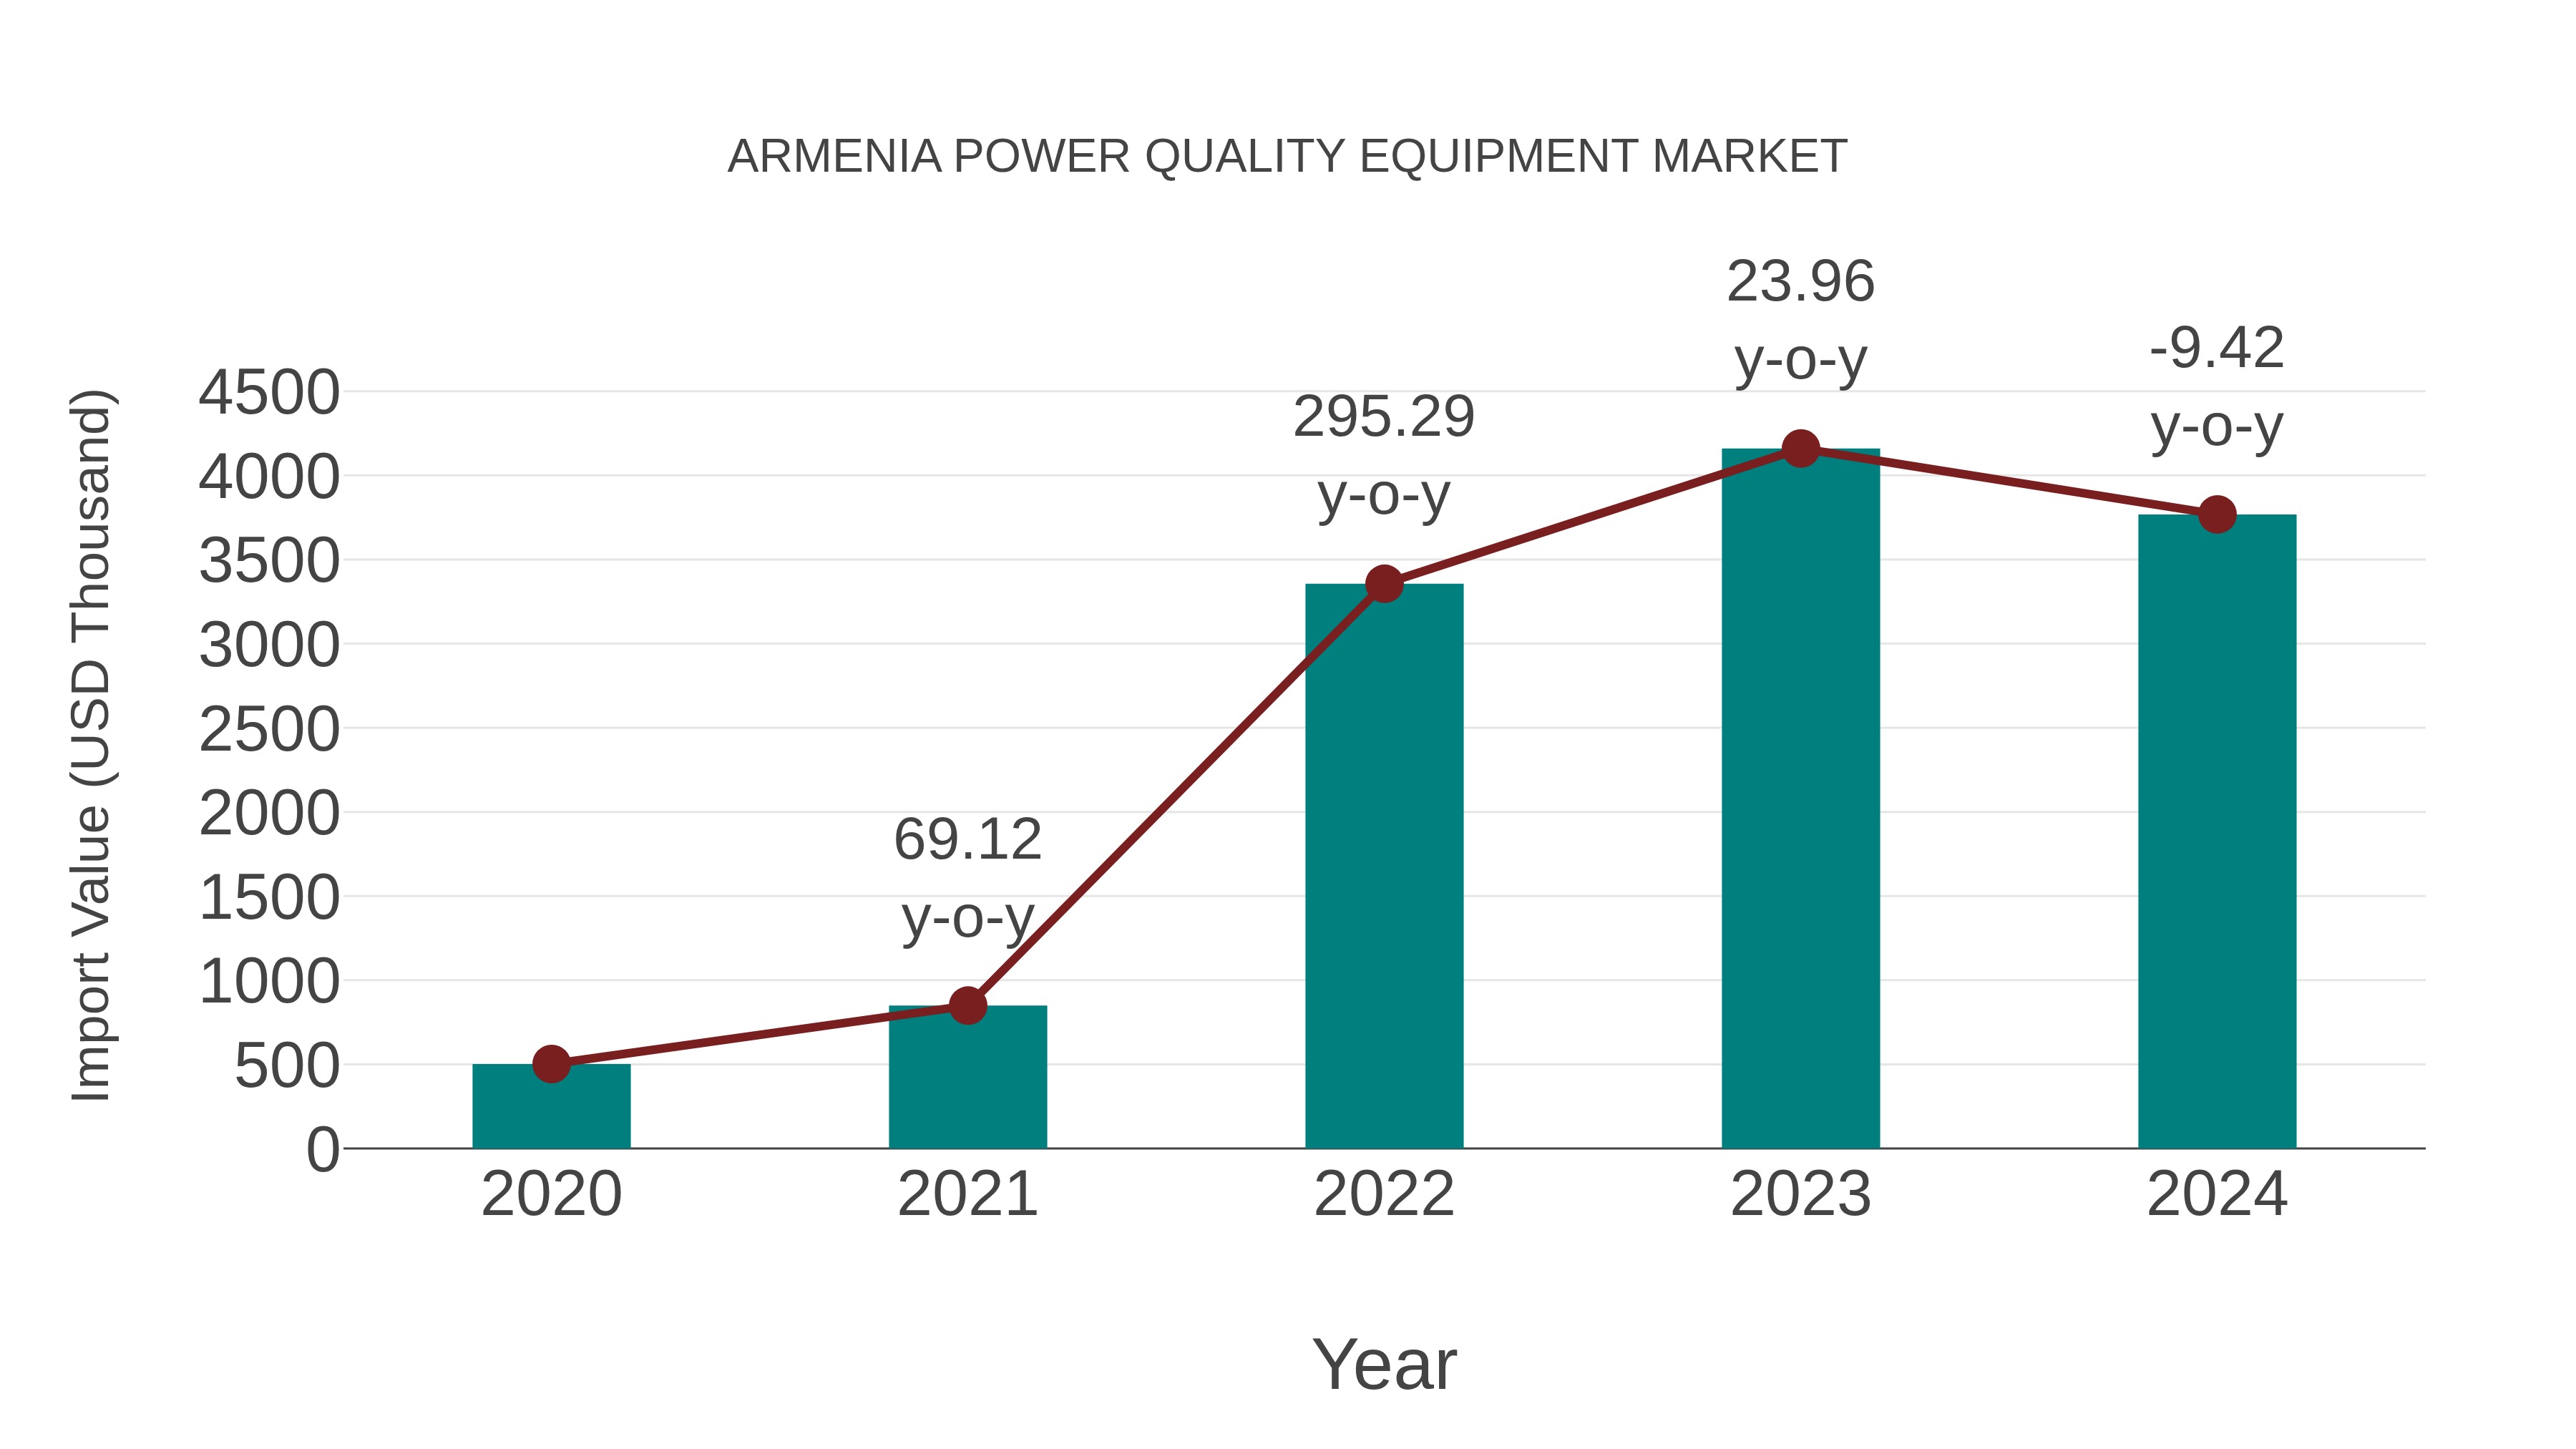
Armenia Power Quality Equipment Market: Import Trend Analysis
The Armenia power quality equipment market witnessed a significant increase in imports from 2020 to 2024. The compound annual growth rate (CAGR) for this period stood at 65.52%. In 2023-2024, there was a year-on-year growth rate of -9.42%, indicating a slight decline compared to previous years.
Armenia Power Quality Equipment Market Overview
Armenia`s power quality equipment market provides devices and solutions for mitigating electrical disturbances, harmonics, and voltage fluctuations in power grids and industrial systems. Power quality equipment enhances equipment reliability, protects sensitive electronics, and improves energy efficiency.
Drivers of the market
The power quality equipment market in Armenia is driven by the need to ensure reliable and efficient power supply in various applications, such as industrial, commercial, and residential sectors. Power quality equipment helps mitigate issues such as voltage fluctuations, harmonics, and power interruptions, ensuring the smooth operation of electrical systems. The increasing focus on improving energy efficiency and system reliability fuels the market. Additionally, the growth of renewable energy sources and the integration of distributed generation supports the demand for power quality solutions. Technological advancements in power quality equipment and the development of more efficient and intelligent solutions further enhance market growth.
Challenges of the market
The Power Quality Equipment market in Armenia faces challenges such as improving voltage regulation and harmonic suppression in electrical networks, optimizing equipment compatibility with sensitive electronic devices, and addressing grid instability issues. Innovating in active power filters and deploying grid-level energy storage solutions are critical for maintaining power quality standards and supporting reliable electricity supply in Armenia.
Government Policy of the market
Armenia`s policies for the power quality equipment market focus on improving grid reliability, promoting energy efficiency, and ensuring compliance with international standards. Government initiatives aim to support the deployment of advanced quality equipment, enhance power stability, and reduce electrical disruptions.
Key Highlights of the Report:
- Armenia Power Quality Equipment Market Outlook
- Market Size of Armenia Power Quality Equipment Market, 2025
- Forecast of Armenia Power Quality Equipment Market, 2032
- Historical Data and Forecast of Armenia Power Quality Equipment Revenues & Volume for the Period 2022-2032F
- Armenia Power Quality Equipment Market Trend Evolution
- Armenia Power Quality Equipment Market Drivers and Challenges
- Armenia Power Quality Equipment Price Trends
- Armenia Power Quality Equipment Porter`s Five Forces
- Armenia Power Quality Equipment Industry Life Cycle
- Historical Data and Forecast of Armenia Power Quality Equipment Market Revenues & Volume By Equipment for the Period 2022-2032F
- Historical Data and Forecast of Armenia Power Quality Equipment Market Revenues & Volume By UPS for the Period 2022-2032F
- Historical Data and Forecast of Armenia Power Quality Equipment Market Revenues & Volume By Harmonic Filters for the Period 2022-2032F
- Historical Data and Forecast of Armenia Power Quality Equipment Market Revenues & Volume By Surge Protection Devices for the Period 2022-2032F
- Historical Data and Forecast of Armenia Power Quality Equipment Market Revenues & Volume By Voltage Regulators for the Period 2022-2032F
- Historical Data and Forecast of Armenia Power Quality Equipment Market Revenues & Volume By Static VAR compensators for the Period 2022-2032F
- Historical Data and Forecast of Armenia Power Quality Equipment Market Revenues & Volume By Power Quality Meters for the Period 2022-2032F
- Historical Data and Forecast of Armenia Power Quality Equipment Market Revenues & Volume By Phase for the Period 2022-2032F
- Historical Data and Forecast of Armenia Power Quality Equipment Market Revenues & Volume By Single for the Period 2022-2032F
- Historical Data and Forecast of Armenia Power Quality Equipment Market Revenues & Volume By Three Phase for the Period 2022-2032F
- Armenia Power Quality Equipment Import Export Trade Statistics
- Market Opportunity Assessment By Equipment
- Market Opportunity Assessment By Phase
- Armenia Power Quality Equipment Top Companies Market Share
- Armenia Power Quality Equipment Competitive Benchmarking By Technical and Operational Parameters
- Armenia Power Quality Equipment Company Profiles
- Armenia Power Quality Equipment Key Strategic Recommendations
Frequently Asked Questions About the Market Study (FAQs):
6Wresearch actively monitors the Armenia Power Quality Equipment Market and publishes its comprehensive annual report, highlighting emerging trends, growth drivers, revenue analysis, and forecast outlook. Our insights help businesses to make data-backed strategic decisions with ongoing market dynamics. Our analysts track relevent industries related to the Armenia Power Quality Equipment Market, allowing our clients with actionable intelligence and reliable forecasts tailored to emerging regional needs.
Yes, we provide customisation as per your requirements. To learn more, feel free to contact us on sales@6wresearch.com
1 Executive Summary |
2 Introduction |
2.1 Key Highlights of the Report |
2.2 Report Description |
2.3 Market Scope & Segmentation |
2.4 Research Methodology |
2.5 Assumptions |
3 Armenia Power Quality Equipment Market Overview |
3.1 Armenia Country Macro Economic Indicators |
3.2 Armenia Power Quality Equipment Market Revenues & Volume, 2022 & 2032F |
3.3 Armenia Power Quality Equipment Market - Industry Life Cycle |
3.4 Armenia Power Quality Equipment Market - Porter's Five Forces |
3.5 Armenia Power Quality Equipment Market Revenues & Volume Share, By Equipment, 2022 & 2032F |
3.6 Armenia Power Quality Equipment Market Revenues & Volume Share, By Phase, 2022 & 2032F |
4 Armenia Power Quality Equipment Market Dynamics |
4.1 Impact Analysis |
4.2 Market Drivers |
4.2.1 Increasing demand for reliable power supply in Armenia |
4.2.2 Growing adoption of renewable energy sources in the country |
4.2.3 Government initiatives to improve power infrastructure and quality |
4.3 Market Restraints |
4.3.1 High initial investment cost for power quality equipment |
4.3.2 Lack of awareness and technical expertise in implementing power quality solutions |
4.3.3 Economic instability and fluctuations in the energy sector |
5 Armenia Power Quality Equipment Market Trends |
6 Armenia Power Quality Equipment Market Segmentations |
6.1 Armenia Power Quality Equipment Market, By Equipment |
6.1.1 Overview and Analysis |
6.1.2 Armenia Power Quality Equipment Market Revenues & Volume, By UPS, 2022-2032F |
6.1.3 Armenia Power Quality Equipment Market Revenues & Volume, By Harmonic Filters, 2022-2032F |
6.1.4 Armenia Power Quality Equipment Market Revenues & Volume, By Surge Protection Devices, 2022-2032F |
6.1.5 Armenia Power Quality Equipment Market Revenues & Volume, By Voltage Regulators, 2022-2032F |
6.1.6 Armenia Power Quality Equipment Market Revenues & Volume, By Static VAR compensators, 2022-2032F |
6.1.7 Armenia Power Quality Equipment Market Revenues & Volume, By Power Quality Meters, 2022-2032F |
6.2 Armenia Power Quality Equipment Market, By Phase |
6.2.1 Overview and Analysis |
6.2.2 Armenia Power Quality Equipment Market Revenues & Volume, By Single , 2022-2032F |
6.2.3 Armenia Power Quality Equipment Market Revenues & Volume, By Three Phase, 2022-2032F |
7 Armenia Power Quality Equipment Market Import-Export Trade Statistics |
7.1 Armenia Power Quality Equipment Market Export to Major Countries |
7.2 Armenia Power Quality Equipment Market Imports from Major Countries |
8 Armenia Power Quality Equipment Market Key Performance Indicators |
8.1 Average downtime reduction achieved by the use of power quality equipment |
8.2 Percentage increase in the adoption of power quality solutions in key industries |
8.3 Improvement in power grid stability and reliability measured by frequency of power outages and voltage fluctuations |
9 Armenia Power Quality Equipment Market - Opportunity Assessment |
9.1 Armenia Power Quality Equipment Market Opportunity Assessment, By Equipment, 2022 & 2032F |
9.2 Armenia Power Quality Equipment Market Opportunity Assessment, By Phase, 2022 & 2032F |
10 Armenia Power Quality Equipment Market - Competitive Landscape |
10.1 Armenia Power Quality Equipment Market Revenue Share, By Companies, 2032 |
10.2 Armenia Power Quality Equipment Market Competitive Benchmarking, By Operating and Technical Parameters |
11 Company Profiles |
12 Recommendations | 13 Disclaimer |
Export potential assessment - trade Analytics for 2030
Export potential enables firms to identify high-growth global markets with greater confidence by combining advanced trade intelligence with a structured quantitative methodology. The framework analyzes emerging demand trends and country-level import patterns while integrating macroeconomic and trade datasets such as GDP and population forecasts, bilateral import–export flows, tariff structures, elasticity differentials between developed and developing economies, geographic distance, and import demand projections. Using weighted trade values from 2020–2024 as the base period to project country-to-country export potential for 2030, these inputs are operationalized through calculated drivers such as gravity model parameters, tariff impact factors, and projected GDP per-capita growth. Through an analysis of hidden potentials, demand hotspots, and market conditions that are most favorable to success, this method enables firms to focus on target countries, maximize returns, and global expansion with data, backed by accuracy.
By factoring in the projected importer demand gap that is currently unmet and could be potential opportunity, it identifies the potential for the Exporter (Country) among 190 countries, against the general trade analysis, which identifies the biggest importer or exporter.
To discover high-growth global markets and optimize your business strategy:
Click Here
Pricing
- Single User License$ 1,995
- Department License$ 2,400
- Site License$ 3,120
- Global License$ 3,795

Search
Thought Leadership and Analyst Meet


Our Clients
Related Reports
- Iraq Insulation and Waterproofing Market (2026-2032) | Outlook, Drivers, Growth, Size, Share, Industry, Revenue, Trends, Demand, Competitive, Strategic Insights, Opportunities, Segments, Companies, Challenges, Strategy, Consumer Insights, Analysis, Investment Trends, Value, Segmentation, Forecast, Restraints
- India Switchgear Market Outlook (2026 - 2032) | Size, Share, Trends, Growth, Revenue, Forecast, Analysis, Value, Outlook
- Pakistan Contraceptive Implants Market (2025-2031) | Demand, Growth, Size, Share, Industry, Pricing Analysis, Competitive, Strategic Insights, Strategy, Consumer Insights, Analysis, Investment Trends, Opportunities, Revenue, Segments, Value, Segmentation, Supply, Forecast, Restraints, Outlook, Competition, Drivers, Trends, Companies, Challenges
- Sri Lanka Packaging Market (2026-2032) | Outlook, Competition, Drivers, Trends, Demand, Pricing Analysis, Competitive, Strategic Insights, Companies, Challenges, Strategy, Consumer Insights, Analysis, Investment Trends, Opportunities, Growth, Size, Share, Industry, Revenue, Segments, Value, Segmentation, Supply, Forecast, Restraints
- India Kids Watches Market (2026-2032) | Strategy, Consumer Insights, Analysis, Investment Trends, Opportunities, Growth, Size, Share, Industry, Revenue, Segments, Value, Segmentation, Supply, Forecast, Restraints, Outlook, Competition, Drivers, Trends, Demand, Pricing Analysis, Competitive, Strategic Insights, Companies, Challenges
- Saudi Arabia Core Assurance Service Market (2025-2031) | Strategy, Consumer Insights, Analysis, Investment Trends, Opportunities, Growth, Size, Share, Industry, Revenue, Segments, Value, Segmentation, Supply, Forecast, Restraints, Outlook, Competition, Drivers, Trends, Demand, Pricing Analysis, Competitive, Strategic Insights, Companies, Challenges
- Romania Uninterruptible Power Supply (UPS) Market (2026-2032) | Industry, Analysis, Revenue, Size, Forecast, Outlook, Value, Trends, Share, Growth & Companies
- Saudi Arabia Car Window Tinting Film, Paint Protection Film (PPF), and Ceramic Coating Market (2025-2031) | Strategy, Consumer Insights, Analysis, Investment Trends, Opportunities, Growth, Size, Share, Industry, Revenue, Segments, Value, Segmentation, Supply, Forecast, Restraints, Outlook, Competition, Drivers, Trends, Demand, Pricing Analysis, Competitive, Strategic Insights, Companies, Challenges
- South Africa Stationery Market (2025-2031) | Share, Size, Industry, Value, Growth, Revenue, Analysis, Trends, Segmentation & Outlook
- Afghanistan Rocking Chairs And Adirondack Chairs Market (2026-2032) | Size & Revenue, Competitive Landscape, Share, Segmentation, Industry, Value, Outlook, Analysis, Trends, Growth, Forecast, Companies
Industry Events and Analyst Meet

India EV Show 2026

EV tech India Expo 2026

Auto Tech Asia 2026

Battery Tech India 2026

Smart Production Solutions Guangzhou 2026
Whitepaper
- Middle East & Africa Commercial Security Market Click here to view more.
- Middle East & Africa Fire Safety Systems & Equipment Market Click here to view more.
- GCC Drone Market Click here to view more.
- Middle East Lighting Fixture Market Click here to view more.
- GCC Physical & Perimeter Security Market Click here to view more.
6WResearch In News
- Doha a strategic location for EV manufacturing hub: IPA Qatar
- Demand for luxury TVs surging in the GCC, says Samsung
- Empowering Growth: The Thriving Journey of Bangladesh’s Cable Industry
- Demand for luxury TVs surging in the GCC, says Samsung
- Video call with a traditional healer? Once unthinkable, it’s now common in South Africa
- Intelligent Buildings To Smooth GCC’s Path To Net Zero