Australia Bleaching Clays Market (2025-2031) Outlook | Revenue, Growth, Industry, Companies, Trends, Share, Value, Analysis, Size & Forecast
Market Forecast By Type (Activated Bauxite, Activated Clays, Fuller's Earth), By Application (Industrial Oil, Mineral Oil and Waxes, Vegetable Oil and Animal Fats), By End-user Industry (Food and Beverage, Cosmetics and Personal Care, Chemicals, Other End-user Industries) And Competitive Landscape
| Product Code: ETC315335 | Publication Date: Aug 2022 | Updated Date: Jan 2026 | Product Type: Market Research Report | |
| Publisher: 6Wresearch | Author: Shubham Padhi | No. of Pages: 75 | No. of Figures: 35 | No. of Tables: 20 |
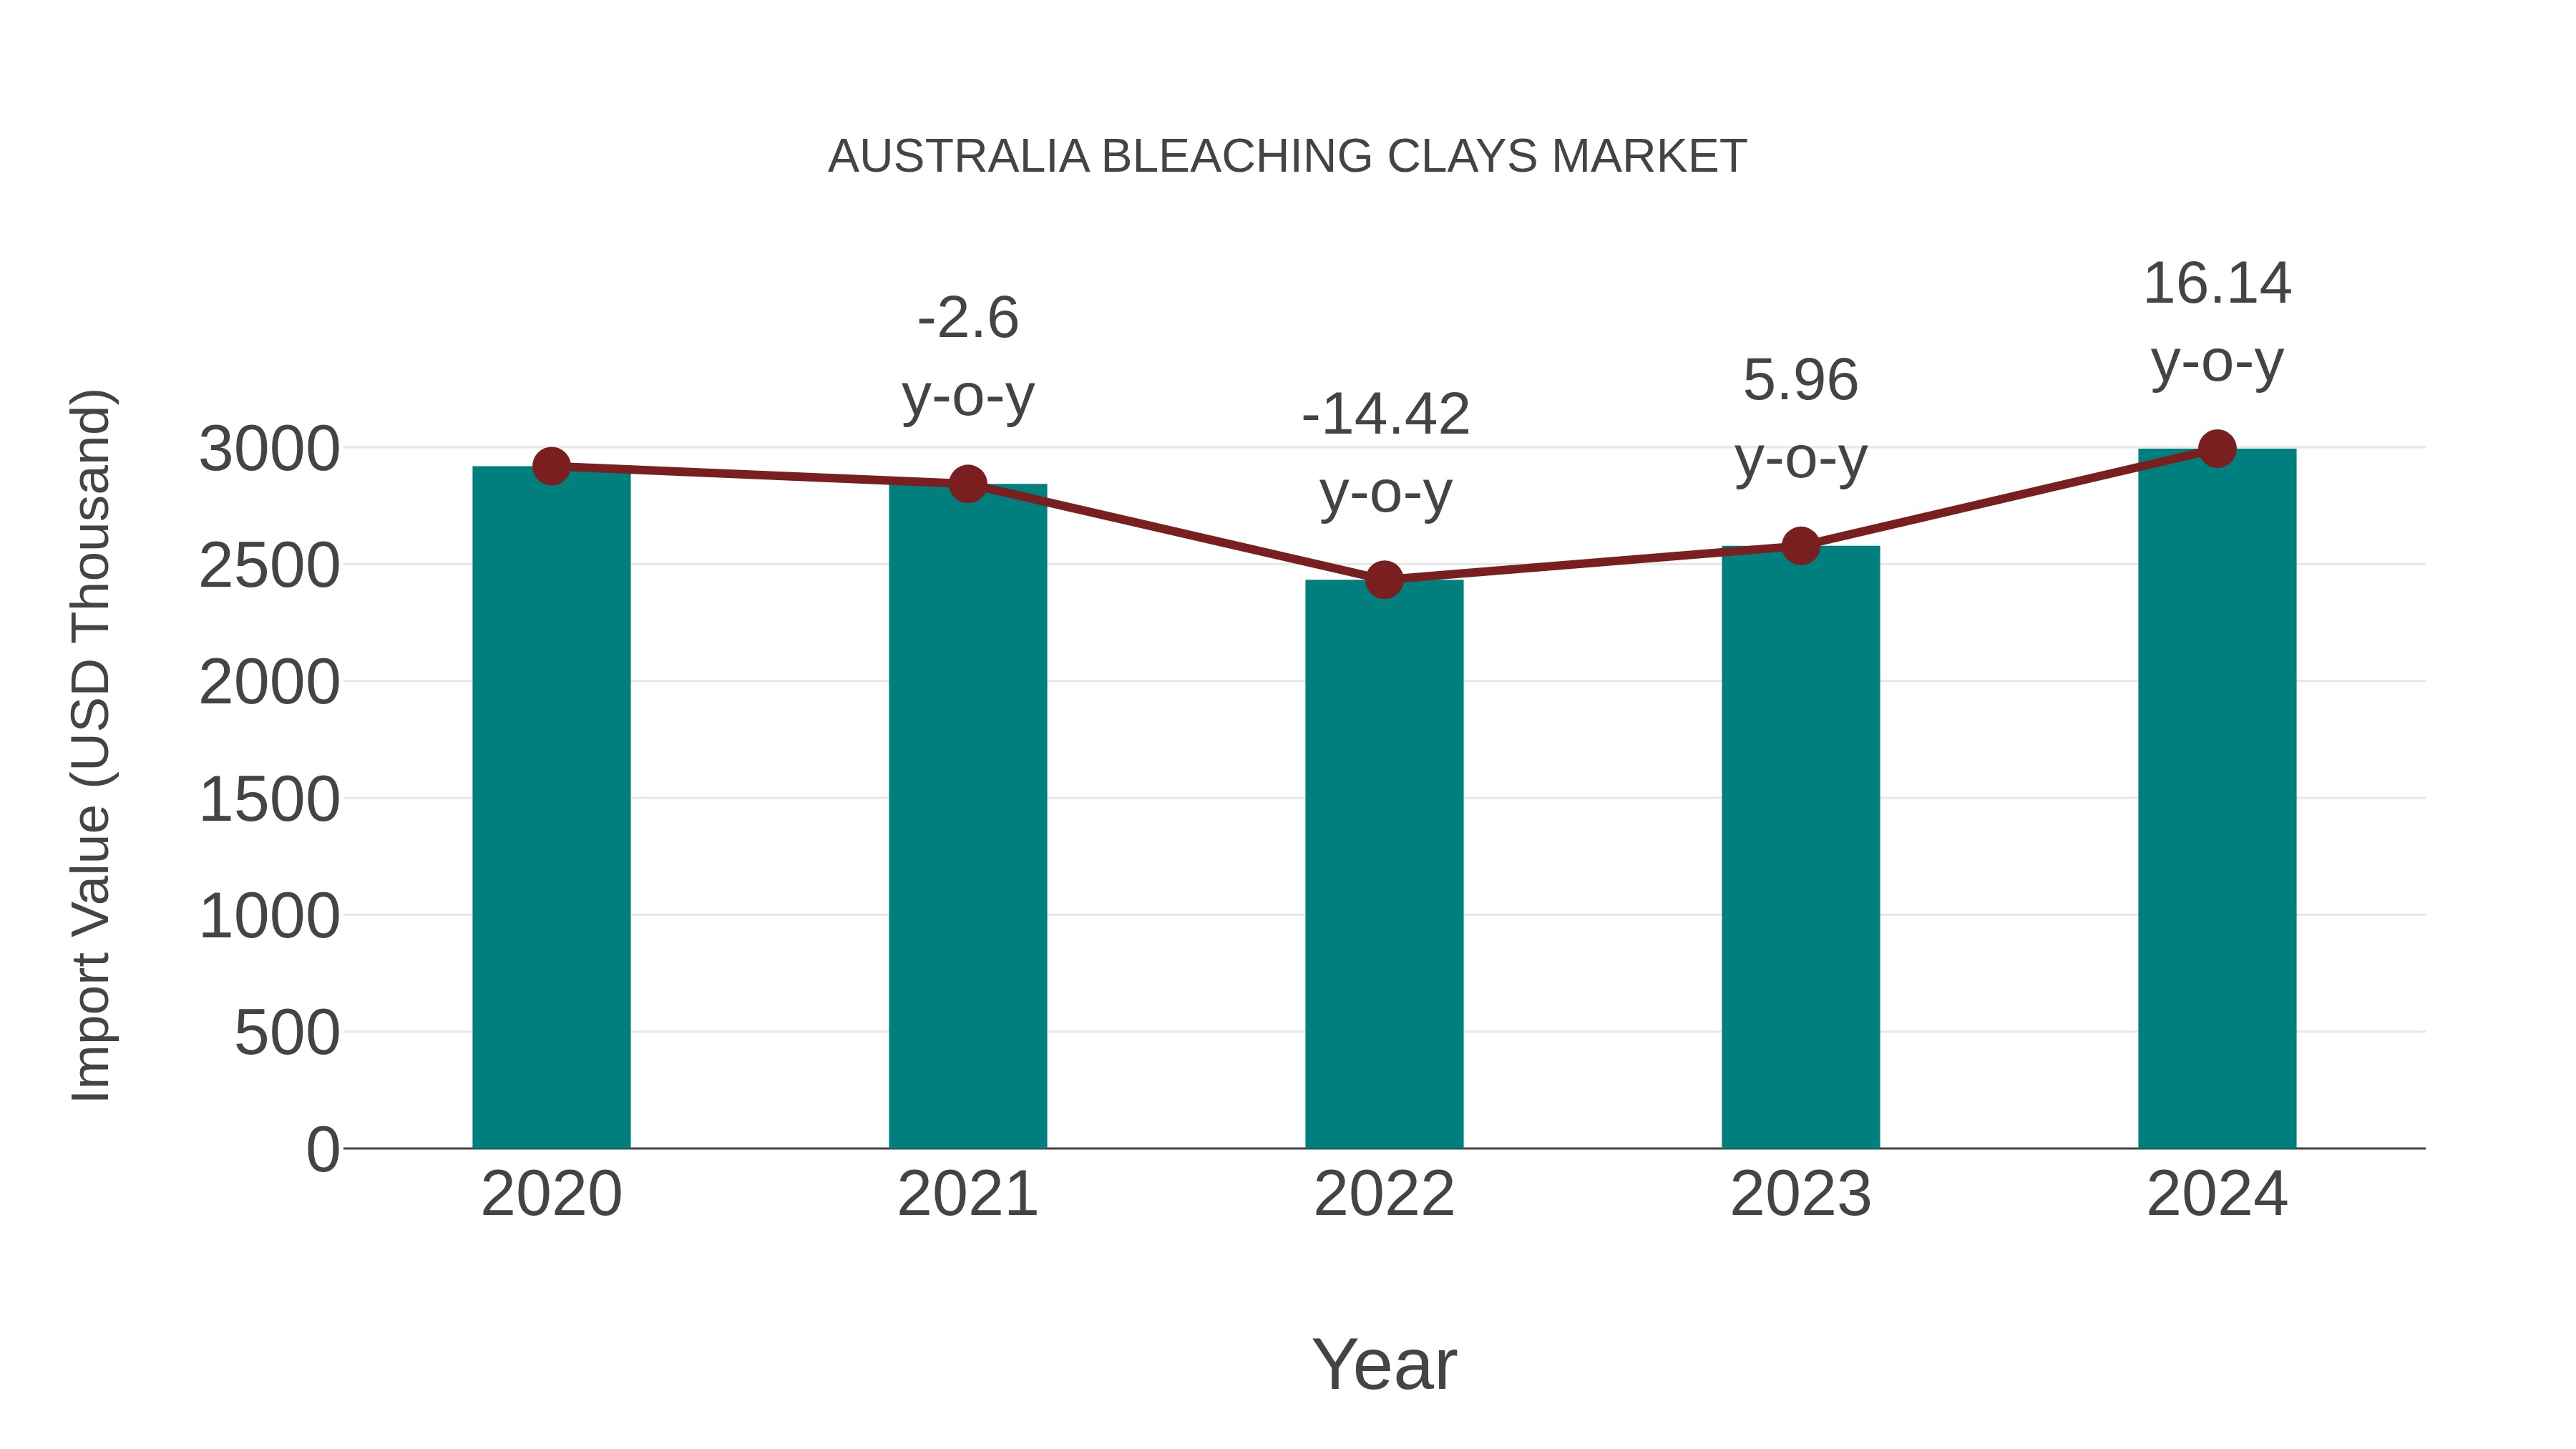
Australia Bleaching Clays Market: Import Trend Analysis
Australia`s import trend for the bleaching clays market showed a growth rate of 16.14% from 2023 to 2024, with a compound annual growth rate (CAGR) of 0.64% from 2020 to 2024. This increase in import momentum can be attributed to shifting demand dynamics in the market, potentially influenced by evolving trade policies or market recovery efforts.
Australia Bleaching Clays Market Overview
The Australia bleaching clays market is experiencing growth driven by their use as adsorbents in the purification of oils and fats. Bleaching clays, known for their high adsorption capacity for impurities and colorants, are utilized in edible oil refining and other industrial processes, contributing to their demand and market expansion.
Drivers of the market
The bleaching clays market in Australia is influenced by factors such as the growing demand for bleaching clays in the refining of edible oils and fats, as well as in the production of petrochemicals and industrial products. Bleaching clays are valued for their adsorption properties, which enable them to remove impurities and color from various substances. The market benefits from the expansion of the food processing, cosmetics, and oil and gas industries in Australia, as well as the increasing emphasis on product quality and purity. Additionally, technological advancements in bleaching clay production and processing techniques contribute to market growth.
Challenges of the market
Challenges in the Australia bleaching clays market include clay quality control and market demand variability. Adapting to changes in oil refining processes and addressing concerns regarding clay impurities are ongoing challenges for bleaching clay producers.
Government Policy of the market
Australia oil and gas, food processing, and cosmetics industries contribute to the demand for bleaching clays. With bleaching clays being used for purification and filtration purposes, the market experiences steady growth. Government regulations ensuring product quality and safety standards influence market dynamics, promoting the adoption of certified bleaching clays.
Key Highlights of the Report:
- Australia Bleaching Clays Market Outlook
- Market Size of Australia Bleaching Clays Market, 2024
- Forecast of Australia Bleaching Clays Market, 2031
- Historical Data and Forecast of Australia Bleaching Clays Revenues & Volume for the Period 2021-2031
- Australia Bleaching Clays Market Trend Evolution
- Australia Bleaching Clays Market Drivers and Challenges
- Australia Bleaching Clays Price Trends
- Australia Bleaching Clays Porter's Five Forces
- Australia Bleaching Clays Industry Life Cycle
- Historical Data and Forecast of Australia Bleaching Clays Market Revenues & Volume By Type for the Period 2021-2031
- Historical Data and Forecast of Australia Bleaching Clays Market Revenues & Volume By Activated Bauxite for the Period 2021-2031
- Historical Data and Forecast of Australia Bleaching Clays Market Revenues & Volume By Activated Clays for the Period 2021-2031
- Historical Data and Forecast of Australia Bleaching Clays Market Revenues & Volume By Fuller's Earth for the Period 2021-2031
- Historical Data and Forecast of Australia Bleaching Clays Market Revenues & Volume By Application for the Period 2021-2031
- Historical Data and Forecast of Australia Bleaching Clays Market Revenues & Volume By Industrial Oil for the Period 2021-2031
- Historical Data and Forecast of Australia Bleaching Clays Market Revenues & Volume By Mineral Oil and Waxes for the Period 2021-2031
- Historical Data and Forecast of Australia Bleaching Clays Market Revenues & Volume By Vegetable Oil and Animal Fats for the Period 2021-2031
- Historical Data and Forecast of Australia Bleaching Clays Market Revenues & Volume By End-user Industry for the Period 2021-2031
- Historical Data and Forecast of Australia Bleaching Clays Market Revenues & Volume By Food and Beverage for the Period 2021-2031
- Historical Data and Forecast of Australia Bleaching Clays Market Revenues & Volume By Cosmetics and Personal Care for the Period 2021-2031
- Historical Data and Forecast of Australia Bleaching Clays Market Revenues & Volume By Chemicals for the Period 2021-2031
- Historical Data and Forecast of Australia Bleaching Clays Market Revenues & Volume By Other End-user Industries for the Period 2021-2031
- Australia Bleaching Clays Import Export Trade Statistics
- Market Opportunity Assessment By Type
- Market Opportunity Assessment By Application
- Market Opportunity Assessment By End-user Industry
- Australia Bleaching Clays Top Companies Market Share
- Australia Bleaching Clays Competitive Benchmarking By Technical and Operational Parameters
- Australia Bleaching Clays Company Profiles
- Australia Bleaching Clays Key Strategic Recommendations
Frequently Asked Questions About the Market Study (FAQs):
6Wresearch actively monitors the Australia Bleaching Clays Market and publishes its comprehensive annual report, highlighting emerging trends, growth drivers, revenue analysis, and forecast outlook. Our insights help businesses to make data-backed strategic decisions with ongoing market dynamics. Our analysts track relevent industries related to the Australia Bleaching Clays Market, allowing our clients with actionable intelligence and reliable forecasts tailored to emerging regional needs.
Yes, we provide customisation as per your requirements. To learn more, feel free to contact us on sales@6wresearch.com
1 Executive Summary |
2 Introduction |
2.1 Key Highlights of the Report |
2.2 Report Description |
2.3 Market Scope & Segmentation |
2.4 Research Methodology |
2.5 Assumptions |
3 Australia Bleaching Clays Market Overview |
3.1 Australia Country Macro Economic Indicators |
3.2 Australia Bleaching Clays Market Revenues & Volume, 2021 & 2031F |
3.3 Australia Bleaching Clays Market - Industry Life Cycle |
3.4 Australia Bleaching Clays Market - Porter's Five Forces |
3.5 Australia Bleaching Clays Market Revenues & Volume Share, By Type, 2021 & 2031F |
3.6 Australia Bleaching Clays Market Revenues & Volume Share, By Application, 2021 & 2031F |
3.7 Australia Bleaching Clays Market Revenues & Volume Share, By End-user Industry, 2021 & 2031F |
4 Australia Bleaching Clays Market Dynamics |
4.1 Impact Analysis |
4.2 Market Drivers |
4.2.1 Growing demand for natural bleaching agents in various industries such as cosmetics, pharmaceuticals, and oil gas. |
4.2.2 Increasing awareness about the benefits of using bleaching clays in environmental remediation and wastewater treatment processes. |
4.2.3 Rising investments in research and development activities to enhance the quality and efficiency of bleaching clays. |
4.3 Market Restraints |
4.3.1 Fluctuating prices of raw materials used in the production of bleaching clays. |
4.3.2 Stringent regulations related to mining and processing of clays in Australia. |
4.3.3 Intense competition from alternative bleaching agents and technologies in the market. |
5 Australia Bleaching Clays Market Trends |
6 Australia Bleaching Clays Market, By Types |
6.1 Australia Bleaching Clays Market, By Type |
6.1.1 Overview and Analysis |
6.1.2 Australia Bleaching Clays Market Revenues & Volume, By Type, 2021-2031F |
6.1.3 Australia Bleaching Clays Market Revenues & Volume, By Activated Bauxite, 2021-2031F |
6.1.4 Australia Bleaching Clays Market Revenues & Volume, By Activated Clays, 2021-2031F |
6.1.5 Australia Bleaching Clays Market Revenues & Volume, By Fuller's Earth, 2021-2031F |
6.2 Australia Bleaching Clays Market, By Application |
6.2.1 Overview and Analysis |
6.2.2 Australia Bleaching Clays Market Revenues & Volume, By Industrial Oil, 2021-2031F |
6.2.3 Australia Bleaching Clays Market Revenues & Volume, By Mineral Oil and Waxes, 2021-2031F |
6.2.4 Australia Bleaching Clays Market Revenues & Volume, By Vegetable Oil and Animal Fats, 2021-2031F |
6.3 Australia Bleaching Clays Market, By End-user Industry |
6.3.1 Overview and Analysis |
6.3.2 Australia Bleaching Clays Market Revenues & Volume, By Food and Beverage, 2021-2031F |
6.3.3 Australia Bleaching Clays Market Revenues & Volume, By Cosmetics and Personal Care, 2021-2031F |
6.3.4 Australia Bleaching Clays Market Revenues & Volume, By Chemicals, 2021-2031F |
6.3.5 Australia Bleaching Clays Market Revenues & Volume, By Other End-user Industries, 2021-2031F |
7 Australia Bleaching Clays Market Import-Export Trade Statistics |
7.1 Australia Bleaching Clays Market Export to Major Countries |
7.2 Australia Bleaching Clays Market Imports from Major Countries |
8 Australia Bleaching Clays Market Key Performance Indicators |
8.1 Average particle size distribution of bleaching clays used in industrial applications. |
8.2 Percentage of impurities removed by bleaching clays in various processes. |
8.3 Number of patents filed for innovations in bleaching clay production techniques. |
8.4 Energy consumption per unit of bleaching clay produced. |
8.5 Environmental impact assessment score for bleaching clay mining and processing operations. |
9 Australia Bleaching Clays Market - Opportunity Assessment |
9.1 Australia Bleaching Clays Market Opportunity Assessment, By Type, 2021 & 2031F |
9.2 Australia Bleaching Clays Market Opportunity Assessment, By Application, 2021 & 2031F |
9.3 Australia Bleaching Clays Market Opportunity Assessment, By End-user Industry, 2021 & 2031F |
10 Australia Bleaching Clays Market - Competitive Landscape |
10.1 Australia Bleaching Clays Market Revenue Share, By Companies, 2024 |
10.2 Australia Bleaching Clays Market Competitive Benchmarking, By Operating and Technical Parameters |
11 Company Profiles |
12 Recommendations |
13 Disclaimer |
Export potential assessment - trade Analytics for 2030
Export potential enables firms to identify high-growth global markets with greater confidence by combining advanced trade intelligence with a structured quantitative methodology. The framework analyzes emerging demand trends and country-level import patterns while integrating macroeconomic and trade datasets such as GDP and population forecasts, bilateral import–export flows, tariff structures, elasticity differentials between developed and developing economies, geographic distance, and import demand projections. Using weighted trade values from 2020–2024 as the base period to project country-to-country export potential for 2030, these inputs are operationalized through calculated drivers such as gravity model parameters, tariff impact factors, and projected GDP per-capita growth. Through an analysis of hidden potentials, demand hotspots, and market conditions that are most favorable to success, this method enables firms to focus on target countries, maximize returns, and global expansion with data, backed by accuracy.
By factoring in the projected importer demand gap that is currently unmet and could be potential opportunity, it identifies the potential for the Exporter (Country) among 190 countries, against the general trade analysis, which identifies the biggest importer or exporter.
To discover high-growth global markets and optimize your business strategy:
Click Here
Pricing
- Single User License$ 1,995
- Department License$ 2,400
- Site License$ 3,120
- Global License$ 3,795

Search
Thought Leadership and Analyst Meet


Our Clients
Related Reports
- India Switchgear Market Outlook (2026 - 2032) | Size, Share, Trends, Growth, Revenue, Forecast, Analysis, Value, Outlook
- Pakistan Contraceptive Implants Market (2025-2031) | Demand, Growth, Size, Share, Industry, Pricing Analysis, Competitive, Strategic Insights, Strategy, Consumer Insights, Analysis, Investment Trends, Opportunities, Revenue, Segments, Value, Segmentation, Supply, Forecast, Restraints, Outlook, Competition, Drivers, Trends, Companies, Challenges
- Sri Lanka Packaging Market (2026-2032) | Outlook, Competition, Drivers, Trends, Demand, Pricing Analysis, Competitive, Strategic Insights, Companies, Challenges, Strategy, Consumer Insights, Analysis, Investment Trends, Opportunities, Growth, Size, Share, Industry, Revenue, Segments, Value, Segmentation, Supply, Forecast, Restraints
- India Kids Watches Market (2026-2032) | Strategy, Consumer Insights, Analysis, Investment Trends, Opportunities, Growth, Size, Share, Industry, Revenue, Segments, Value, Segmentation, Supply, Forecast, Restraints, Outlook, Competition, Drivers, Trends, Demand, Pricing Analysis, Competitive, Strategic Insights, Companies, Challenges
- Saudi Arabia Core Assurance Service Market (2025-2031) | Strategy, Consumer Insights, Analysis, Investment Trends, Opportunities, Growth, Size, Share, Industry, Revenue, Segments, Value, Segmentation, Supply, Forecast, Restraints, Outlook, Competition, Drivers, Trends, Demand, Pricing Analysis, Competitive, Strategic Insights, Companies, Challenges
- Romania Uninterruptible Power Supply (UPS) Market (2026-2032) | Industry, Analysis, Revenue, Size, Forecast, Outlook, Value, Trends, Share, Growth & Companies
- Saudi Arabia Car Window Tinting Film, Paint Protection Film (PPF), and Ceramic Coating Market (2025-2031) | Strategy, Consumer Insights, Analysis, Investment Trends, Opportunities, Growth, Size, Share, Industry, Revenue, Segments, Value, Segmentation, Supply, Forecast, Restraints, Outlook, Competition, Drivers, Trends, Demand, Pricing Analysis, Competitive, Strategic Insights, Companies, Challenges
- South Africa Stationery Market (2025-2031) | Share, Size, Industry, Value, Growth, Revenue, Analysis, Trends, Segmentation & Outlook
- Afghanistan Rocking Chairs And Adirondack Chairs Market (2026-2032) | Size & Revenue, Competitive Landscape, Share, Segmentation, Industry, Value, Outlook, Analysis, Trends, Growth, Forecast, Companies
- Afghanistan Apparel Market (2026-2032) | Growth, Outlook, Industry, Segmentation, Forecast, Size, Companies, Trends, Value, Share, Analysis & Revenue
Industry Events and Analyst Meet

EV tech India Expo 2026

Auto Tech Asia 2026

Battery Tech India 2026

Smart Production Solutions Guangzhou 2026

Stationery & Paper Expo Saudi Arabia 2026
Whitepaper
- Middle East & Africa Commercial Security Market Click here to view more.
- Middle East & Africa Fire Safety Systems & Equipment Market Click here to view more.
- GCC Drone Market Click here to view more.
- Middle East Lighting Fixture Market Click here to view more.
- GCC Physical & Perimeter Security Market Click here to view more.
6WResearch In News
- Doha a strategic location for EV manufacturing hub: IPA Qatar
- Demand for luxury TVs surging in the GCC, says Samsung
- Empowering Growth: The Thriving Journey of Bangladesh’s Cable Industry
- Demand for luxury TVs surging in the GCC, says Samsung
- Video call with a traditional healer? Once unthinkable, it’s now common in South Africa
- Intelligent Buildings To Smooth GCC’s Path To Net Zero