Australia Boat Market (2026-2032) | Value, Analysis, Companies, Size, Outlook, Share, Revenue, Trends, Industry, Growth & Forecast
Market Forecast By Type (Outboard, Inboard, PWC, Others), By Application (Fishing, Watersports, Sailing, Others), By Power (Engine-Powered Boats, Sail-Propelled Boats) And Competitive Landscape
| Product Code: ETC049335 | Publication Date: Jan 2021 | Updated Date: Mar 2026 | Product Type: Report | |
| Publisher: 6Wresearch | Author: Ravi Bhandari | No. of Pages: 70 | No. of Figures: 35 | No. of Tables: 5 |
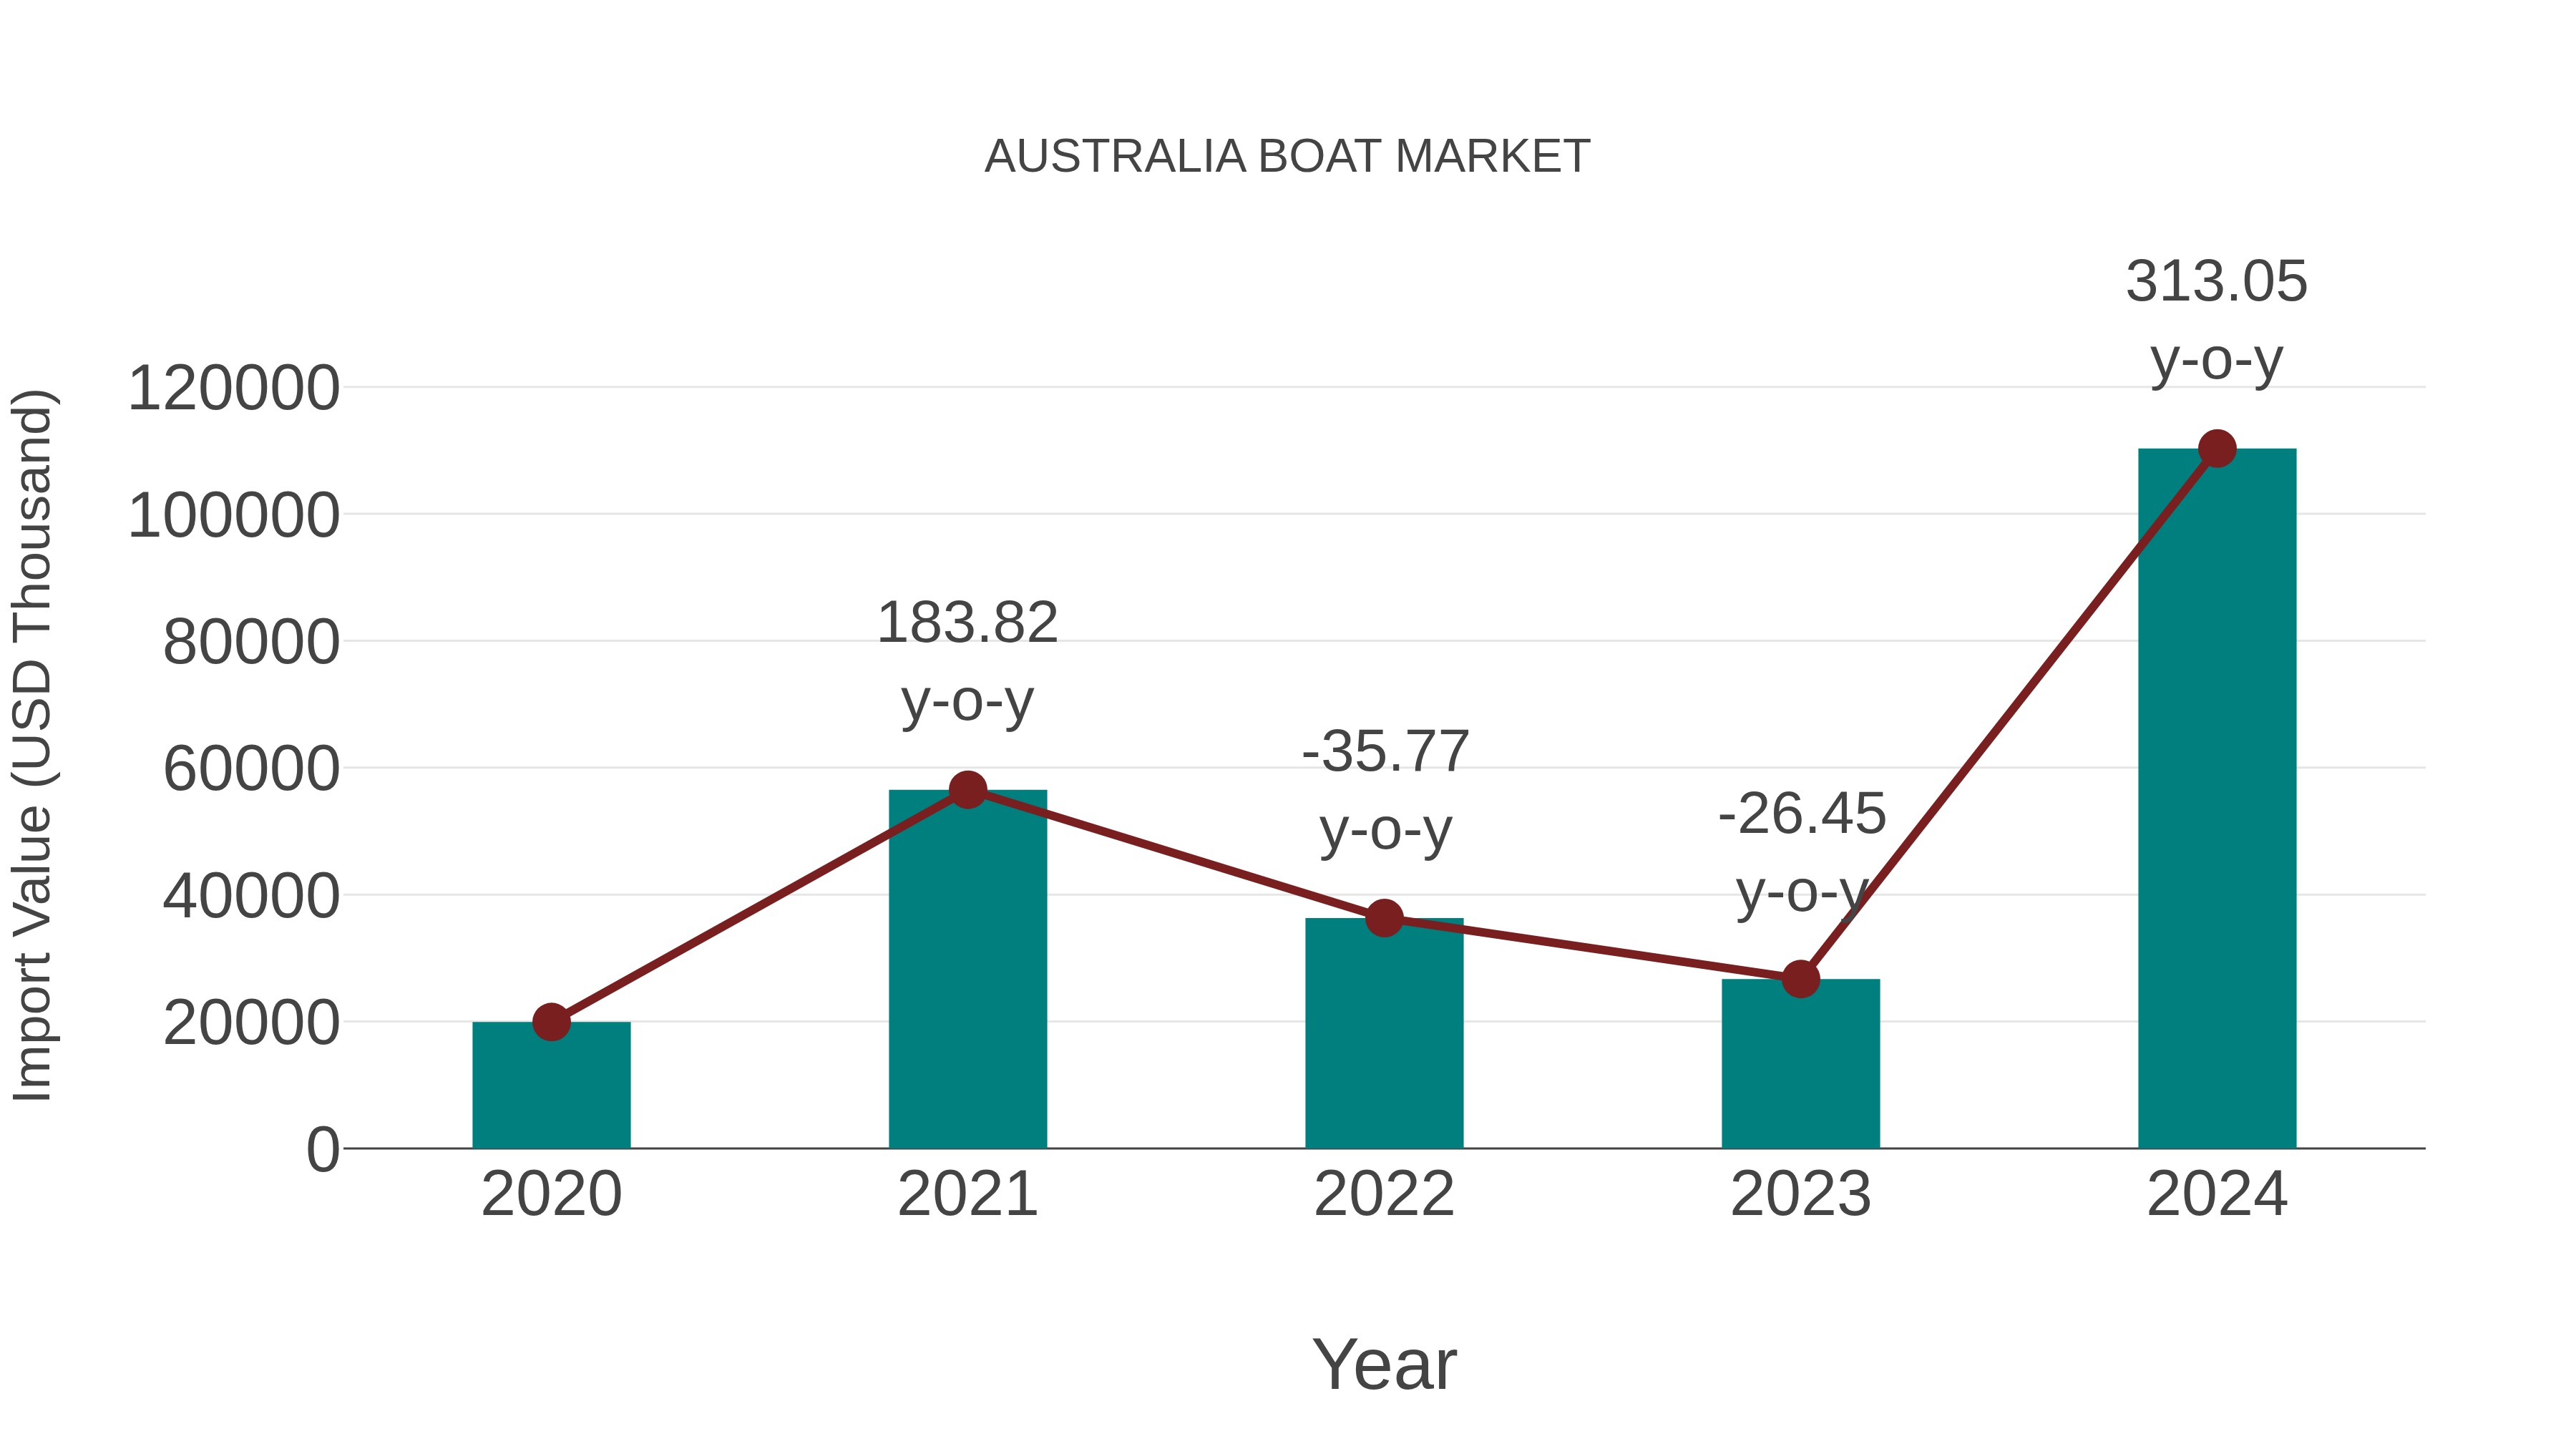
Australia Boat Market: Import Trend Analysis
Australia`s import trend for the boat market showed a significant growth rate of 313.05% from 2023 to 2024, with a Compound Annual Growth Rate (CAGR) of 53.4% from 2020 to 2024. This surge in imports may be attributed to a shift in consumer demand towards recreational activities or a recovery in the maritime market following global economic stabilization.
Australia Boat Market Overview
In Australia, the boat market is experiencing growth with the demand for recreational boating and marine tourism activities. Boats, including yachts, motorboats, and personal watercraft, offer opportunities for leisure, fishing, and water sports adventures, driving their sales and market expansion in coastal regions and inland waterways.
Drivers of the market
The Australia boat market is influenced by several factors that contribute to its growth and dynamics. Firstly, the country`s extensive coastline and abundant waterways provide ample opportunities for recreational boating activities such as fishing, sailing, and watersports, driving demand for a wide range of boats and marine vessels. Additionally, factors such as rising disposable incomes, lifestyle preferences, and the tourism industry`s focus on marine-based experiences further stimulate boat sales. Moreover, technological advancements in boat design, propulsion systems, and materials contribute to product innovation and market differentiation, attracting consumers seeking performance, efficiency, and safety in their watercraft. Government initiatives supporting marine tourism, infrastructure development, and boating safety also play a significant role in shaping the Australia boat market landscape.
Challenges of the market
The Australia boat market faces challenges such as fluctuating demand and environmental regulations. Adapting to changes in recreational boating trends and addressing concerns regarding boat manufacturing sustainability are ongoing challenges for boat manufacturers.
Government Policy of the market
In Australia, the boat market is shaped by factors such as maritime regulations, economic conditions, and consumer preferences. Government agencies enforce safety standards, licensing requirements, and environmental regulations to ensure responsible boating practices. Furthermore, government support for tourism, marine infrastructure, and recreational activities may influence market dynamics.
Key Highlights of the Report:
- Australia Boat Market Outlook
- Market Size of Australia Boat Market, 2025
- Forecast of Australia Boat Market, 2032
- Historical Data and Forecast of Australia Boat Revenues & Volume for the Period 2022-2032F
- Australia Boat Market Trend Evolution
- Australia Boat Market Drivers and Challenges
- Australia Boat Price Trends
- Australia Boat Porter's Five Forces
- Australia Boat Industry Life Cycle
- Historical Data and Forecast of Australia Boat Market Revenues & Volume By Type for the Period 2022-2032F
- Historical Data and Forecast of Australia Boat Market Revenues & Volume By Outboard for the Period 2022-2032F
- Historical Data and Forecast of Australia Boat Market Revenues & Volume By Inboard for the Period 2022-2032F
- Historical Data and Forecast of Australia Boat Market Revenues & Volume By PWC for the Period 2022-2032F
- Historical Data and Forecast of Australia Boat Market Revenues & Volume By Others for the Period 2022-2032F
- Historical Data and Forecast of Australia Boat Market Revenues & Volume By Application for the Period 2022-2032F
- Historical Data and Forecast of Australia Boat Market Revenues & Volume By Fishing for the Period 2022-2032F
- Historical Data and Forecast of Australia Boat Market Revenues & Volume By Watersports for the Period 2022-2032F
- Historical Data and Forecast of Australia Boat Market Revenues & Volume By Sailing for the Period 2022-2032F
- Historical Data and Forecast of Australia Boat Market Revenues & Volume By Others for the Period 2022-2032F
- Historical Data and Forecast of Australia Boat Market Revenues & Volume By Power for the Period 2022-2032F
- Historical Data and Forecast of Australia Boat Market Revenues & Volume By Engine-Powered Boats for the Period 2022-2032F
- Historical Data and Forecast of Australia Boat Market Revenues & Volume By Sail-Propelled Boats for the Period 2022-2032F
- Australia Boat Import Export Trade Statistics
- Market Opportunity Assessment By Type
- Market Opportunity Assessment By Application
- Market Opportunity Assessment By Power
- Australia Boat Top Companies Market Share
- Australia Boat Competitive Benchmarking By Technical and Operational Parameters
- Australia Boat Company Profiles
- Australia Boat Key Strategic Recommendations
Australia Boat Market (2026-2032): FAQs
6Wresearch actively monitors the Australia Boat Market and publishes its comprehensive annual report, highlighting emerging trends, growth drivers, revenue analysis, and forecast outlook. Our insights help businesses to make data-backed strategic decisions with ongoing market dynamics. Our analysts track relevent industries related to the Australia Boat Market, allowing our clients with actionable intelligence and reliable forecasts tailored to emerging regional needs.
Yes, we provide customisation as per your requirements. To learn more, feel free to contact us on sales@6wresearch.com
1 Executive Summary |
2 Introduction |
2.1 Key Highlights of the Report |
2.2 Report Description |
2.3 Market Scope & Segmentation |
2.4 Research Methodology |
2.5 Assumptions |
3 Australia Boat Market Overview |
3.1 Australia Country Macro Economic Indicators |
3.2 Australia Boat Market Revenues & Volume, 2022 & 2032F |
3.3 Australia Boat Market - Industry Life Cycle |
3.4 Australia Boat Market - Porter's Five Forces |
3.5 Australia Boat Market Revenues & Volume Share, By Type, 2022 & 2032F |
3.6 Australia Boat Market Revenues & Volume Share, By Application, 2022 & 2032F |
3.7 Australia Boat Market Revenues & Volume Share, By Power, 2022 & 2032F |
4 Australia Boat Market Dynamics |
4.1 Impact Analysis |
4.2 Market Drivers |
4.2.1 Increasing disposable income of consumers in Australia |
4.2.2 Growing interest in outdoor recreational activities and water sports |
4.2.3 Technological advancements in boat manufacturing industry |
4.3 Market Restraints |
4.3.1 High maintenance and operating costs associated with owning a boat |
4.3.2 Stringent government regulations and licensing requirements |
4.3.3 Seasonal nature of boating activities in Australia |
5 Australia Boat Market Trends |
6 Australia Boat Market, By Types |
6.1 Australia Boat Market, By Type |
6.1.1 Overview and Analysis |
6.1.2 Australia Boat Market Revenues & Volume, By Type, 2022-2032F |
6.1.3 Australia Boat Market Revenues & Volume, By Outboard, 2022-2032F |
6.1.4 Australia Boat Market Revenues & Volume, By Inboard, 2022-2032F |
6.1.5 Australia Boat Market Revenues & Volume, By PWC, 2022-2032F |
6.1.6 Australia Boat Market Revenues & Volume, By Others, 2022-2032F |
6.2 Australia Boat Market, By Application |
6.2.1 Overview and Analysis |
6.2.2 Australia Boat Market Revenues & Volume, By Fishing, 2022-2032F |
6.2.3 Australia Boat Market Revenues & Volume, By Watersports, 2022-2032F |
6.2.4 Australia Boat Market Revenues & Volume, By Sailing, 2022-2032F |
6.2.5 Australia Boat Market Revenues & Volume, By Others, 2022-2032F |
6.3 Australia Boat Market, By Power |
6.3.1 Overview and Analysis |
6.3.2 Australia Boat Market Revenues & Volume, By Engine-Powered Boats, 2022-2032F |
6.3.3 Australia Boat Market Revenues & Volume, By Sail-Propelled Boats, 2022-2032F |
7 Australia Boat Market Import-Export Trade Statistics |
7.1 Australia Boat Market Export to Major Countries |
7.2 Australia Boat Market Imports from Major Countries |
8 Australia Boat Market Key Performance Indicators |
8.1 Number of boat registrations per year |
8.2 Average age of boats in operation |
8.3 Frequency of boat shows and exhibitions in Australia |
8.4 Utilization rate of marinas and boat storage facilities |
9 Australia Boat Market - Opportunity Assessment |
9.1 Australia Boat Market Opportunity Assessment, By Type, 2022 & 2032F |
9.2 Australia Boat Market Opportunity Assessment, By Application, 2022 & 2032F |
9.3 Australia Boat Market Opportunity Assessment, By Power, 2022 & 2032F |
10 Australia Boat Market - Competitive Landscape |
10.1 Australia Boat Market Revenue Share, By Companies, 2025 |
10.2 Australia Boat Market Competitive Benchmarking, By Operating and Technical Parameters |
11 Company Profiles |
12 Recommendations |
13 Disclaimer |
Export potential assessment - trade Analytics for 2030
Export potential enables firms to identify high-growth global markets with greater confidence by combining advanced trade intelligence with a structured quantitative methodology. The framework analyzes emerging demand trends and country-level import patterns while integrating macroeconomic and trade datasets such as GDP and population forecasts, bilateral import–export flows, tariff structures, elasticity differentials between developed and developing economies, geographic distance, and import demand projections. Using weighted trade values from 2020–2024 as the base period to project country-to-country export potential for 2030, these inputs are operationalized through calculated drivers such as gravity model parameters, tariff impact factors, and projected GDP per-capita growth. Through an analysis of hidden potentials, demand hotspots, and market conditions that are most favorable to success, this method enables firms to focus on target countries, maximize returns, and global expansion with data, backed by accuracy.
By factoring in the projected importer demand gap that is currently unmet and could be potential opportunity, it identifies the potential for the Exporter (Country) among 190 countries, against the general trade analysis, which identifies the biggest importer or exporter.
To discover high-growth global markets and optimize your business strategy:
Click Here
Pricing
- Single User License$ 1,995
- Department License$ 2,400
- Site License$ 3,120
- Global License$ 3,795

Search
Thought Leadership and Analyst Meet


Our Clients
Latest Reports
- United Kingdom (UK) Long-term Care Insurance Market (2026-2032) | Growth, Share, Consumer Insights, Drivers, Opportunities, Competition, Pricing Analysis, Segments, Restraints, Companies, Competitive, Value, Outlook, Size, Demand, Analysis, Challenges, Strategic Insights, Investment Trends, Revenue, Trends, Supply, Forecast
- United Kingdom (UK) Long Term Care Market (2026-2032) | Companies, Outlook, Analysis, Trends, Value, Revenue, Segmentation, Share, Forecast, Competitive Landscape, Growth, Size & Forecast
- Iraq Insulation and Waterproofing Market (2026-2032) | Outlook, Drivers, Growth, Size, Share, Industry, Revenue, Trends, Demand, Competitive, Strategic Insights, Opportunities, Segments, Companies, Challenges, Strategy, Consumer Insights, Analysis, Investment Trends, Value, Segmentation, Forecast, Restraints
- India Switchgear Market Outlook (2026 - 2032) | Size, Share, Trends, Growth, Revenue, Forecast, Analysis, Value, Outlook
- Pakistan Contraceptive Implants Market (2025-2031) | Demand, Growth, Size, Share, Industry, Pricing Analysis, Competitive, Strategic Insights, Strategy, Consumer Insights, Analysis, Investment Trends, Opportunities, Revenue, Segments, Value, Segmentation, Supply, Forecast, Restraints, Outlook, Competition, Drivers, Trends, Companies, Challenges
- Sri Lanka Packaging Market (2026-2032) | Outlook, Competition, Drivers, Trends, Demand, Pricing Analysis, Competitive, Strategic Insights, Companies, Challenges, Strategy, Consumer Insights, Analysis, Investment Trends, Opportunities, Growth, Size, Share, Industry, Revenue, Segments, Value, Segmentation, Supply, Forecast, Restraints
- India Kids Watches Market (2026-2032) | Strategy, Consumer Insights, Analysis, Investment Trends, Opportunities, Growth, Size, Share, Industry, Revenue, Segments, Value, Segmentation, Supply, Forecast, Restraints, Outlook, Competition, Drivers, Trends, Demand, Pricing Analysis, Competitive, Strategic Insights, Companies, Challenges
- Saudi Arabia Core Assurance Service Market (2025-2031) | Strategy, Consumer Insights, Analysis, Investment Trends, Opportunities, Growth, Size, Share, Industry, Revenue, Segments, Value, Segmentation, Supply, Forecast, Restraints, Outlook, Competition, Drivers, Trends, Demand, Pricing Analysis, Competitive, Strategic Insights, Companies, Challenges
- Romania Uninterruptible Power Supply (UPS) Market (2026-2032) | Industry, Analysis, Revenue, Size, Forecast, Outlook, Value, Trends, Share, Growth & Companies
- Saudi Arabia Car Window Tinting Film, Paint Protection Film (PPF), and Ceramic Coating Market (2025-2031) | Strategy, Consumer Insights, Analysis, Investment Trends, Opportunities, Growth, Size, Share, Industry, Revenue, Segments, Value, Segmentation, Supply, Forecast, Restraints, Outlook, Competition, Drivers, Trends, Demand, Pricing Analysis, Competitive, Strategic Insights, Companies, Challenges
Industry Events and Analyst Meet

India EV Show 2026

EV tech India Expo 2026

Auto Tech Asia 2026

Battery Tech India 2026

Smart Production Solutions Guangzhou 2026
Whitepaper
- Middle East & Africa Commercial Security Market Click here to view more.
- Middle East & Africa Fire Safety Systems & Equipment Market Click here to view more.
- GCC Drone Market Click here to view more.
- Middle East Lighting Fixture Market Click here to view more.
- GCC Physical & Perimeter Security Market Click here to view more.
6WResearch In News
- Doha a strategic location for EV manufacturing hub: IPA Qatar
- Demand for luxury TVs surging in the GCC, says Samsung
- Empowering Growth: The Thriving Journey of Bangladesh’s Cable Industry
- Demand for luxury TVs surging in the GCC, says Samsung
- Video call with a traditional healer? Once unthinkable, it’s now common in South Africa
- Intelligent Buildings To Smooth GCC’s Path To Net Zero