Australia Chlorine Market Outlook | Size, Trends, Industry, Revenue, Growth, Analysis, COVID-19 IMPACT, Share, Value, Forecast & Companies
Market Forecast By Application (EDC/PVC, Isocyanates and Oxygenates, Chloromethanes, Solvents and Epichlorohydrin, Inorganic Chemicals, Other Applications), By End-user Industry (Water Treatment, Pharmaceutical, Chemicals, Paper and Pulp, Plastic, Pesticides, Other End-user Industries) And Competitive Landscape
| Product Code: ETC191267 | Publication Date: May 2022 | Updated Date: Jan 2026 | Product Type: Market Research Report | |
| Publisher: 6Wresearch | Author: Ravi Bhandari | No. of Pages: 60 | No. of Figures: 40 | No. of Tables: 7 |
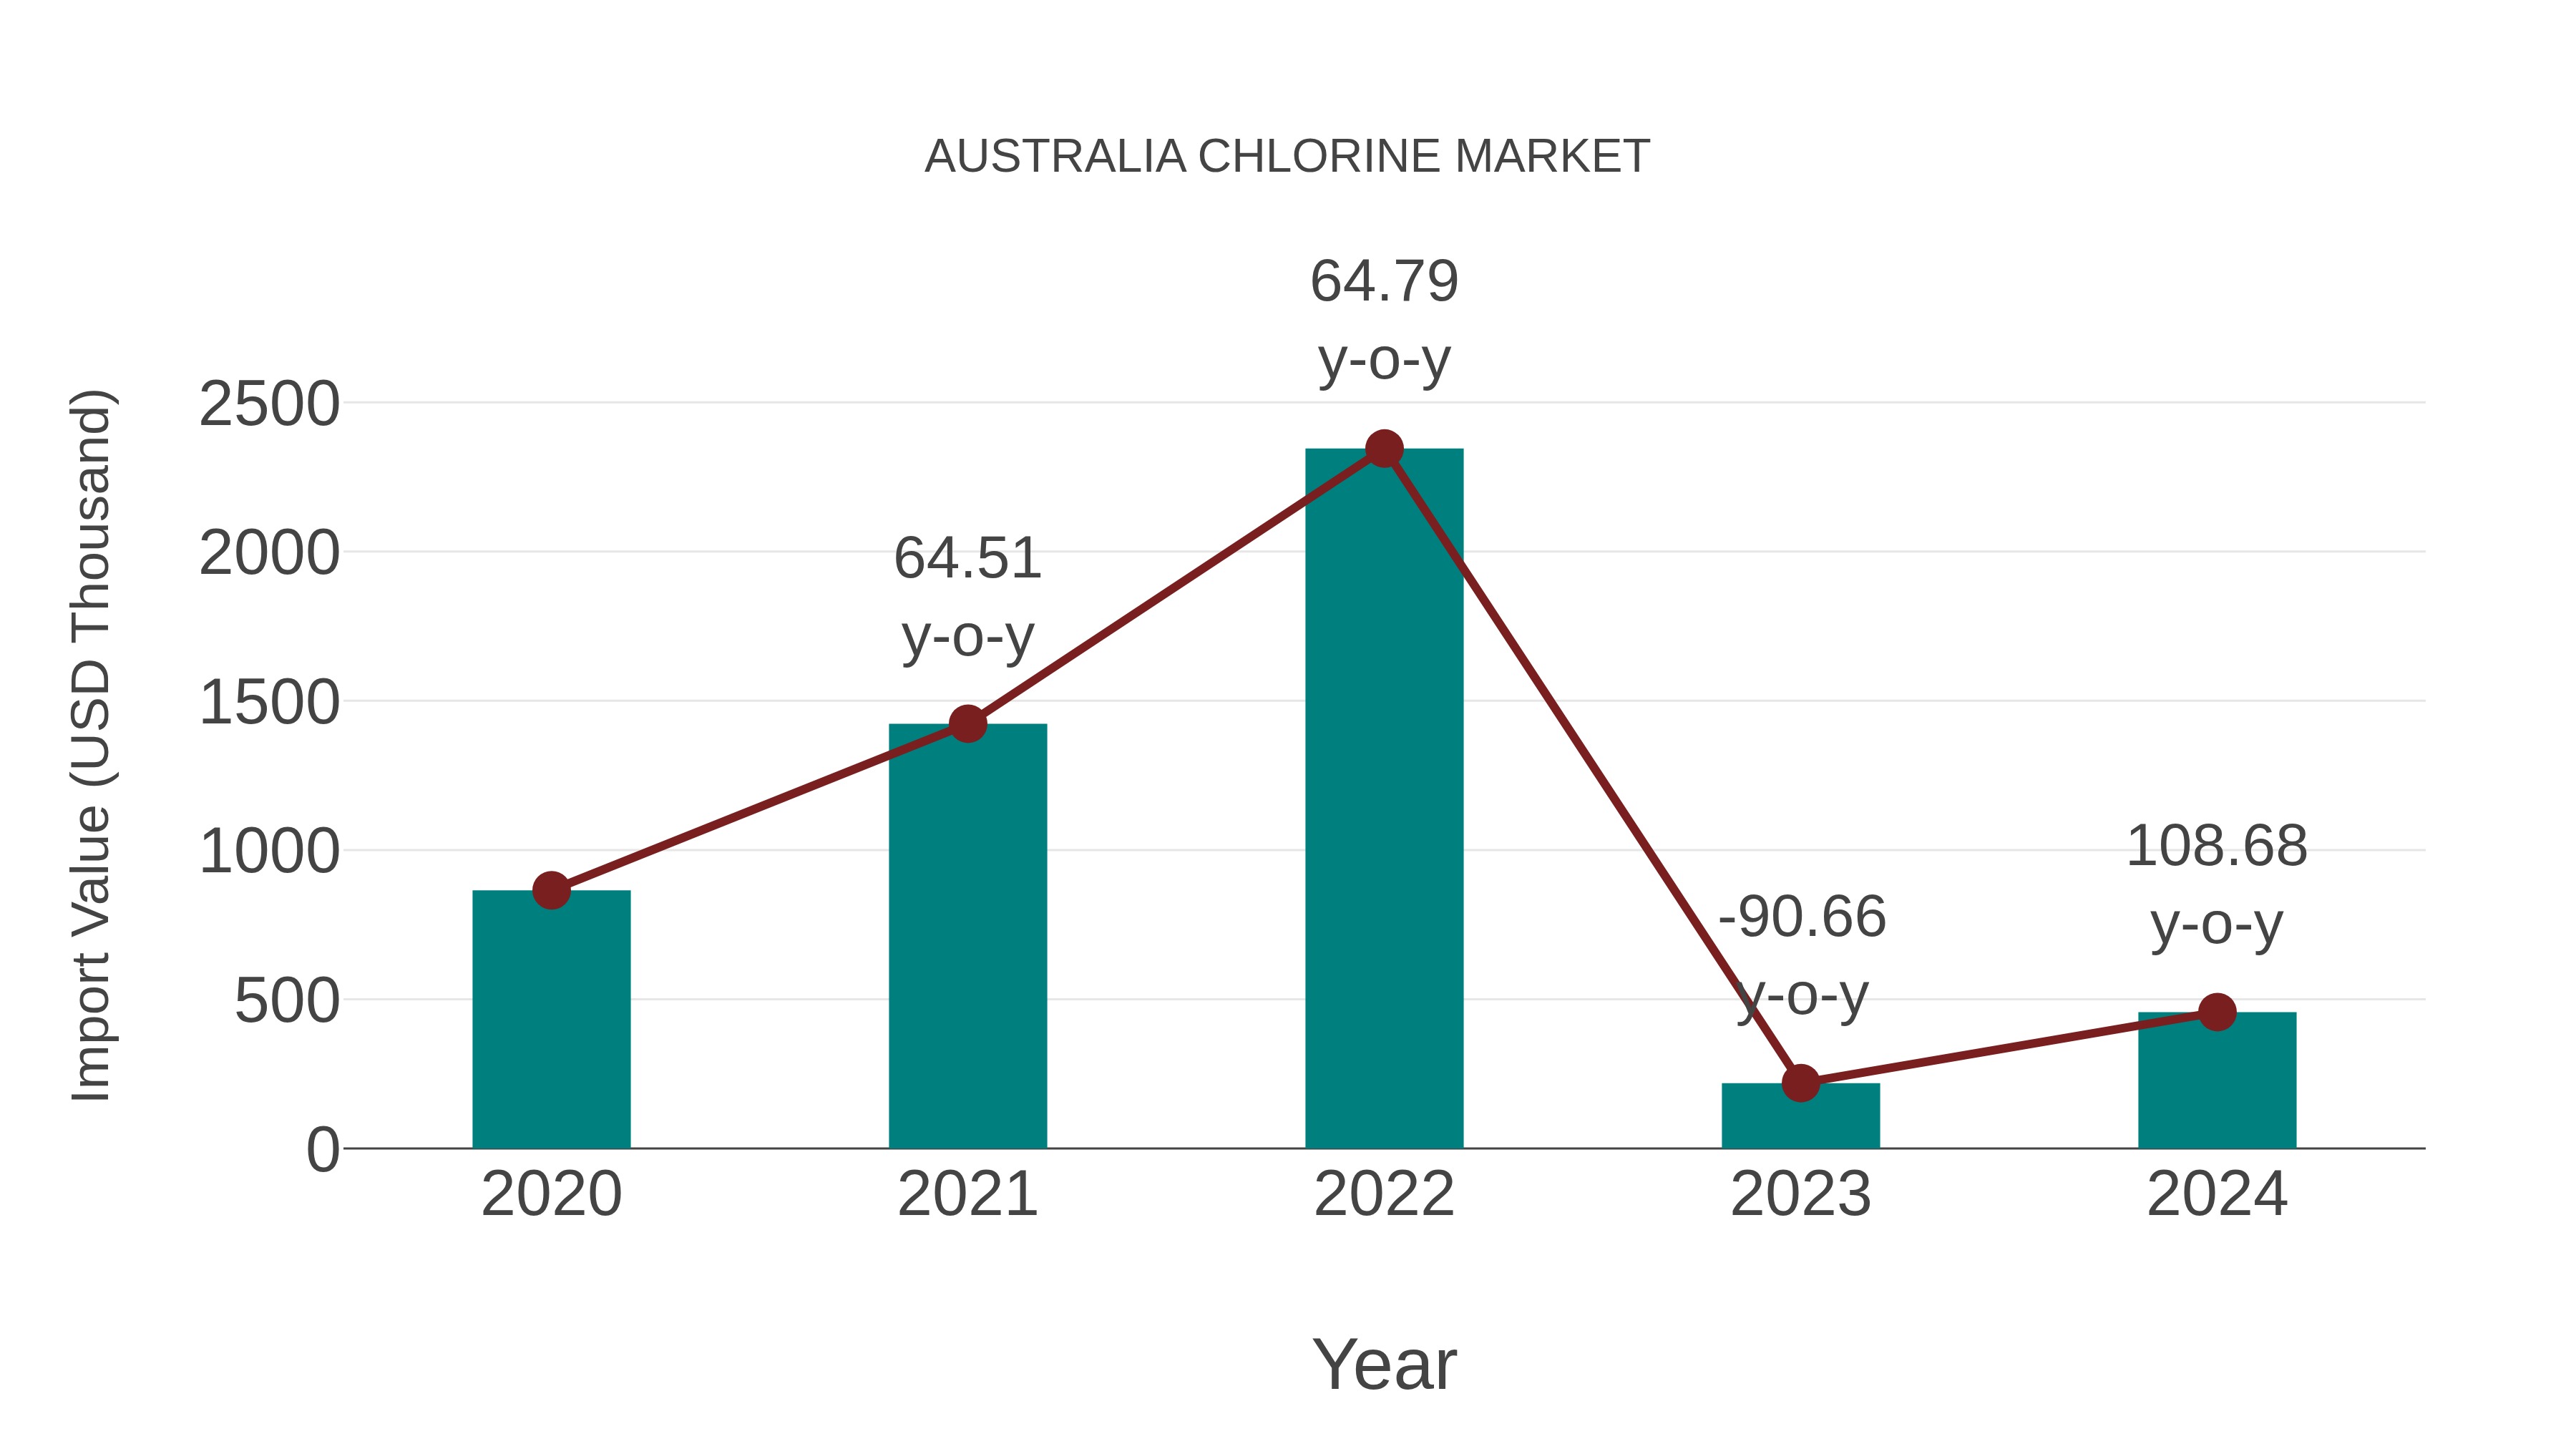
Australia Chlorine Market: Import Trend Analysis
In the Australia chlorine market, the import trend exhibited significant growth from 2023 to 2024, with a notable 108.68% increase. However, the compound annual growth rate (CAGR) from 2020 to 2024 was -14.74%. This decline may be attributed to shifts in demand dynamics or changes in trade policies impacting market stability.
Australia Chlorine Market Overview
Australia chlorine market serves chemical manufacturing, water treatment, and sanitation industries with chlorine gas and chlorine-based chemicals such as sodium hypochlorite and calcium hypochlorite. Chlorine products are essential for disinfection, bleaching, and chemical synthesis processes, ensuring public health, environmental protection, and industrial hygiene. With a focus on safety, regulatory compliance, and sustainability, chlorine producers and distributors play critical roles in supporting various sectors of the Australia economy.
Drivers of the market
The Australia chlorine market is influenced by factors affecting the chemical industry and various downstream sectors. Chlorine, a versatile chemical, is used in the production of a wide range of products, including PVC, solvents, and bleach. Market dynamics are driven by factors such as demand from end-user industries, regulatory standards governing chemical usage, and technological advancements in chlorine production processes. Additionally, trends in sustainable chemistry and environmental regulations impact market trends.
Challenges of the market
Challenges in the Australia chlorine market include managing chlorine production capacity and supply chain logistics, addressing environmental and safety regulations governing chlorine handling and transportation, and adapting to changing market dynamics and competitive pressures.
Government Policy of the market
Government policies in Australia regulate the production, importation, and use of chlorine gas, which is primarily used in water treatment, sanitation, and chemical manufacturing. Regulatory requirements address safety, environmental protection, and emergency response measures to mitigate risks associated with chlorine handling and storage. Additionally, regulations may govern chlorine emissions and wastewater discharges from industrial facilities to prevent pollution and protect public health. Compliance with these regulations is essential for chlorine manufacturers and users to operate safely and responsibly in the Australia market.
Key Highlights of the Report:
- Australia Chlorine Market Outlook
- Market Size of Australia Chlorine Market, 2024
- Forecast of Australia Chlorine Market, 2031
- Historical Data and Forecast of Australia Chlorine Revenues & Volume for the Period 2018 - 2031
- Australia Chlorine Market Trend Evolution
- Australia Chlorine Market Drivers and Challenges
- Australia Chlorine Price Trends
- Australia Chlorine Porter's Five Forces
- Australia Chlorine Industry Life Cycle
- Historical Data and Forecast of Australia Chlorine Market Revenues & Volume By Application for the Period 2018 - 2031
- Historical Data and Forecast of Australia Chlorine Market Revenues & Volume By EDC/PVC for the Period 2018 - 2031
- Historical Data and Forecast of Australia Chlorine Market Revenues & Volume By Isocyanates and Oxygenates for the Period 2018 - 2031
- Historical Data and Forecast of Australia Chlorine Market Revenues & Volume By Chloromethanes for the Period 2018 - 2031
- Historical Data and Forecast of Australia Chlorine Market Revenues & Volume By Solvents and Epichlorohydrin for the Period 2018 - 2031
- Historical Data and Forecast of Australia Chlorine Market Revenues & Volume By Inorganic Chemicals for the Period 2018 - 2031
- Historical Data and Forecast of Australia Chlorine Market Revenues & Volume By Other Applications for the Period 2018 - 2031
- Historical Data and Forecast of Australia Chlorine Market Revenues & Volume By End-user Industry for the Period 2018 - 2031
- Historical Data and Forecast of Australia Chlorine Market Revenues & Volume By Water Treatment for the Period 2018 - 2031
- Historical Data and Forecast of Australia Chlorine Market Revenues & Volume By Pharmaceutical for the Period 2018 - 2031
- Historical Data and Forecast of Australia Chlorine Market Revenues & Volume By Chemicals for the Period 2018 - 2031
- Historical Data and Forecast of Australia Chlorine Market Revenues & Volume By Paper and Pulp for the Period 2018 - 2031
- Historical Data and Forecast of Australia Chlorine Market Revenues & Volume By Plastic for the Period 2018 - 2031
- Historical Data and Forecast of Australia Chlorine Market Revenues & Volume By Pesticides for the Period 2018 - 2031
- Historical Data and Forecast of Australia Chlorine Market Revenues & Volume By Other End-user Industries for the Period 2018 - 2031
- Australia Chlorine Import Export Trade Statistics
- Market Opportunity Assessment By Application
- Market Opportunity Assessment By End-user Industry
- Australia Chlorine Top Companies Market Share
- Australia Chlorine Competitive Benchmarking By Technical and Operational Parameters
- Australia Chlorine Company Profiles
- Australia Chlorine Key Strategic Recommendations
Frequently Asked Questions About the Market Study (FAQs):
6Wresearch actively monitors the Australia Chlorine Market and publishes its comprehensive annual report, highlighting emerging trends, growth drivers, revenue analysis, and forecast outlook. Our insights help businesses to make data-backed strategic decisions with ongoing market dynamics. Our analysts track relevent industries related to the Australia Chlorine Market, allowing our clients with actionable intelligence and reliable forecasts tailored to emerging regional needs.
Yes, we provide customisation as per your requirements. To learn more, feel free to contact us on sales@6wresearch.com
1 Executive Summary |
2 Introduction |
2.1 Key Highlights of the Report |
2.2 Report Description |
2.3 Market Scope & Segmentation |
2.4 Research Methodology |
2.5 Assumptions |
3 Australia Chlorine Market Overview |
3.1 Australia Country Macro Economic Indicators |
3.2 Australia Chlorine Market Revenues & Volume, 2021 & 2031F |
3.3 Australia Chlorine Market - Industry Life Cycle |
3.4 Australia Chlorine Market - Porter's Five Forces |
3.5 Australia Chlorine Market Revenues & Volume Share, By Application, 2021 & 2031F |
3.6 Australia Chlorine Market Revenues & Volume Share, By End-user Industry, 2021 & 2031F |
4 Australia Chlorine Market Dynamics |
4.1 Impact Analysis |
4.2 Market Drivers |
4.2.1 Increasing demand for water treatment applications in industries such as mining, agriculture, and municipal water systems. |
4.2.2 Growing awareness about the importance of maintaining clean and hygienic swimming pools. |
4.2.3 Stringent regulations and standards by the government regarding water quality and safety. |
4.3 Market Restraints |
4.3.1 Fluctuating prices of raw materials used in chlorine production. |
4.3.2 Environmental concerns and regulations related to the use and disposal of chlorine products. |
4.3.3 Competition from alternative water treatment technologies such as UV treatment and ozone systems. |
5 Australia Chlorine Market Trends |
6 Australia Chlorine Market, By Types |
6.1 Australia Chlorine Market, By Application |
6.1.1 Overview and Analysis |
6.1.2 Australia Chlorine Market Revenues & Volume, By Application, 2021-2031F |
6.1.3 Australia Chlorine Market Revenues & Volume, By EDC/PVC, 2021-2031F |
6.1.4 Australia Chlorine Market Revenues & Volume, By Isocyanates and Oxygenates, 2021-2031F |
6.1.5 Australia Chlorine Market Revenues & Volume, By Chloromethanes, 2021-2031F |
6.1.6 Australia Chlorine Market Revenues & Volume, By Solvents and Epichlorohydrin, 2021-2031F |
6.1.7 Australia Chlorine Market Revenues & Volume, By Inorganic Chemicals, 2021-2031F |
6.1.8 Australia Chlorine Market Revenues & Volume, By Other Applications, 2021-2031F |
6.2 Australia Chlorine Market, By End-user Industry |
6.2.1 Overview and Analysis |
6.2.2 Australia Chlorine Market Revenues & Volume, By Water Treatment, 2021-2031F |
6.2.3 Australia Chlorine Market Revenues & Volume, By Pharmaceutical, 2021-2031F |
6.2.4 Australia Chlorine Market Revenues & Volume, By Chemicals, 2021-2031F |
6.2.5 Australia Chlorine Market Revenues & Volume, By Paper and Pulp, 2021-2031F |
6.2.6 Australia Chlorine Market Revenues & Volume, By Plastic, 2021-2031F |
6.2.7 Australia Chlorine Market Revenues & Volume, By Pesticides, 2021-2031F |
7 Australia Chlorine Market Import-Export Trade Statistics |
7.1 Australia Chlorine Market Export to Major Countries |
7.2 Australia Chlorine Market Imports from Major Countries |
8 Australia Chlorine Market Key Performance Indicators |
8.1 Number of new water treatment projects using chlorine technology. |
8.2 Percentage of compliance with government regulations on water quality. |
8.3 Research and development investment in chlorine production efficiency and environmental sustainability. |
9 Australia Chlorine Market - Opportunity Assessment |
9.1 Australia Chlorine Market Opportunity Assessment, By Application, 2021 & 2031F |
9.2 Australia Chlorine Market Opportunity Assessment, By End-user Industry, 2021 & 2031F |
10 Australia Chlorine Market - Competitive Landscape |
10.1 Australia Chlorine Market Revenue Share, By Companies, 2024 |
10.2 Australia Chlorine Market Competitive Benchmarking, By Operating and Technical Parameters |
11 Company Profiles |
12 Recommendations |
13 Disclaimer |
Export potential assessment - trade Analytics for 2030
Export potential enables firms to identify high-growth global markets with greater confidence by combining advanced trade intelligence with a structured quantitative methodology. The framework analyzes emerging demand trends and country-level import patterns while integrating macroeconomic and trade datasets such as GDP and population forecasts, bilateral import–export flows, tariff structures, elasticity differentials between developed and developing economies, geographic distance, and import demand projections. Using weighted trade values from 2020–2024 as the base period to project country-to-country export potential for 2030, these inputs are operationalized through calculated drivers such as gravity model parameters, tariff impact factors, and projected GDP per-capita growth. Through an analysis of hidden potentials, demand hotspots, and market conditions that are most favorable to success, this method enables firms to focus on target countries, maximize returns, and global expansion with data, backed by accuracy.
By factoring in the projected importer demand gap that is currently unmet and could be potential opportunity, it identifies the potential for the Exporter (Country) among 190 countries, against the general trade analysis, which identifies the biggest importer or exporter.
To discover high-growth global markets and optimize your business strategy:
Click Here
Pricing
- Single User License$ 1,995
- Department License$ 2,400
- Site License$ 3,120
- Global License$ 3,795

Search
Thought Leadership and Analyst Meet


Our Clients
Related Reports
- India Switchgear Market Outlook (2026 - 2032) | Size, Share, Trends, Growth, Revenue, Forecast, Analysis, Value, Outlook
- Pakistan Contraceptive Implants Market (2025-2031) | Demand, Growth, Size, Share, Industry, Pricing Analysis, Competitive, Strategic Insights, Strategy, Consumer Insights, Analysis, Investment Trends, Opportunities, Revenue, Segments, Value, Segmentation, Supply, Forecast, Restraints, Outlook, Competition, Drivers, Trends, Companies, Challenges
- Sri Lanka Packaging Market (2026-2032) | Outlook, Competition, Drivers, Trends, Demand, Pricing Analysis, Competitive, Strategic Insights, Companies, Challenges, Strategy, Consumer Insights, Analysis, Investment Trends, Opportunities, Growth, Size, Share, Industry, Revenue, Segments, Value, Segmentation, Supply, Forecast, Restraints
- India Kids Watches Market (2026-2032) | Strategy, Consumer Insights, Analysis, Investment Trends, Opportunities, Growth, Size, Share, Industry, Revenue, Segments, Value, Segmentation, Supply, Forecast, Restraints, Outlook, Competition, Drivers, Trends, Demand, Pricing Analysis, Competitive, Strategic Insights, Companies, Challenges
- Saudi Arabia Core Assurance Service Market (2025-2031) | Strategy, Consumer Insights, Analysis, Investment Trends, Opportunities, Growth, Size, Share, Industry, Revenue, Segments, Value, Segmentation, Supply, Forecast, Restraints, Outlook, Competition, Drivers, Trends, Demand, Pricing Analysis, Competitive, Strategic Insights, Companies, Challenges
- Romania Uninterruptible Power Supply (UPS) Market (2026-2032) | Industry, Analysis, Revenue, Size, Forecast, Outlook, Value, Trends, Share, Growth & Companies
- Saudi Arabia Car Window Tinting Film, Paint Protection Film (PPF), and Ceramic Coating Market (2025-2031) | Strategy, Consumer Insights, Analysis, Investment Trends, Opportunities, Growth, Size, Share, Industry, Revenue, Segments, Value, Segmentation, Supply, Forecast, Restraints, Outlook, Competition, Drivers, Trends, Demand, Pricing Analysis, Competitive, Strategic Insights, Companies, Challenges
- South Africa Stationery Market (2025-2031) | Share, Size, Industry, Value, Growth, Revenue, Analysis, Trends, Segmentation & Outlook
- Afghanistan Rocking Chairs And Adirondack Chairs Market (2026-2032) | Size & Revenue, Competitive Landscape, Share, Segmentation, Industry, Value, Outlook, Analysis, Trends, Growth, Forecast, Companies
- Afghanistan Apparel Market (2026-2032) | Growth, Outlook, Industry, Segmentation, Forecast, Size, Companies, Trends, Value, Share, Analysis & Revenue
Industry Events and Analyst Meet

India EV Show 2026

EV tech India Expo 2026

Auto Tech Asia 2026

Battery Tech India 2026

Smart Production Solutions Guangzhou 2026
Whitepaper
- Middle East & Africa Commercial Security Market Click here to view more.
- Middle East & Africa Fire Safety Systems & Equipment Market Click here to view more.
- GCC Drone Market Click here to view more.
- Middle East Lighting Fixture Market Click here to view more.
- GCC Physical & Perimeter Security Market Click here to view more.
6WResearch In News
- Doha a strategic location for EV manufacturing hub: IPA Qatar
- Demand for luxury TVs surging in the GCC, says Samsung
- Empowering Growth: The Thriving Journey of Bangladesh’s Cable Industry
- Demand for luxury TVs surging in the GCC, says Samsung
- Video call with a traditional healer? Once unthinkable, it’s now common in South Africa
- Intelligent Buildings To Smooth GCC’s Path To Net Zero