Australia Clay Market Outlook | Value, Growth, Size, Forecast, Companies, Revenue, Share, Analysis, COVID-19 IMPACT, Industry & Trends
Market Forecast By Application (Tableware, Sanitary ware, Medical applications), By End Use (Ceramic and, Non-ceramic) And Competitive Landscape
| Product Code: ETC318995 | Publication Date: Aug 2022 | Updated Date: Jan 2026 | Product Type: Market Research Report | |
| Publisher: 6Wresearch | Author: Shubham Padhi | No. of Pages: 75 | No. of Figures: 35 | No. of Tables: 20 |
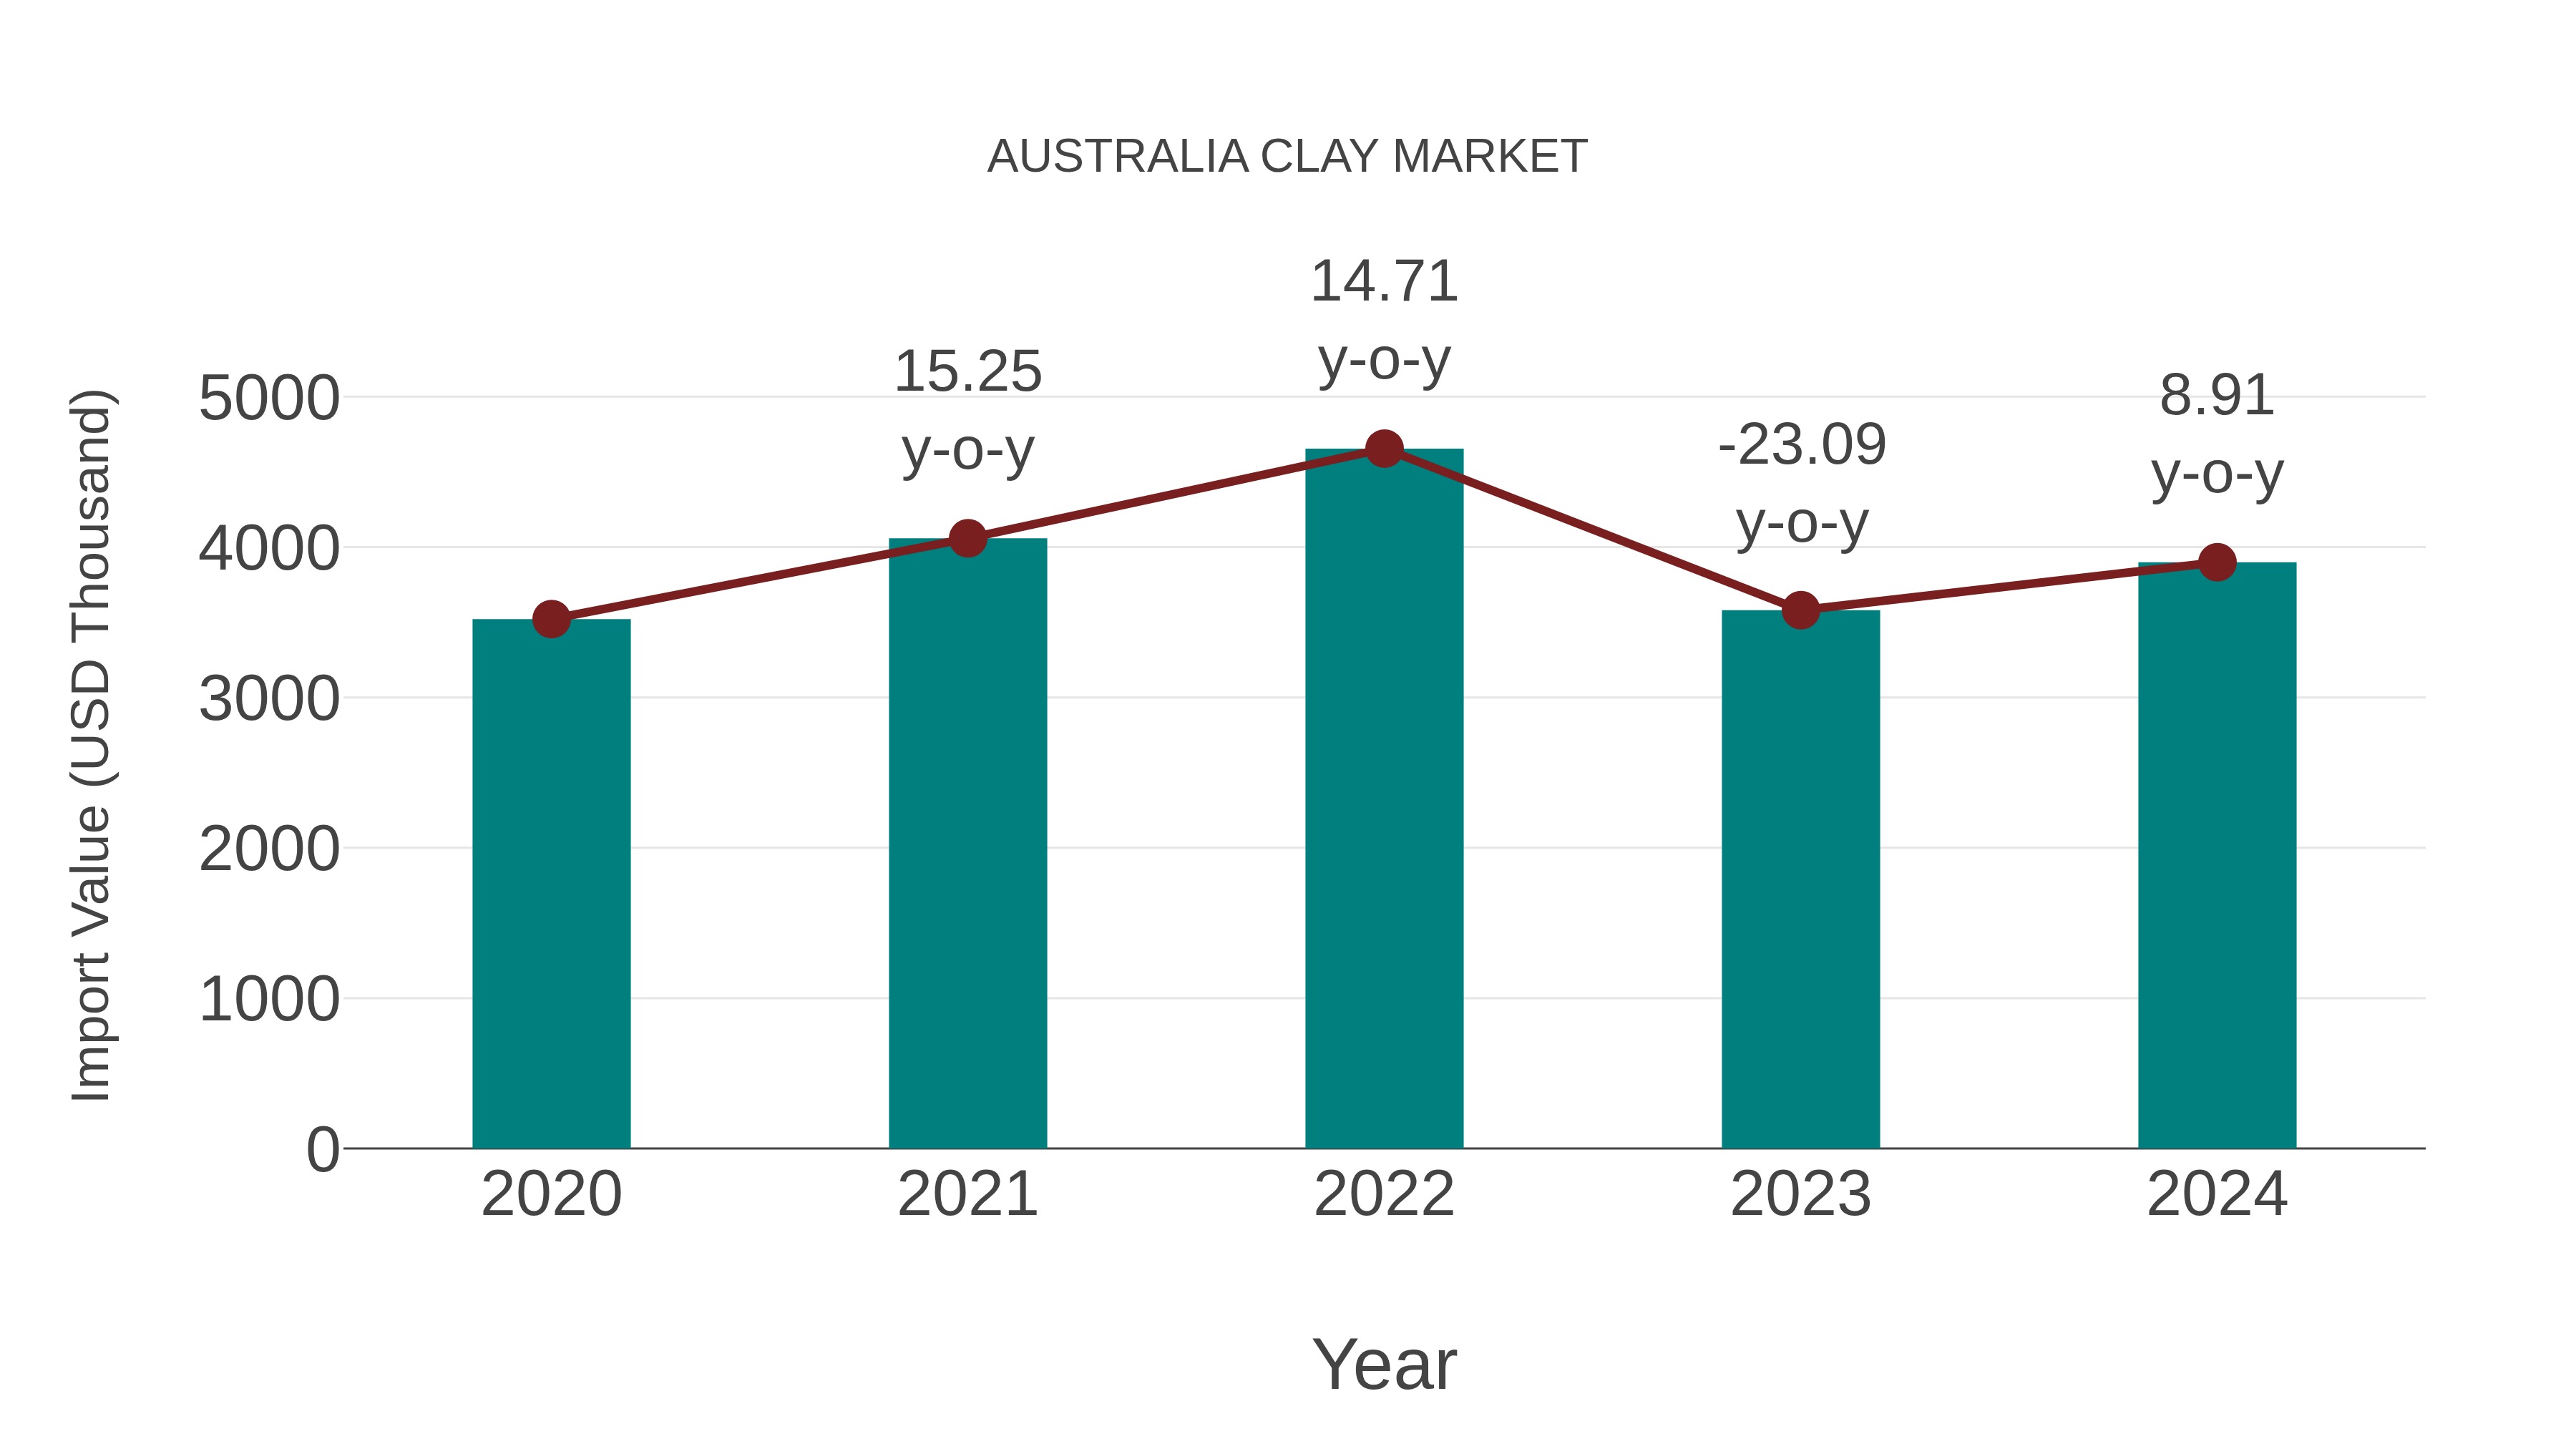
Australia Clay Market: Import Trend Analysis
Australia`s import trend in the clay market showed a growth rate of 8.91% from 2023 to 2024, with a compound annual growth rate (CAGR) of 2.58% from 2020 to 2024. This import momentum can be attributed to a steady demand shift towards higher-quality clay products, reflecting market stability and evolving consumer preferences.
Australia Clay Market Overview
Australia clay market encompasses a wide range of clay minerals used in various industries such as construction, ceramics, refractories, cosmetics, and pharmaceuticals. Clay minerals, including kaolin, bentonite, montmorillonite, and illite, offer properties such as plasticity, adhesion, absorption, and thermal stability, making them versatile raw materials for manufacturing processes and product formulations. With a focus on geological exploration, mining operations, and quality control, clay suppliers ensure a reliable supply of raw materials to meet the diverse needs of customers in the Australia market.
Drivers of the market
marily driven by increasing awareness regarding hygiene and sanitation among consumers. Rising concerns about health and well-being drive the demand for cleaning products and detergents across residential, commercial, and industrial sectors. Moreover, changing lifestyle patterns, urbanization, and the growing working population contribute to the market`s growth by increasing the demand for convenient and time-saving cleaning solutions. Furthermore, product innovations, such as eco-friendly and biodegradable cleaning formulations, attract environmentally conscious consumers, driving market expansion. Additionally, aggressive marketing strategies, promotional campaigns, and the availability of a wide range of cleaning products across various distribution channels further propel market growth by enhancing product accessibility and consumer engagement.
Challenges of the market
Challenges in the Australia clay market include managing environmental regulations governing clay mining and processing, addressing concerns about land disturbance and habitat loss, and exploring new applications in ceramics, construction materials, and industrial processes.
Government Policy of the market
The Australia clay market encompasses the extraction, processing, and distribution of clay minerals used in various industries such as ceramics, construction, and agriculture. Regulatory considerations may include environmental regulations for clay mining, occupational health and safety standards for workers, and quality standards for clay products. Compliance with these regulations ensures sustainable and responsible management of clay resources and product quality.
Key Highlights of the Report:
- Australia Clay Market Outlook
- Market Size of Australia Clay Market, 2024
- Forecast of Australia Clay Market, 2031
- Historical Data and Forecast of Australia Clay Revenues & Volume for the Period 2018 - 2031
- Australia Clay Market Trend Evolution
- Australia Clay Market Drivers and Challenges
- Australia Clay Price Trends
- Australia Clay Porter's Five Forces
- Australia Clay Industry Life Cycle
- Historical Data and Forecast of Australia Clay Market Revenues & Volume By Application for the Period 2018 - 2031
- Historical Data and Forecast of Australia Clay Market Revenues & Volume By Tableware for the Period 2018 - 2031
- Historical Data and Forecast of Australia Clay Market Revenues & Volume By Sanitary ware for the Period 2018 - 2031
- Historical Data and Forecast of Australia Clay Market Revenues & Volume By Medical applications for the Period 2018 - 2031
- Historical Data and Forecast of Australia Clay Market Revenues & Volume By End Use for the Period 2018 - 2031
- Historical Data and Forecast of Australia Clay Market Revenues & Volume By Ceramic and for the Period 2018 - 2031
- Historical Data and Forecast of Australia Clay Market Revenues & Volume By Non-ceramic for the Period 2018 - 2031
- Australia Clay Import Export Trade Statistics
- Market Opportunity Assessment By Application
- Market Opportunity Assessment By End Use
- Australia Clay Top Companies Market Share
- Australia Clay Competitive Benchmarking By Technical and Operational Parameters
- Australia Clay Company Profiles
- Australia Clay Key Strategic Recommendations
Frequently Asked Questions About the Market Study (FAQs):
6Wresearch actively monitors the Australia Clay Market and publishes its comprehensive annual report, highlighting emerging trends, growth drivers, revenue analysis, and forecast outlook. Our insights help businesses to make data-backed strategic decisions with ongoing market dynamics. Our analysts track relevent industries related to the Australia Clay Market, allowing our clients with actionable intelligence and reliable forecasts tailored to emerging regional needs.
Yes, we provide customisation as per your requirements. To learn more, feel free to contact us on sales@6wresearch.com
1 Executive Summary |
2 Introduction |
2.1 Key Highlights of the Report |
2.2 Report Description |
2.3 Market Scope & Segmentation |
2.4 Research Methodology |
2.5 Assumptions |
3 Australia Clay Market Overview |
3.1 Australia Country Macro Economic Indicators |
3.2 Australia Clay Market Revenues & Volume, 2021 & 2031F |
3.3 Australia Clay Market - Industry Life Cycle |
3.4 Australia Clay Market - Porter's Five Forces |
3.5 Australia Clay Market Revenues & Volume Share, By Application, 2021 & 2031F |
3.6 Australia Clay Market Revenues & Volume Share, By End Use, 2021 & 2031F |
4 Australia Clay Market Dynamics |
4.1 Impact Analysis |
4.2 Market Drivers |
4.2.1 Increasing demand for clay in the construction industry for applications such as bricks, tiles, and ceramics. |
4.2.2 Growing use of clay in the cosmetics and pharmaceutical industries for products like face masks and tablets. |
4.2.3 Rising adoption of clay in environmental and agricultural applications for soil enhancement and pollution control. |
4.3 Market Restraints |
4.3.1 Fluctuations in raw material prices impacting the production cost of clay products. |
4.3.2 Regulatory challenges related to environmental concerns and mining regulations. |
4.3.3 Competition from alternative materials such as polymers and composites affecting the market demand for clay products. |
5 Australia Clay Market Trends |
6 Australia Clay Market, By Types |
6.1 Australia Clay Market, By Application |
6.1.1 Overview and Analysis |
6.1.2 Australia Clay Market Revenues & Volume, By Application, 2021-2031F |
6.1.3 Australia Clay Market Revenues & Volume, By Tableware, 2021-2031F |
6.1.4 Australia Clay Market Revenues & Volume, By Sanitary ware, 2021-2031F |
6.1.5 Australia Clay Market Revenues & Volume, By Medical applications, 2021-2031F |
6.2 Australia Clay Market, By End Use |
6.2.1 Overview and Analysis |
6.2.2 Australia Clay Market Revenues & Volume, By Ceramic and, 2021-2031F |
6.2.3 Australia Clay Market Revenues & Volume, By Non-ceramic, 2021-2031F |
7 Australia Clay Market Import-Export Trade Statistics |
7.1 Australia Clay Market Export to Major Countries |
7.2 Australia Clay Market Imports from Major Countries |
8 Australia Clay Market Key Performance Indicators |
8.1 Average selling price of clay products. |
8.2 Number of new applications for clay in different industries. |
8.3 Innovation rate in clay processing technologies. |
8.4 Export/import volume of clay products. |
8.5 Percentage of market share held by clay products in specific industries. |
9 Australia Clay Market - Opportunity Assessment |
9.1 Australia Clay Market Opportunity Assessment, By Application, 2021 & 2031F |
9.2 Australia Clay Market Opportunity Assessment, By End Use, 2021 & 2031F |
10 Australia Clay Market - Competitive Landscape |
10.1 Australia Clay Market Revenue Share, By Companies, 2024 |
10.2 Australia Clay Market Competitive Benchmarking, By Operating and Technical Parameters |
11 Company Profiles |
12 Recommendations |
13 Disclaimer |
Export potential assessment - trade Analytics for 2030
Export potential enables firms to identify high-growth global markets with greater confidence by combining advanced trade intelligence with a structured quantitative methodology. The framework analyzes emerging demand trends and country-level import patterns while integrating macroeconomic and trade datasets such as GDP and population forecasts, bilateral import–export flows, tariff structures, elasticity differentials between developed and developing economies, geographic distance, and import demand projections. Using weighted trade values from 2020–2024 as the base period to project country-to-country export potential for 2030, these inputs are operationalized through calculated drivers such as gravity model parameters, tariff impact factors, and projected GDP per-capita growth. Through an analysis of hidden potentials, demand hotspots, and market conditions that are most favorable to success, this method enables firms to focus on target countries, maximize returns, and global expansion with data, backed by accuracy.
By factoring in the projected importer demand gap that is currently unmet and could be potential opportunity, it identifies the potential for the Exporter (Country) among 190 countries, against the general trade analysis, which identifies the biggest importer or exporter.
To discover high-growth global markets and optimize your business strategy:
Click Here
Pricing
- Single User License$ 1,995
- Department License$ 2,400
- Site License$ 3,120
- Global License$ 3,795

Search
Thought Leadership and Analyst Meet


Our Clients
Related Reports
- India Switchgear Market Outlook (2026 - 2032) | Size, Share, Trends, Growth, Revenue, Forecast, Analysis, Value, Outlook
- Pakistan Contraceptive Implants Market (2025-2031) | Demand, Growth, Size, Share, Industry, Pricing Analysis, Competitive, Strategic Insights, Strategy, Consumer Insights, Analysis, Investment Trends, Opportunities, Revenue, Segments, Value, Segmentation, Supply, Forecast, Restraints, Outlook, Competition, Drivers, Trends, Companies, Challenges
- Sri Lanka Packaging Market (2026-2032) | Outlook, Competition, Drivers, Trends, Demand, Pricing Analysis, Competitive, Strategic Insights, Companies, Challenges, Strategy, Consumer Insights, Analysis, Investment Trends, Opportunities, Growth, Size, Share, Industry, Revenue, Segments, Value, Segmentation, Supply, Forecast, Restraints
- India Kids Watches Market (2026-2032) | Strategy, Consumer Insights, Analysis, Investment Trends, Opportunities, Growth, Size, Share, Industry, Revenue, Segments, Value, Segmentation, Supply, Forecast, Restraints, Outlook, Competition, Drivers, Trends, Demand, Pricing Analysis, Competitive, Strategic Insights, Companies, Challenges
- Saudi Arabia Core Assurance Service Market (2025-2031) | Strategy, Consumer Insights, Analysis, Investment Trends, Opportunities, Growth, Size, Share, Industry, Revenue, Segments, Value, Segmentation, Supply, Forecast, Restraints, Outlook, Competition, Drivers, Trends, Demand, Pricing Analysis, Competitive, Strategic Insights, Companies, Challenges
- Romania Uninterruptible Power Supply (UPS) Market (2026-2032) | Industry, Analysis, Revenue, Size, Forecast, Outlook, Value, Trends, Share, Growth & Companies
- Saudi Arabia Car Window Tinting Film, Paint Protection Film (PPF), and Ceramic Coating Market (2025-2031) | Strategy, Consumer Insights, Analysis, Investment Trends, Opportunities, Growth, Size, Share, Industry, Revenue, Segments, Value, Segmentation, Supply, Forecast, Restraints, Outlook, Competition, Drivers, Trends, Demand, Pricing Analysis, Competitive, Strategic Insights, Companies, Challenges
- South Africa Stationery Market (2025-2031) | Share, Size, Industry, Value, Growth, Revenue, Analysis, Trends, Segmentation & Outlook
- Afghanistan Rocking Chairs And Adirondack Chairs Market (2026-2032) | Size & Revenue, Competitive Landscape, Share, Segmentation, Industry, Value, Outlook, Analysis, Trends, Growth, Forecast, Companies
- Afghanistan Apparel Market (2026-2032) | Growth, Outlook, Industry, Segmentation, Forecast, Size, Companies, Trends, Value, Share, Analysis & Revenue
Industry Events and Analyst Meet

EV tech India Expo 2026

Auto Tech Asia 2026

Battery Tech India 2026

Smart Production Solutions Guangzhou 2026

Stationery & Paper Expo Saudi Arabia 2026
Whitepaper
- Middle East & Africa Commercial Security Market Click here to view more.
- Middle East & Africa Fire Safety Systems & Equipment Market Click here to view more.
- GCC Drone Market Click here to view more.
- Middle East Lighting Fixture Market Click here to view more.
- GCC Physical & Perimeter Security Market Click here to view more.
6WResearch In News
- Doha a strategic location for EV manufacturing hub: IPA Qatar
- Demand for luxury TVs surging in the GCC, says Samsung
- Empowering Growth: The Thriving Journey of Bangladesh’s Cable Industry
- Demand for luxury TVs surging in the GCC, says Samsung
- Video call with a traditional healer? Once unthinkable, it’s now common in South Africa
- Intelligent Buildings To Smooth GCC’s Path To Net Zero