Australia Drinkware Market (2020-2026) | Forecast, Analysis, Share, Industry, Outlook, Growth, Value, COVID-19 IMPACT, Size, Companies, Revenue & Trends
Market Forecast By Types (Glass, Stainless Steel, Ceramic, Polymer, Other), By Applications (Home, Hotel, Restaurant, Others), By Product Types (Water bottle, Tumblers, Shakers, Infusers, Mugs & Cups) And Competitive Landscape
| Product Code: ETC006235 | Publication Date: Jun 2023 | Updated Date: Jan 2026 | Product Type: Report | |
| Publisher: 6Wresearch | Author: Ravi Bhandari | No. of Pages: 70 | No. of Figures: 35 | No. of Tables: 5 |
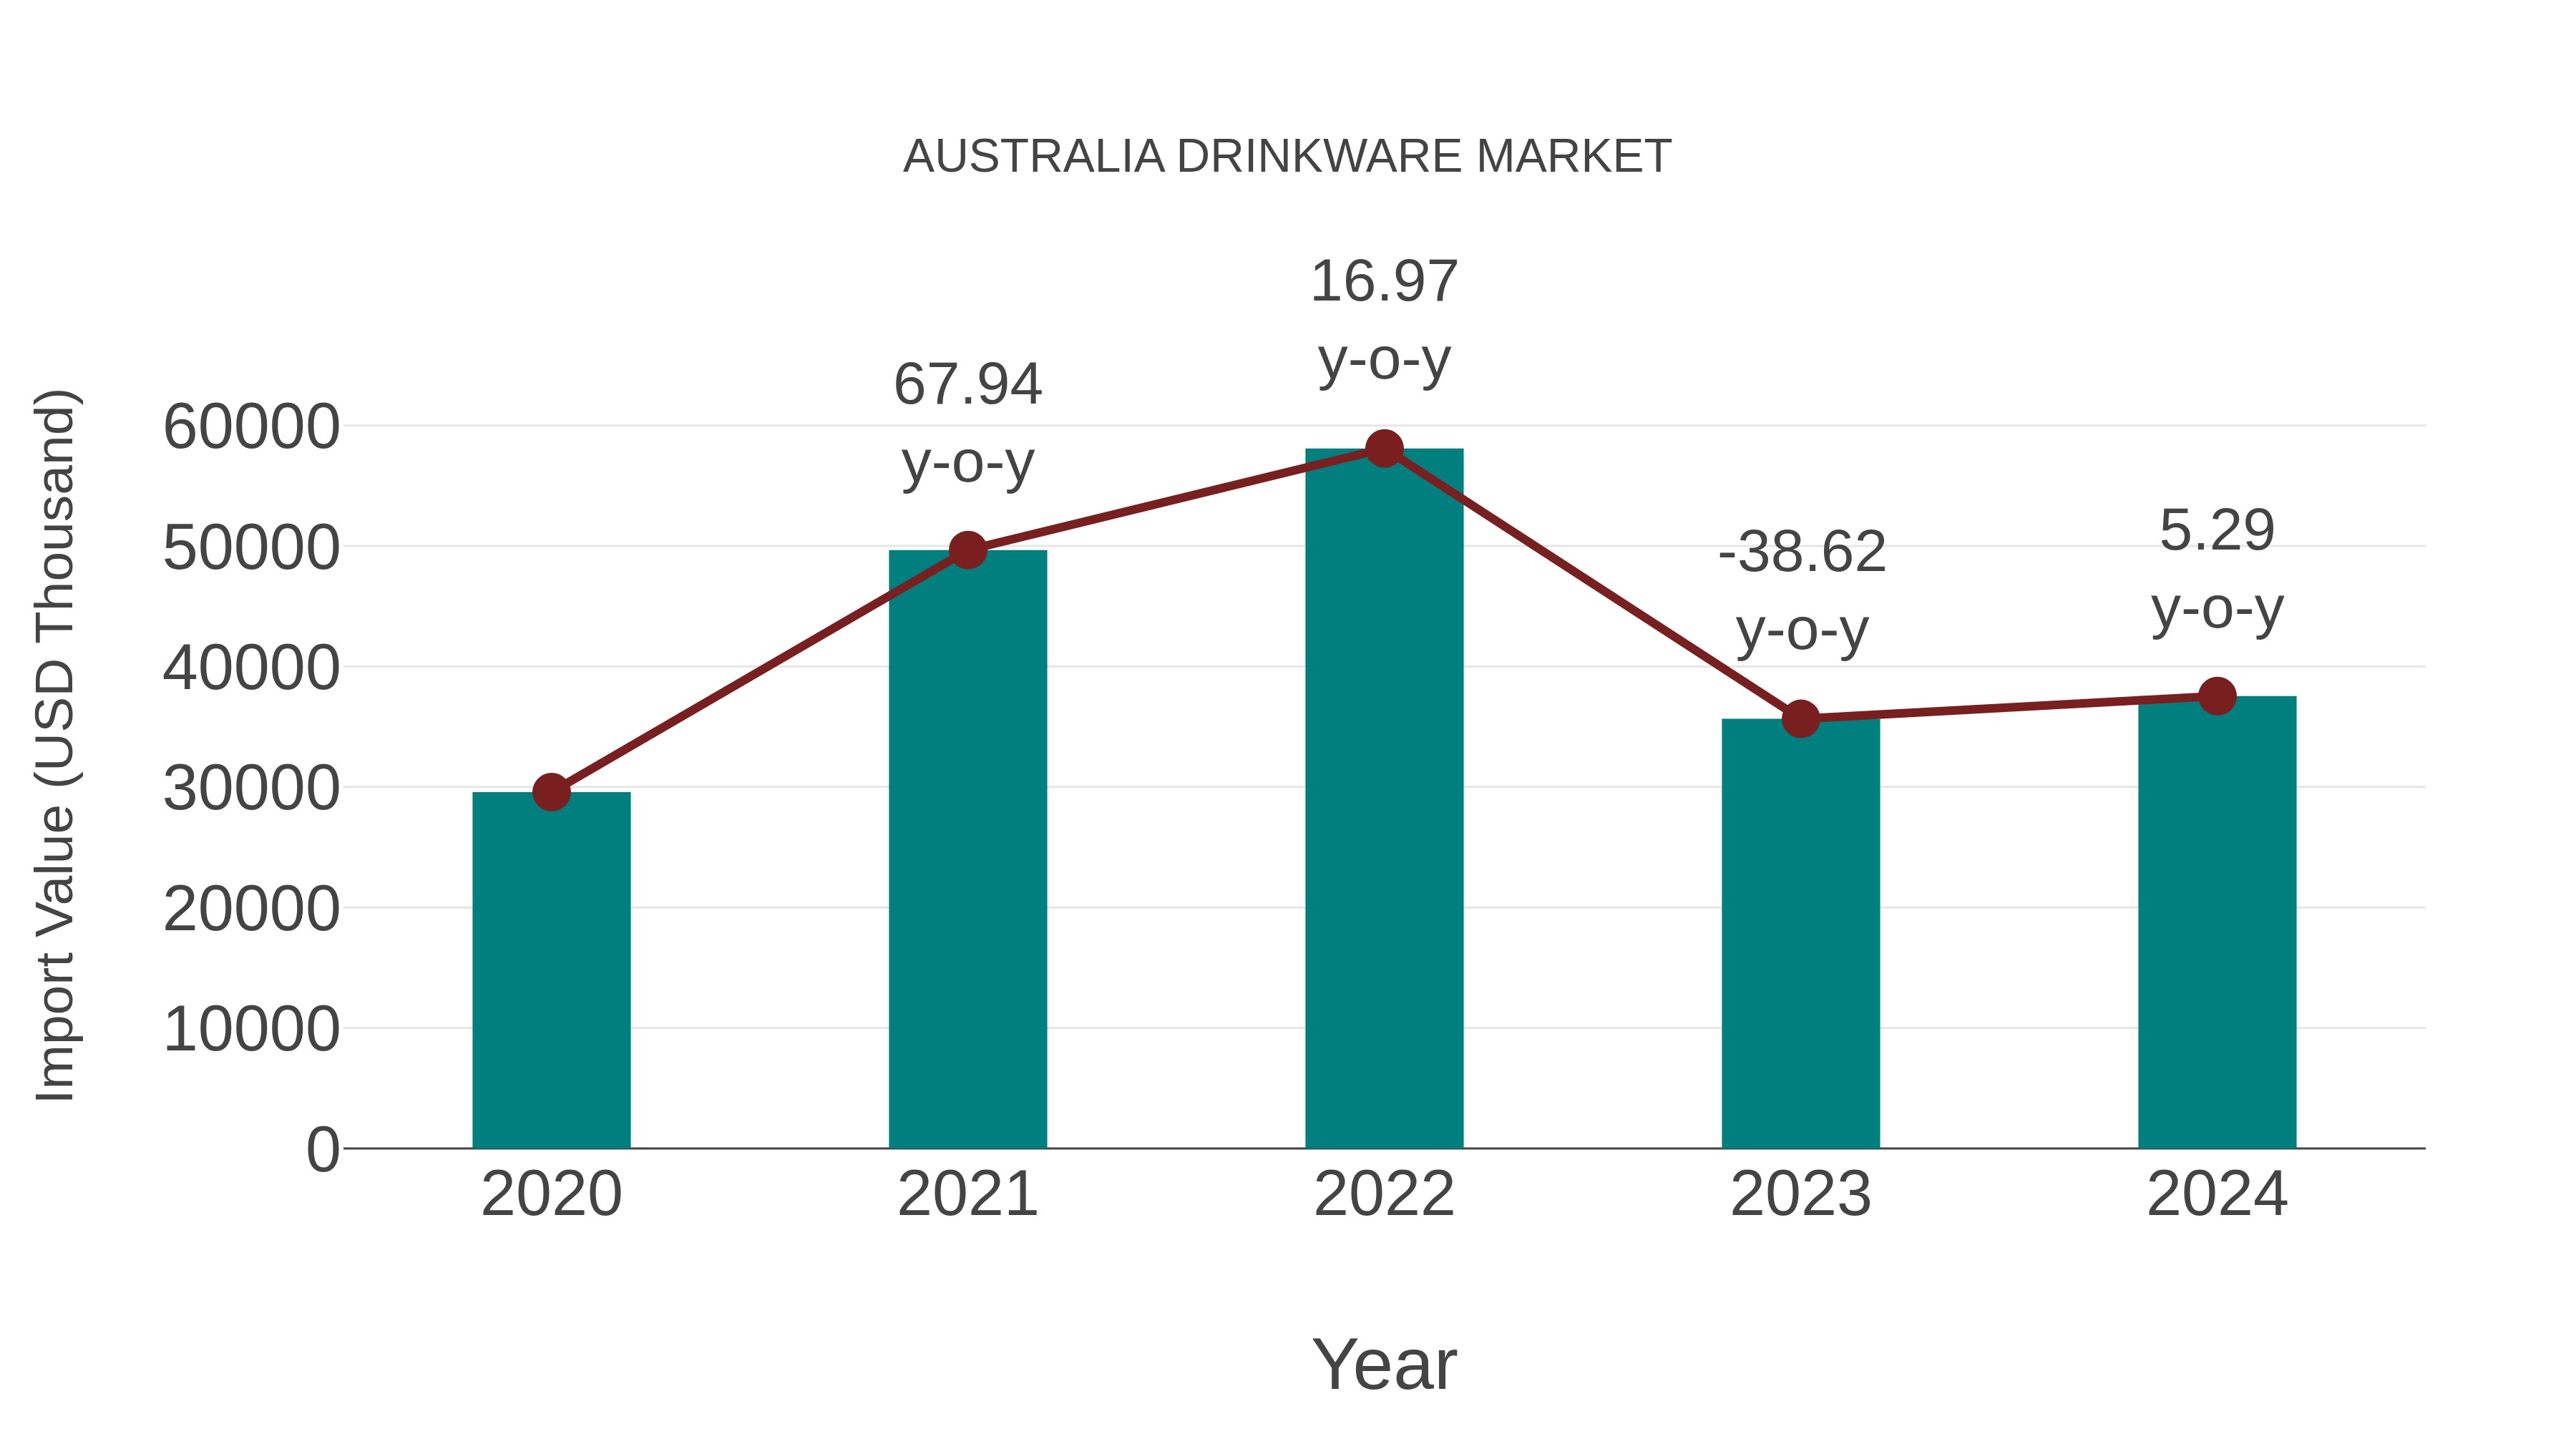
Australia Drinkware Market: Import Trend Analysis
In the Australia drinkware market, the import trend exhibited a growth rate of 5.29% from 2023 to 2024, with a compound annual growth rate (CAGR) of 6.15% from 2020 to 2024. This positive import momentum may be attributed to shifting consumer preferences towards premium drinkware products, indicating sustained market stability and increased demand for quality imports during the period.
Australia Drinkware Market Synopsis
The Australia drinkware market is expected to witness a CAGR of around 3.4% during the forecast period (2020-2026). The growing demand for high quality and sustainable products, along with increasing awareness about health & wellness is likely to drive the growth of the market in Australia. Moreover, rising disposable incomes among consumers are also anticipated to propel the market growth over the forecast period. Additionally, changing consumer preferences towards eco-friendly or reusable plastic and glass materials has provided a positive outlook for the industry over recent years. Furthermore, companies operating in this sector are focusing on launching innovative product portfolios such as insulated bottles that keep water cold & hot according to user requirement which will aid further boost its demand in near future.
Key Highlights of the Report:
- Australia Drinkware Market Outlook
- Market Size of Australia Drinkware Market, 2019
- Forecast of Australia Drinkware Market, 2026
- Historical Data and Forecast of Australia Drinkware Revenues & Volume for the Period 2016 - 2026
- Australia Drinkware Market Trend Evolution
- Australia Drinkware Market Drivers and Challenges
- Australia Drinkware Price Trends
- Australia Drinkware Porter's Five Forces
- Australia Drinkware Industry Life Cycle
- Historical Data and Forecast of Australia Drinkware Market Revenues & Volume By Types for the Period 2016 - 2026
- Historical Data and Forecast of Australia Drinkware Market Revenues & Volume By Glass for the Period 2016 - 2026
- Historical Data and Forecast of Australia Drinkware Market Revenues & Volume By Stainless Steel for the Period 2016 - 2026
- Historical Data and Forecast of Australia Drinkware Market Revenues & Volume By Ceramic for the Period 2016 - 2026
- Historical Data and Forecast of Australia Drinkware Market Revenues & Volume By Polymer for the Period 2016 - 2026
- Historical Data and Forecast of Australia Drinkware Market Revenues & Volume By Other for the Period 2016 - 2026
- Historical Data and Forecast of Australia Drinkware Market Revenues & Volume By Applications for the Period 2016 - 2026
- Historical Data and Forecast of Australia Drinkware Market Revenues & Volume By Home for the Period 2016 - 2026
- Historical Data and Forecast of Australia Drinkware Market Revenues & Volume By Hotel for the Period 2016 - 2026
- Historical Data and Forecast of Australia Drinkware Market Revenues & Volume By Restaurant for the Period 2016 - 2026
- Historical Data and Forecast of Australia Drinkware Market Revenues & Volume By Others for the Period 2016 - 2026
- Historical Data and Forecast of Australia Drinkware Market Revenues & Volume By Product Types for the Period 2016 - 2026
- Historical Data and Forecast of Australia Drinkware Market Revenues & Volume By Water bottle for the Period 2016 - 2026
- Historical Data and Forecast of Australia Drinkware Market Revenues & Volume By Tumblers for the Period 2016 - 2026
- Historical Data and Forecast of Australia Drinkware Market Revenues & Volume By Shakers for the Period 2016 - 2026
- Historical Data and Forecast of Australia Drinkware Market Revenues & Volume By Infusers for the Period 2016 - 2026
- Historical Data and Forecast of Australia Drinkware Market Revenues & Volume By Mugs & Cups for the Period 2016 - 2026
- Australia Drinkware Import Export Trade Statistics
- Market Opportunity Assessment By Types
- Market Opportunity Assessment By Applications
- Market Opportunity Assessment By Product Types
- Australia Drinkware Top Companies Market Share
- Australia Drinkware Competitive Benchmarking By Technical and Operational Parameters
- Australia Drinkware Company Profiles
- Australia Drinkware Key Strategic Recommendations
Frequently Asked Questions About the Market Study (FAQs):
6Wresearch actively monitors the Australia Drinkware Market and publishes its comprehensive annual report, highlighting emerging trends, growth drivers, revenue analysis, and forecast outlook. Our insights help businesses to make data-backed strategic decisions with ongoing market dynamics. Our analysts track relevent industries related to the Australia Drinkware Market, allowing our clients with actionable intelligence and reliable forecasts tailored to emerging regional needs.
Yes, we provide customisation as per your requirements. To learn more, feel free to contact us on sales@6wresearch.com
1 Executive Summary |
2 Introduction |
2.1 Key Highlights of the Report |
2.2 Report Description |
2.3 Market Scope & Segmentation |
2.4 Research Methodology |
2.5 Assumptions |
3 Australia Drinkware Market Overview |
3.1 Australia Country Macro Economic Indicators |
3.2 Australia Drinkware Market Revenues & Volume, 2019 & 2026F |
3.3 Australia Drinkware Market - Industry Life Cycle |
3.4 Australia Drinkware Market - Porter's Five Forces |
3.5 Australia Drinkware Market Revenues & Volume Share, By Types, 2019 & 2026F |
3.6 Australia Drinkware Market Revenues & Volume Share, By Applications, 2019 & 2026F |
3.7 Australia Drinkware Market Revenues & Volume Share, By Product Types, 2019 & 2026F |
4 Australia Drinkware Market Dynamics |
4.1 Impact Analysis |
4.2 Market Drivers |
4.2.1 Increasing consumer awareness about sustainability and eco-friendly products leading to a demand for recyclable and reusable drinkware. |
4.2.2 Growing trend of health and wellness, with consumers opting for drinkware that promotes hydration and overall well-being. |
4.2.3 Rising disposable income levels in Australia, allowing consumers to spend more on premium and customized drinkware options. |
4.3 Market Restraints |
4.3.1 Price sensitivity among consumers, especially in a competitive market, may restrict the adoption of higher-priced drinkware products. |
4.3.2 Fluctuating raw material costs, particularly for eco-friendly materials, can impact the pricing and availability of drinkware options in the market. |
4.3.3 Stringent regulations and standards related to food-grade materials and manufacturing processes may pose challenges for new entrants and smaller players in the market. |
5 Australia Drinkware Market Trends |
6 Australia Drinkware Market, By Types |
6.1 Australia Drinkware Market, By Types |
6.1.1 Overview and Analysis |
6.1.2 Australia Drinkware Market Revenues & Volume, By Types, 2016 - 2026F |
6.1.3 Australia Drinkware Market Revenues & Volume, By Glass, 2016 - 2026F |
6.1.4 Australia Drinkware Market Revenues & Volume, By Stainless Steel, 2016 - 2026F |
6.1.5 Australia Drinkware Market Revenues & Volume, By Ceramic, 2016 - 2026F |
6.1.6 Australia Drinkware Market Revenues & Volume, By Polymer, 2016 - 2026F |
6.1.7 Australia Drinkware Market Revenues & Volume, By Other, 2016 - 2026F |
6.2 Australia Drinkware Market, By Applications |
6.2.1 Overview and Analysis |
6.2.2 Australia Drinkware Market Revenues & Volume, By Home, 2016 - 2026F |
6.2.3 Australia Drinkware Market Revenues & Volume, By Hotel, 2016 - 2026F |
6.2.4 Australia Drinkware Market Revenues & Volume, By Restaurant, 2016 - 2026F |
6.2.5 Australia Drinkware Market Revenues & Volume, By Others, 2016 - 2026F |
6.3 Australia Drinkware Market, By Product Types |
6.3.1 Overview and Analysis |
6.3.2 Australia Drinkware Market Revenues & Volume, By Water bottle, 2016 - 2026F |
6.3.3 Australia Drinkware Market Revenues & Volume, By Tumblers, 2016 - 2026F |
6.3.4 Australia Drinkware Market Revenues & Volume, By Shakers, 2016 - 2026F |
6.3.5 Australia Drinkware Market Revenues & Volume, By Infusers, 2016 - 2026F |
6.3.6 Australia Drinkware Market Revenues & Volume, By Mugs & Cups, 2016 - 2026F |
7 Australia Drinkware Market Import-Export Trade Statistics |
7.1 Australia Drinkware Market Export to Major Countries |
7.2 Australia Drinkware Market Imports from Major Countries |
8 Australia Drinkware Market Key Performance Indicators |
8.1 Customer engagement metrics such as social media interactions, online reviews, and brand sentiment to gauge consumer interest and perception. |
8.2 Sustainability metrics like the percentage of recyclable materials used, carbon footprint reduction initiatives, and eco-certifications obtained. |
8.3 Innovation rate measured by the number of new product launches, patents filed, and collaborations with designers or artists to assess market responsiveness and competitiveness. |
9 Australia Drinkware Market - Opportunity Assessment |
9.1 Australia Drinkware Market Opportunity Assessment, By Types, 2019 & 2026F |
9.2 Australia Drinkware Market Opportunity Assessment, By Applications, 2019 & 2026F |
9.3 Australia Drinkware Market Opportunity Assessment, By Product Types, 2019 & 2026F |
10 Australia Drinkware Market - Competitive Landscape |
10.1 Australia Drinkware Market Revenue Share, By Companies, 2019 |
10.2 Australia Drinkware Market Competitive Benchmarking, By Operating and Technical Parameters |
11 Company Profiles |
12 Recommendations |
13 Disclaimer |
Export potential assessment - trade Analytics for 2030
Export potential enables firms to identify high-growth global markets with greater confidence by combining advanced trade intelligence with a structured quantitative methodology. The framework analyzes emerging demand trends and country-level import patterns while integrating macroeconomic and trade datasets such as GDP and population forecasts, bilateral import–export flows, tariff structures, elasticity differentials between developed and developing economies, geographic distance, and import demand projections. Using weighted trade values from 2020–2024 as the base period to project country-to-country export potential for 2030, these inputs are operationalized through calculated drivers such as gravity model parameters, tariff impact factors, and projected GDP per-capita growth. Through an analysis of hidden potentials, demand hotspots, and market conditions that are most favorable to success, this method enables firms to focus on target countries, maximize returns, and global expansion with data, backed by accuracy.
By factoring in the projected importer demand gap that is currently unmet and could be potential opportunity, it identifies the potential for the Exporter (Country) among 190 countries, against the general trade analysis, which identifies the biggest importer or exporter.
To discover high-growth global markets and optimize your business strategy:
Click Here
Pricing
- Single User License$ 1,995
- Department License$ 2,400
- Site License$ 3,120
- Global License$ 3,795

Search
Thought Leadership and Analyst Meet


Our Clients
Related Reports
- India Switchgear Market Outlook (2026 - 2032) | Size, Share, Trends, Growth, Revenue, Forecast, Analysis, Value, Outlook
- Pakistan Contraceptive Implants Market (2025-2031) | Demand, Growth, Size, Share, Industry, Pricing Analysis, Competitive, Strategic Insights, Strategy, Consumer Insights, Analysis, Investment Trends, Opportunities, Revenue, Segments, Value, Segmentation, Supply, Forecast, Restraints, Outlook, Competition, Drivers, Trends, Companies, Challenges
- Sri Lanka Packaging Market (2026-2032) | Outlook, Competition, Drivers, Trends, Demand, Pricing Analysis, Competitive, Strategic Insights, Companies, Challenges, Strategy, Consumer Insights, Analysis, Investment Trends, Opportunities, Growth, Size, Share, Industry, Revenue, Segments, Value, Segmentation, Supply, Forecast, Restraints
- India Kids Watches Market (2026-2032) | Strategy, Consumer Insights, Analysis, Investment Trends, Opportunities, Growth, Size, Share, Industry, Revenue, Segments, Value, Segmentation, Supply, Forecast, Restraints, Outlook, Competition, Drivers, Trends, Demand, Pricing Analysis, Competitive, Strategic Insights, Companies, Challenges
- Saudi Arabia Core Assurance Service Market (2025-2031) | Strategy, Consumer Insights, Analysis, Investment Trends, Opportunities, Growth, Size, Share, Industry, Revenue, Segments, Value, Segmentation, Supply, Forecast, Restraints, Outlook, Competition, Drivers, Trends, Demand, Pricing Analysis, Competitive, Strategic Insights, Companies, Challenges
- Romania Uninterruptible Power Supply (UPS) Market (2026-2032) | Industry, Analysis, Revenue, Size, Forecast, Outlook, Value, Trends, Share, Growth & Companies
- Saudi Arabia Car Window Tinting Film, Paint Protection Film (PPF), and Ceramic Coating Market (2025-2031) | Strategy, Consumer Insights, Analysis, Investment Trends, Opportunities, Growth, Size, Share, Industry, Revenue, Segments, Value, Segmentation, Supply, Forecast, Restraints, Outlook, Competition, Drivers, Trends, Demand, Pricing Analysis, Competitive, Strategic Insights, Companies, Challenges
- South Africa Stationery Market (2025-2031) | Share, Size, Industry, Value, Growth, Revenue, Analysis, Trends, Segmentation & Outlook
- Afghanistan Rocking Chairs And Adirondack Chairs Market (2026-2032) | Size & Revenue, Competitive Landscape, Share, Segmentation, Industry, Value, Outlook, Analysis, Trends, Growth, Forecast, Companies
- Afghanistan Apparel Market (2026-2032) | Growth, Outlook, Industry, Segmentation, Forecast, Size, Companies, Trends, Value, Share, Analysis & Revenue
Industry Events and Analyst Meet

EV tech India Expo 2026

Auto Tech Asia 2026

Battery Tech India 2026

Smart Production Solutions Guangzhou 2026

Stationery & Paper Expo Saudi Arabia 2026
Whitepaper
- Middle East & Africa Commercial Security Market Click here to view more.
- Middle East & Africa Fire Safety Systems & Equipment Market Click here to view more.
- GCC Drone Market Click here to view more.
- Middle East Lighting Fixture Market Click here to view more.
- GCC Physical & Perimeter Security Market Click here to view more.
6WResearch In News
- Doha a strategic location for EV manufacturing hub: IPA Qatar
- Demand for luxury TVs surging in the GCC, says Samsung
- Empowering Growth: The Thriving Journey of Bangladesh’s Cable Industry
- Demand for luxury TVs surging in the GCC, says Samsung
- Video call with a traditional healer? Once unthinkable, it’s now common in South Africa
- Intelligent Buildings To Smooth GCC’s Path To Net Zero