Australia Fuel Station Market (2026-2032) | Value, Outlook, Analysis, Share, Trends, Companies, Growth, Revenue, Industry, Size & Forecast
Market Forecast By Fuel (Gasoline, Diesel, Gas, others), By End-User (Road Transport Vehicles, Air Transport Vehicles, Water Transport Vehicles) And Competitive Landscape
| Product Code: ETC234635 | Publication Date: Aug 2022 | Updated Date: Mar 2026 | Product Type: Market Research Report | |
| Publisher: 6Wresearch | Author: Ravi Bhandari | No. of Pages: 70 | No. of Figures: 35 | No. of Tables: 5 |
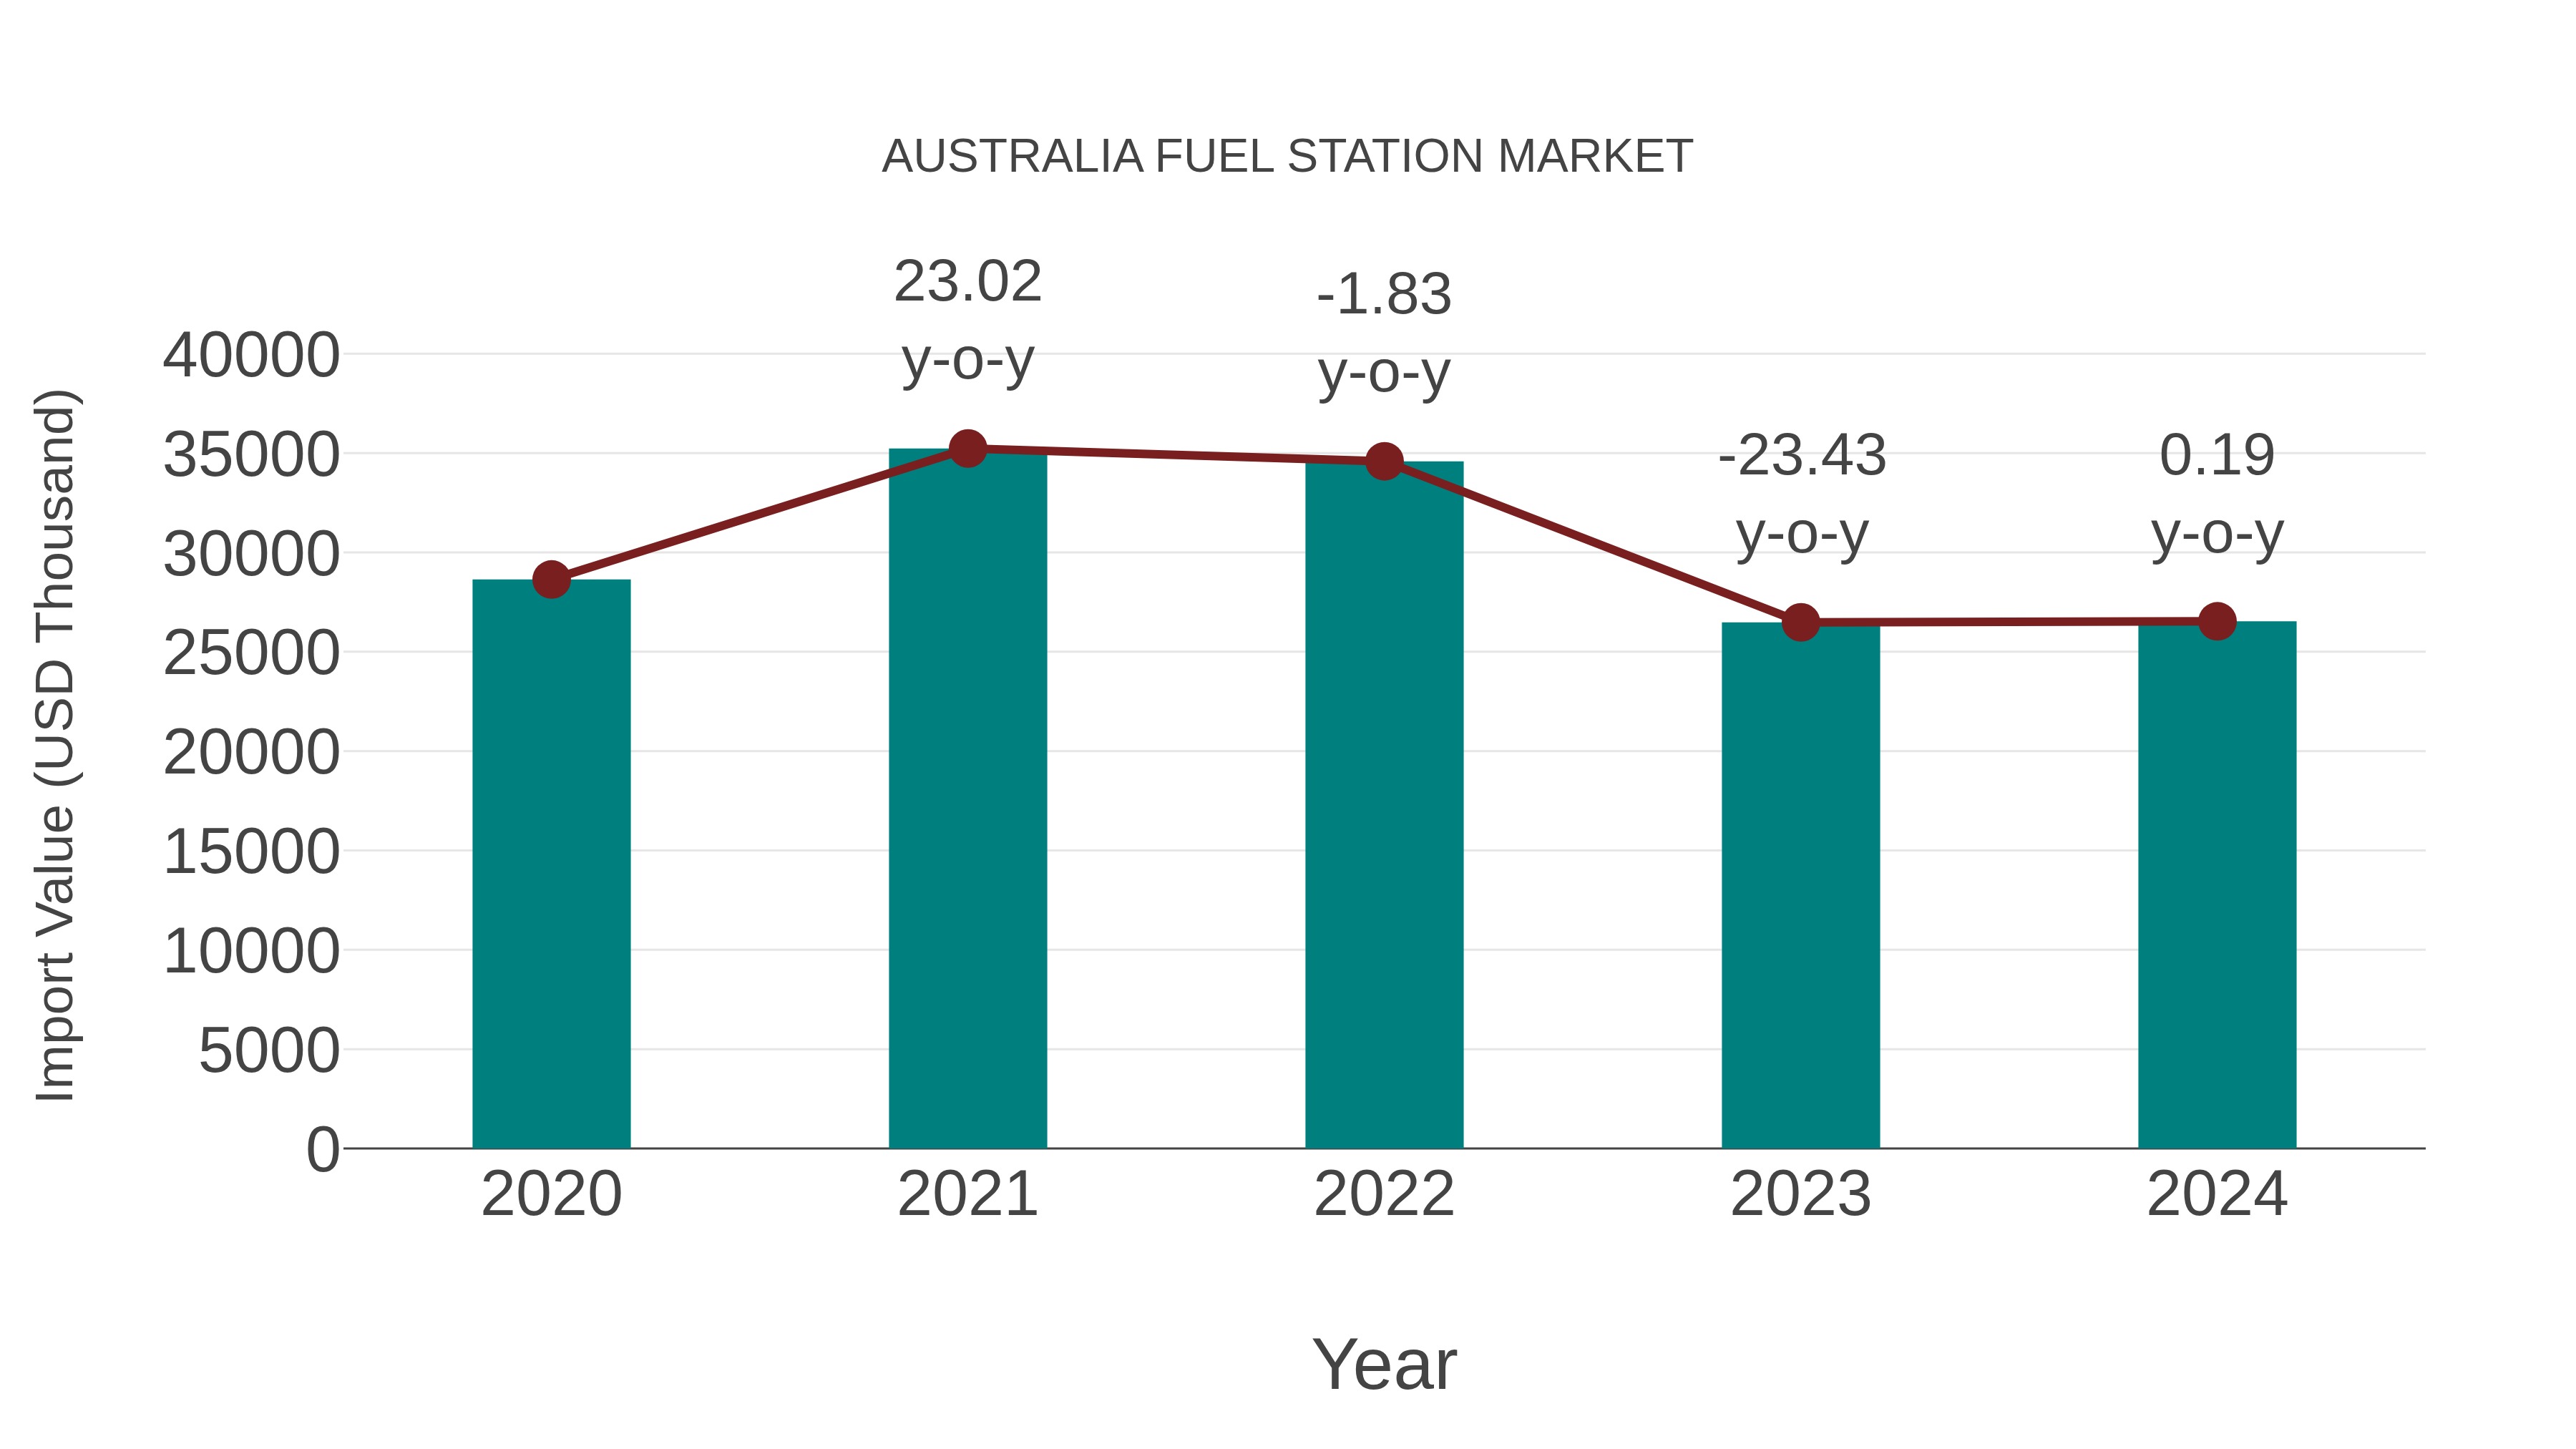
Australia Fuel Station Market: Import Trend Analysis
In the Australia fuel station market, the import trend exhibited a slight growth from 2023 to 2024, with a growth rate of 0.19%. However, the compound annual growth rate (CAGR) for imports from 2020 to 2024 was -1.89%. This decline in CAGR could be attributed to shifts in demand patterns or changes in trade policies impacting market stability.
Australia Fuel Station Market Growth Rate
According to 6Wresearch internal database and industry insights,
Topics Covered in the Australia Fuel Station Market Report
The Australia Fuel Station Market report thoroughly covers the market by fuel and end-user. The report provides a detailed analysis of ongoing market trends, opportunities/high-growth areas, and market drivers that will help stakeholders align strategies based on current and future market dynamics.
Russia Smartphone Market Highlights
| Report Name | Australia Fuel Station Market |
| Forecast Period | 2026–2032 |
| CAGR | 3.6% |
| Growing Sector | Road Transport and Retail Convenience |
Australia Fuel Station Market Synopsis
Australia Fuel Station Market is projected to attain steady expansion in the coming years on the back of a major transition from traditional refueling stops to multi-service energy and retail destinations. Apart from this, the growth is being propelled by the "Future Fuels and Vehicles Strategy" and the National Highway Upgrade Program, which have modernized the infrastructure along major corridors like the Pacific and Bruce Highways. Besides, the modernization of regional roadhouse networks has created high-dwell-time environments, making fuel stations a favored choice for logistics fleets and travelers seeking premium food and electric vehicle (EV) charging facilities.
Evaluation of Growth Drivers in the Australia Fuel Station Market
Below are some prominent drivers and their influence on the market dynamics:
| Drivers | Primary Segments Affected | Why It Matters |
| Net Zero Transit | By Fuel (Electric/Gas) | Government backing for hydrogen and EV charging at stations creates new revenue streams. |
| Convenience Retail | By End-User (Road Transport) | Non-fuel sales (coffee/meals) now account for a significant portion of station profitability. |
| Logistics Demand | By Fuel (Diesel) | Heavy dependence on road freight ensures consistent demand for high-flow diesel assets. |
| Digital Payments | By Application (Retail) | Pay-at-pump and app-based loyalty programs diminish friction and increase transaction volume. |
| Infrastructure Grants | By Application (Regional) | Federal funding for regional "Black Spot" programs improves accessibility to rural stations. |
Australia Fuel Station Market is projected to grow at a CAGR of 3.6% during the forecast period (2026-2032). Due to increasing demand for premium unleaded fuels, rising investments in EV fast-charging infrastructure, and strong demand from the heavy haulage and tourism sectors, the Australia Fuel Station Market growth is expected to maintain a steady pace. Increasing preference for "one-stop-shop" environments—combining fuel, pharmacy, and high-end dining—is accelerating adoption across metropolitan and regional sites.
Evaluation of Restraints in the Australia Fuel Station Market
Below are some prominent restraints and their influence on the market dynamics:
| Restraints | Primary Segments Affected | What This Means |
| EV Market Share | By Fuel (Gasoline) | Rapid adoption of electric vehicles gradually erodes traditional petrol volume sales. |
| Regulatory Compliance | By Application (Urban) | Firm environmental and safety standards for underground tank storage increase CAPEX. |
| Cost of Living | By End-User (Road Transport) | High inflation leads consumers to cut back on non-essential impulse purchases at stations. |
| Price Volatility | By Fuel (Diesel/Gasoline) | Geopolitical fluctuations in oil prices make profit margin forecasting difficult for retailers. |
| Labor Shortages | By Application (Regional) | Complications in staffing 24/7 regional roadhouses influence operational consistency. |
Australia Fuel Station Market Challenges
Australia Fuel Station Industry is expected to face significant headwinds despite its growth. The high cost of land and property in metropolitan areas like Sydney and Melbourne acts as a major barrier for independent players compared to established giants like Ampol or Viva Energy. In addition, regulatory inconsistencies across different Australian states about fuel price reporting (e.g., WA’s FuelWatch vs. NSW’s FuelCheck) often lead to compliance complexities. Also, there is a lack of localized EV charging standardization across different networks, which makes some station owners hesitant to invest heavily in charging hardware before a clear market leader emerges in the technology space.
Australia Fuel Station Market Trends
There are various emerging trends shaping the landscape of the Australia Fuel Station Market:
- Evolution of "Gourmet" Convenience: Developments such as 'gourmet' convenience with fuel stations partnering with great food companies like Woolworths Metro through Ampol or OTR via Viva, providing fresh and great quality meals rather than meat pies.
- Decarbonized Heavy Transport: Growing demand for hydrogen refuelling stations on major freight logistics networks to complement the Australian government’s strategy for achieving emission reductions from heavy trucks.
- Integration of Smart Loyalty Ecosystems: Using geofencing and mobile apps creates an opportunity for brands to provide "fuel price locks" and target their pricing for retail products to entice consumers into fuel stations, thus increasing the retailer's margin against low margin fuel.
Investment Opportunities in the Australian Fuel Station Market
A list of key investment opportunities within the Australia Fuel Station Market includes the following:
- Regional EV Charging Hubs - Continued issues over EV range anxiety within rural Australia makes it imperative that/state governments invest in establishing high-speed charging facilities throughout rural communities, creating an early mover competitive advantage.
- Biofuels & Ethanol Blending - Increasing environmental concerns amongst both consumers and businesses represents a niche market for fuel stations to supply high-performance E85 or biodiesel blends to eco-conscious commercial fleets.
- Automated Retail/Dark Stores - Potential to use fuel station properties, especially prime locations in shopping districts, to serve as “last mile” delivery centres utilising emerging technologies enabling these retail stores to process customer orders online and fulfil them using established fuel station infrastructure.
Top 5 Leading Players in the Australia Fuel Station Market
Below is a list of prominent companies leading the Australia Fuel Station Market:
1. Ampol Limited
| Company Name | Ampol Limited |
|---|---|
| Established Year | 1936 |
| Headquarters | Sydney, New South Wales |
| Official Website | Click Here |
Australia’s largest fuel refiner and retailer, currently undergoing a massive rebranding and site modernization program focused on premium "AmpCharge" EV hubs and Foodary retail outlets.
2. Viva Energy Group (Shell Licensee)
| Company Name | Viva Energy Group (Shell Licensee) |
|---|---|
| Established Year | 2014 (Acquired Shell's Australian downstream) |
| Headquarters | Melbourne, Victoria |
| Official Website | Click Here |
A major energy company that operates the Shell-branded network and owns the Geelong Refinery; it has recently expanded into the convenience sector with the acquisition of the OTR Group.
3. BP Australia
| Company Name | BP Australia |
|---|---|
| Established Year | 1920 |
| Headquarters | Melbourne, Victoria |
| Official Website | Click Here |
A global leader with a strong Australian presence, BP is heavily investing in "BP Pulse" charging networks and high-quality convenience partnerships with David Jones Food.
4. 7-Eleven Australia
| Company Name | 7-Eleven Australia |
|---|---|
| Established Year | 1977 |
| Headquarters | Melbourne, Victoria |
| Official Website | Click Here |
Now owned by 7-Eleven International, this company is a leader in the fuel-convenience crossover, known for its "Fuel Price Lock" app and dominant presence in urban residential zones.
5. United Petroleum
| Company Name | United Petroleum |
|---|---|
| Established Year | 1993 |
| Headquarters | Melbourne, Victoria |
| Official Website | Click Here |
An independent, Australian-owned petrol and convenience company specializing in competitive fuel pricing and the distribution of Ethanol-based fuels across a nationwide network.
Government Regulations in the Australia Fuel Station Market
According to Australian Government Data, they have played a crucial role through initiatives like the National Electric Vehicle Strategy (2023), which provides funding for a national long-distance charging network. Apart from this, the Victorian Government’s Fair Fuel Plan is a prime example of state-level intervention, mandating real-time price reporting to ensure transparency for motorists. Besides this, the ACCC (Australian Competition and Consumer Commission) actively monitors the fuel industry to prevent anti-competitive pricing, ensuring that retailers pass on international crude oil price drops to the Australian public in a timely manner.
Future Insights of the Australia Fuel Station Market
The Australia Fuel Station Market is anticipated to set to witness firm growth, driven by the expansion of Hydrogen highways, which will enable zero-emission long-haul trucking. The future will experience a convergence of fuel stations and smart-grid technology, where stations act as decentralized energy storage sites during peak demand. As the government continues to push for sustainable transport, the market will likely adopt standardized "Carbon Neutral Station" certifications, favoring players who utilize 100% renewable energy for their site operations and retail refrigeration.
Market Segmentation Analysis
The report offers a comprehensive study of the following market segments and their leading categories:
By Fuel – Gasoline to Lead the Market
According to Parth, Senior Research Analyst, 6Wresearch, Gasoline segment is anticipated to lead the Australia Fuel Station Market share currently, as it remains the primary fuel source for Australia's massive fleet of passenger vehicles. Despite the rise of EVs, the existing internal combustion engine (ICE) car parc ensures a dominant revenue share for unleaded 91, 95, and 98 fuels. The increasing demand for premium high-octane fuels for modern turbocharged engines further bolsters this segment’s value.
Key Attractiveness of the Report
- 10 Years of Market Numbers
- Historical Data Starting from 2022 to 2025
- Base Year: 2025
- Forecast Data until 2032
- Key Performance Indicators Impacting the Market
- Major Upcoming Developments and Projects
Key Highlights of the Report:
- Australia Fuel Station Market Outlook
- Market Size of Australia Fuel Station Market, 2025
- Forecast of Australia Fuel Station Market, 2032
- Historical Data and Forecast of Australia Fuel Station Revenues & Volume for the Period 2022-2032F
- Australia Fuel Station Market Trend Evolution
- Australia Fuel Station Market Drivers and Challenges
- Australia Fuel Station Price Trends
- Australia Fuel Station Porter's Five Forces
- Australia Fuel Station Industry Life Cycle
- Historical Data and Forecast of Australia Fuel Station Market Revenues & Volume By Fuel for the Period 2022-2032F
- Historical Data and Forecast of Australia Fuel Station Market Revenues & Volume By Gasoline for the Period 2022-2032F
- Historical Data and Forecast of Australia Fuel Station Market Revenues & Volume By Diesel for the Period 2022-2032F
- Historical Data and Forecast of Australia Fuel Station Market Revenues & Volume By Gas for the Period 2022-2032F
- Historical Data and Forecast of Australia Fuel Station Market Revenues & Volume By others for the Period 2022-2032F
- Historical Data and Forecast of Australia Fuel Station Market Revenues & Volume By End-User for the Period 2022-2032F
- Historical Data and Forecast of Australia Fuel Station Market Revenues & Volume By Road Transport Vehicles for the Period 2022-2032F
- Historical Data and Forecast of Australia Fuel Station Market Revenues & Volume By Air Transport Vehicles for the Period 2022-2032F
- Historical Data and Forecast of Australia Fuel Station Market Revenues & Volume By Water Transport Vehicles for the Period 2022-2032F
- Australia Fuel Station Import Export Trade Statistics
- Market Opportunity Assessment By Fuel
- Market Opportunity Assessment By End-User
- Australia Fuel Station Top Companies Market Share
- Australia Fuel Station Competitive Benchmarking By Technical and Operational Parameters
- Australia Fuel Station Company Profiles
- Australia Fuel Station Key Strategic Recommendations
Markets Covered
The report provides a detailed analysis of the following market segments:
By Fuel
- Gasoline
- Diesel
- Gas
- Others
By End-User
- Road Transport Vehicles
- Air Transport Vehicles
- Water Transport Vehicles
Australia Fuel Station Market (2026-2032): FAQs
The Australia Fuel Station Market is projected to grow at a CAGR of 3.6% during the forecast period 2026–2032.
Leading companies include Ampol Limited, Viva Energy (Shell), BP Australia, 7-Eleven, and United Petroleum.
Some latest trends are the transformation of electric vehicle charging infrastructure, integrated convenience stores, and innovations in fuel delivery technology.
Key drivers are increasing vehicle ownership, rising fuel consumption, and advancements in refueling technology.
6Wresearch actively monitors the Australia Fuel Station Market and publishes its comprehensive annual report, highlighting emerging trends, growth drivers, revenue analysis, and forecast outlook. Our insights help businesses to make data-backed strategic decisions with ongoing market dynamics. Our analysts track relevent industries related to the Australia Fuel Station Market, allowing our clients with actionable intelligence and reliable forecasts tailored to emerging regional needs.
Yes, we provide customisation as per your requirements. To learn more, feel free to contact us on sales@6wresearch.com
| 1 Executive Summary |
| 2 Introduction |
| 2.1 Key Highlights of the Report |
| 2.2 Report Description |
| 2.3 Market Scope & Segmentation |
| 2.4 Research Methodology |
| 2.5 Assumptions |
| 3 Australia Fuel Station Market Overview |
| 3.1 Australia Country Macro Economic Indicators |
| 3.2 Australia Fuel Station Market Revenues & Volume, 2022 & 2032F |
| 3.3 Australia Fuel Station Market - Industry Life Cycle |
| 3.4 Australia Fuel Station Market - Porter's Five Forces |
| 3.5 Australia Fuel Station Market Revenues & Volume Share, By Fuel, 2022 & 2032F |
| 3.6 Australia Fuel Station Market Revenues & Volume Share, By End-User, 2022 & 2032F |
| 4 Australia Fuel Station Market Dynamics |
| 4.1 Impact Analysis |
| 4.2 Market Drivers |
| 4.2.1 Increasing demand for convenience and on-the-go services |
| 4.2.2 Growing vehicle ownership and usage leading to higher fuel consumption |
| 4.2.3 Expansion of urban areas and infrastructure development increasing the need for fuel stations |
| 4.3 Market Restraints |
| 4.3.1 Regulatory challenges and compliance requirements impacting operations and expansion |
| 4.3.2 Fluctuating oil prices affecting profit margins and pricing strategies |
| 5 Australia Fuel Station Market Trends |
| 6 Australia Fuel Station Market, By Types |
| 6.1 Australia Fuel Station Market, By Fuel |
| 6.1.1 Overview and Analysis |
| 6.1.2 Australia Fuel Station Market Revenues & Volume, By Fuel, 2022-2032F |
| 6.1.3 Australia Fuel Station Market Revenues & Volume, By Gasoline, 2022-2032F |
| 6.1.4 Australia Fuel Station Market Revenues & Volume, By Diesel, 2022-2032F |
| 6.1.5 Australia Fuel Station Market Revenues & Volume, By Gas, 2022-2032F |
| 6.1.6 Australia Fuel Station Market Revenues & Volume, By others, 2022-2032F |
| 6.2 Australia Fuel Station Market, By End-User |
| 6.2.1 Overview and Analysis |
| 6.2.2 Australia Fuel Station Market Revenues & Volume, By Road Transport Vehicles, 2022-2032F |
| 6.2.3 Australia Fuel Station Market Revenues & Volume, By Air Transport Vehicles, 2022-2032F |
| 6.2.4 Australia Fuel Station Market Revenues & Volume, By Water Transport Vehicles, 2022-2032F |
| 7 Australia Fuel Station Market Import-Export Trade Statistics |
| 7.1 Australia Fuel Station Market Export to Major Countries |
| 7.2 Australia Fuel Station Market Imports from Major Countries |
| 8 Australia Fuel Station Market Key Performance Indicators |
8.1 Average transaction value per customer |
8.2 Number of loyalty program sign-ups |
8.3 Average time spent at the fuel station |
8.4 Percentage of revenue from non-fuel products and services |
8.5 Customer satisfaction scores |
| 9 Australia Fuel Station Market - Opportunity Assessment |
| 9.1 Australia Fuel Station Market Opportunity Assessment, By Fuel, 2022 & 2032F |
| 9.2 Australia Fuel Station Market Opportunity Assessment, By End-User, 2022 & 2032F |
| 10 Australia Fuel Station Market - Competitive Landscape |
| 10.1 Australia Fuel Station Market Revenue Share, By Companies, 2025 |
| 10.2 Australia Fuel Station Market Competitive Benchmarking, By Operating and Technical Parameters |
| 11 Company Profiles |
| 12 Recommendations |
| 13 Disclaimer |
Export potential assessment - trade Analytics for 2030
Export potential enables firms to identify high-growth global markets with greater confidence by combining advanced trade intelligence with a structured quantitative methodology. The framework analyzes emerging demand trends and country-level import patterns while integrating macroeconomic and trade datasets such as GDP and population forecasts, bilateral import–export flows, tariff structures, elasticity differentials between developed and developing economies, geographic distance, and import demand projections. Using weighted trade values from 2020–2024 as the base period to project country-to-country export potential for 2030, these inputs are operationalized through calculated drivers such as gravity model parameters, tariff impact factors, and projected GDP per-capita growth. Through an analysis of hidden potentials, demand hotspots, and market conditions that are most favorable to success, this method enables firms to focus on target countries, maximize returns, and global expansion with data, backed by accuracy.
By factoring in the projected importer demand gap that is currently unmet and could be potential opportunity, it identifies the potential for the Exporter (Country) among 190 countries, against the general trade analysis, which identifies the biggest importer or exporter.
To discover high-growth global markets and optimize your business strategy:
Click Here
Pricing
- Single User License$ 1,995
- Department License$ 2,400
- Site License$ 3,120
- Global License$ 3,795

Search
Thought Leadership and Analyst Meet


Our Clients
Latest Reports
- United Kingdom (UK) Long-term Care Insurance Market (2026-2032) | Growth, Share, Consumer Insights, Drivers, Opportunities, Competition, Pricing Analysis, Segments, Restraints, Companies, Competitive, Value, Outlook, Size, Demand, Analysis, Challenges, Strategic Insights, Investment Trends, Revenue, Trends, Supply, Forecast
- United Kingdom (UK) Long Term Care Market (2026-2032) | Companies, Outlook, Analysis, Trends, Value, Revenue, Segmentation, Share, Forecast, Competitive Landscape, Growth, Size & Forecast
- Iraq Insulation and Waterproofing Market (2026-2032) | Outlook, Drivers, Growth, Size, Share, Industry, Revenue, Trends, Demand, Competitive, Strategic Insights, Opportunities, Segments, Companies, Challenges, Strategy, Consumer Insights, Analysis, Investment Trends, Value, Segmentation, Forecast, Restraints
- India Switchgear Market Outlook (2026-2032) | Size, Share, Trends, Growth, Revenue, Forecast, Analysis, Value, Outlook
- Pakistan Contraceptive Implants Market (2025-2031) | Demand, Growth, Size, Share, Industry, Pricing Analysis, Competitive, Strategic Insights, Strategy, Consumer Insights, Analysis, Investment Trends, Opportunities, Revenue, Segments, Value, Segmentation, Supply, Forecast, Restraints, Outlook, Competition, Drivers, Trends, Companies, Challenges
- Sri Lanka Packaging Market (2026-2032) | Outlook, Competition, Drivers, Trends, Demand, Pricing Analysis, Competitive, Strategic Insights, Companies, Challenges, Strategy, Consumer Insights, Analysis, Investment Trends, Opportunities, Growth, Size, Share, Industry, Revenue, Segments, Value, Segmentation, Supply, Forecast, Restraints
- India Kids Watches Market (2026-2032) | Strategy, Consumer Insights, Analysis, Investment Trends, Opportunities, Growth, Size, Share, Industry, Revenue, Segments, Value, Segmentation, Supply, Forecast, Restraints, Outlook, Competition, Drivers, Trends, Demand, Pricing Analysis, Competitive, Strategic Insights, Companies, Challenges
- Saudi Arabia Core Assurance Service Market (2025-2031) | Strategy, Consumer Insights, Analysis, Investment Trends, Opportunities, Growth, Size, Share, Industry, Revenue, Segments, Value, Segmentation, Supply, Forecast, Restraints, Outlook, Competition, Drivers, Trends, Demand, Pricing Analysis, Competitive, Strategic Insights, Companies, Challenges
- Romania Uninterruptible Power Supply (UPS) Market (2026-2032) | Industry, Analysis, Revenue, Size, Forecast, Outlook, Value, Trends, Share, Growth & Companies
- Saudi Arabia Car Window Tinting Film, Paint Protection Film (PPF), and Ceramic Coating Market (2025-2031) | Strategy, Consumer Insights, Analysis, Investment Trends, Opportunities, Growth, Size, Share, Industry, Revenue, Segments, Value, Segmentation, Supply, Forecast, Restraints, Outlook, Competition, Drivers, Trends, Demand, Pricing Analysis, Competitive, Strategic Insights, Companies, Challenges
Industry Events and Analyst Meet

India EV Show 2026

EV tech India Expo 2026

Auto Tech Asia 2026

Battery Tech India 2026

Smart Production Solutions Guangzhou 2026
Whitepaper
- Middle East & Africa Commercial Security Market Click here to view more.
- Middle East & Africa Fire Safety Systems & Equipment Market Click here to view more.
- GCC Drone Market Click here to view more.
- Middle East Lighting Fixture Market Click here to view more.
- GCC Physical & Perimeter Security Market Click here to view more.
6WResearch In News
- Doha a strategic location for EV manufacturing hub: IPA Qatar
- Demand for luxury TVs surging in the GCC, says Samsung
- Empowering Growth: The Thriving Journey of Bangladesh’s Cable Industry
- Demand for luxury TVs surging in the GCC, says Samsung
- Video call with a traditional healer? Once unthinkable, it’s now common in South Africa
- Intelligent Buildings To Smooth GCC’s Path To Net Zero