Australia Inorganic Fluorides Market (2026-2032) Outlook | Trends, Companies, Growth, Size, Forecast, Share, Value, Analysis, Revenue & Industry
Market Forecast By Product Type (Ammonium Hydrogen Fluoride, Calcium Fluoride, Hydrogen Fluoride, Sodium Fluoride, Sulphur Hexafluoride, Others), By End-Use Industry (Aluminum Industry, Oil and Gas Industry, Pharmaceuticals, Electronics, Others) And Competitive Landscape
| Product Code: ETC210707 | Publication Date: May 2022 | Updated Date: Mar 2026 | Product Type: Market Research Report | |
| Publisher: 6Wresearch | Author: Ravi Bhandari | No. of Pages: 60 | No. of Figures: 40 | No. of Tables: 7 |
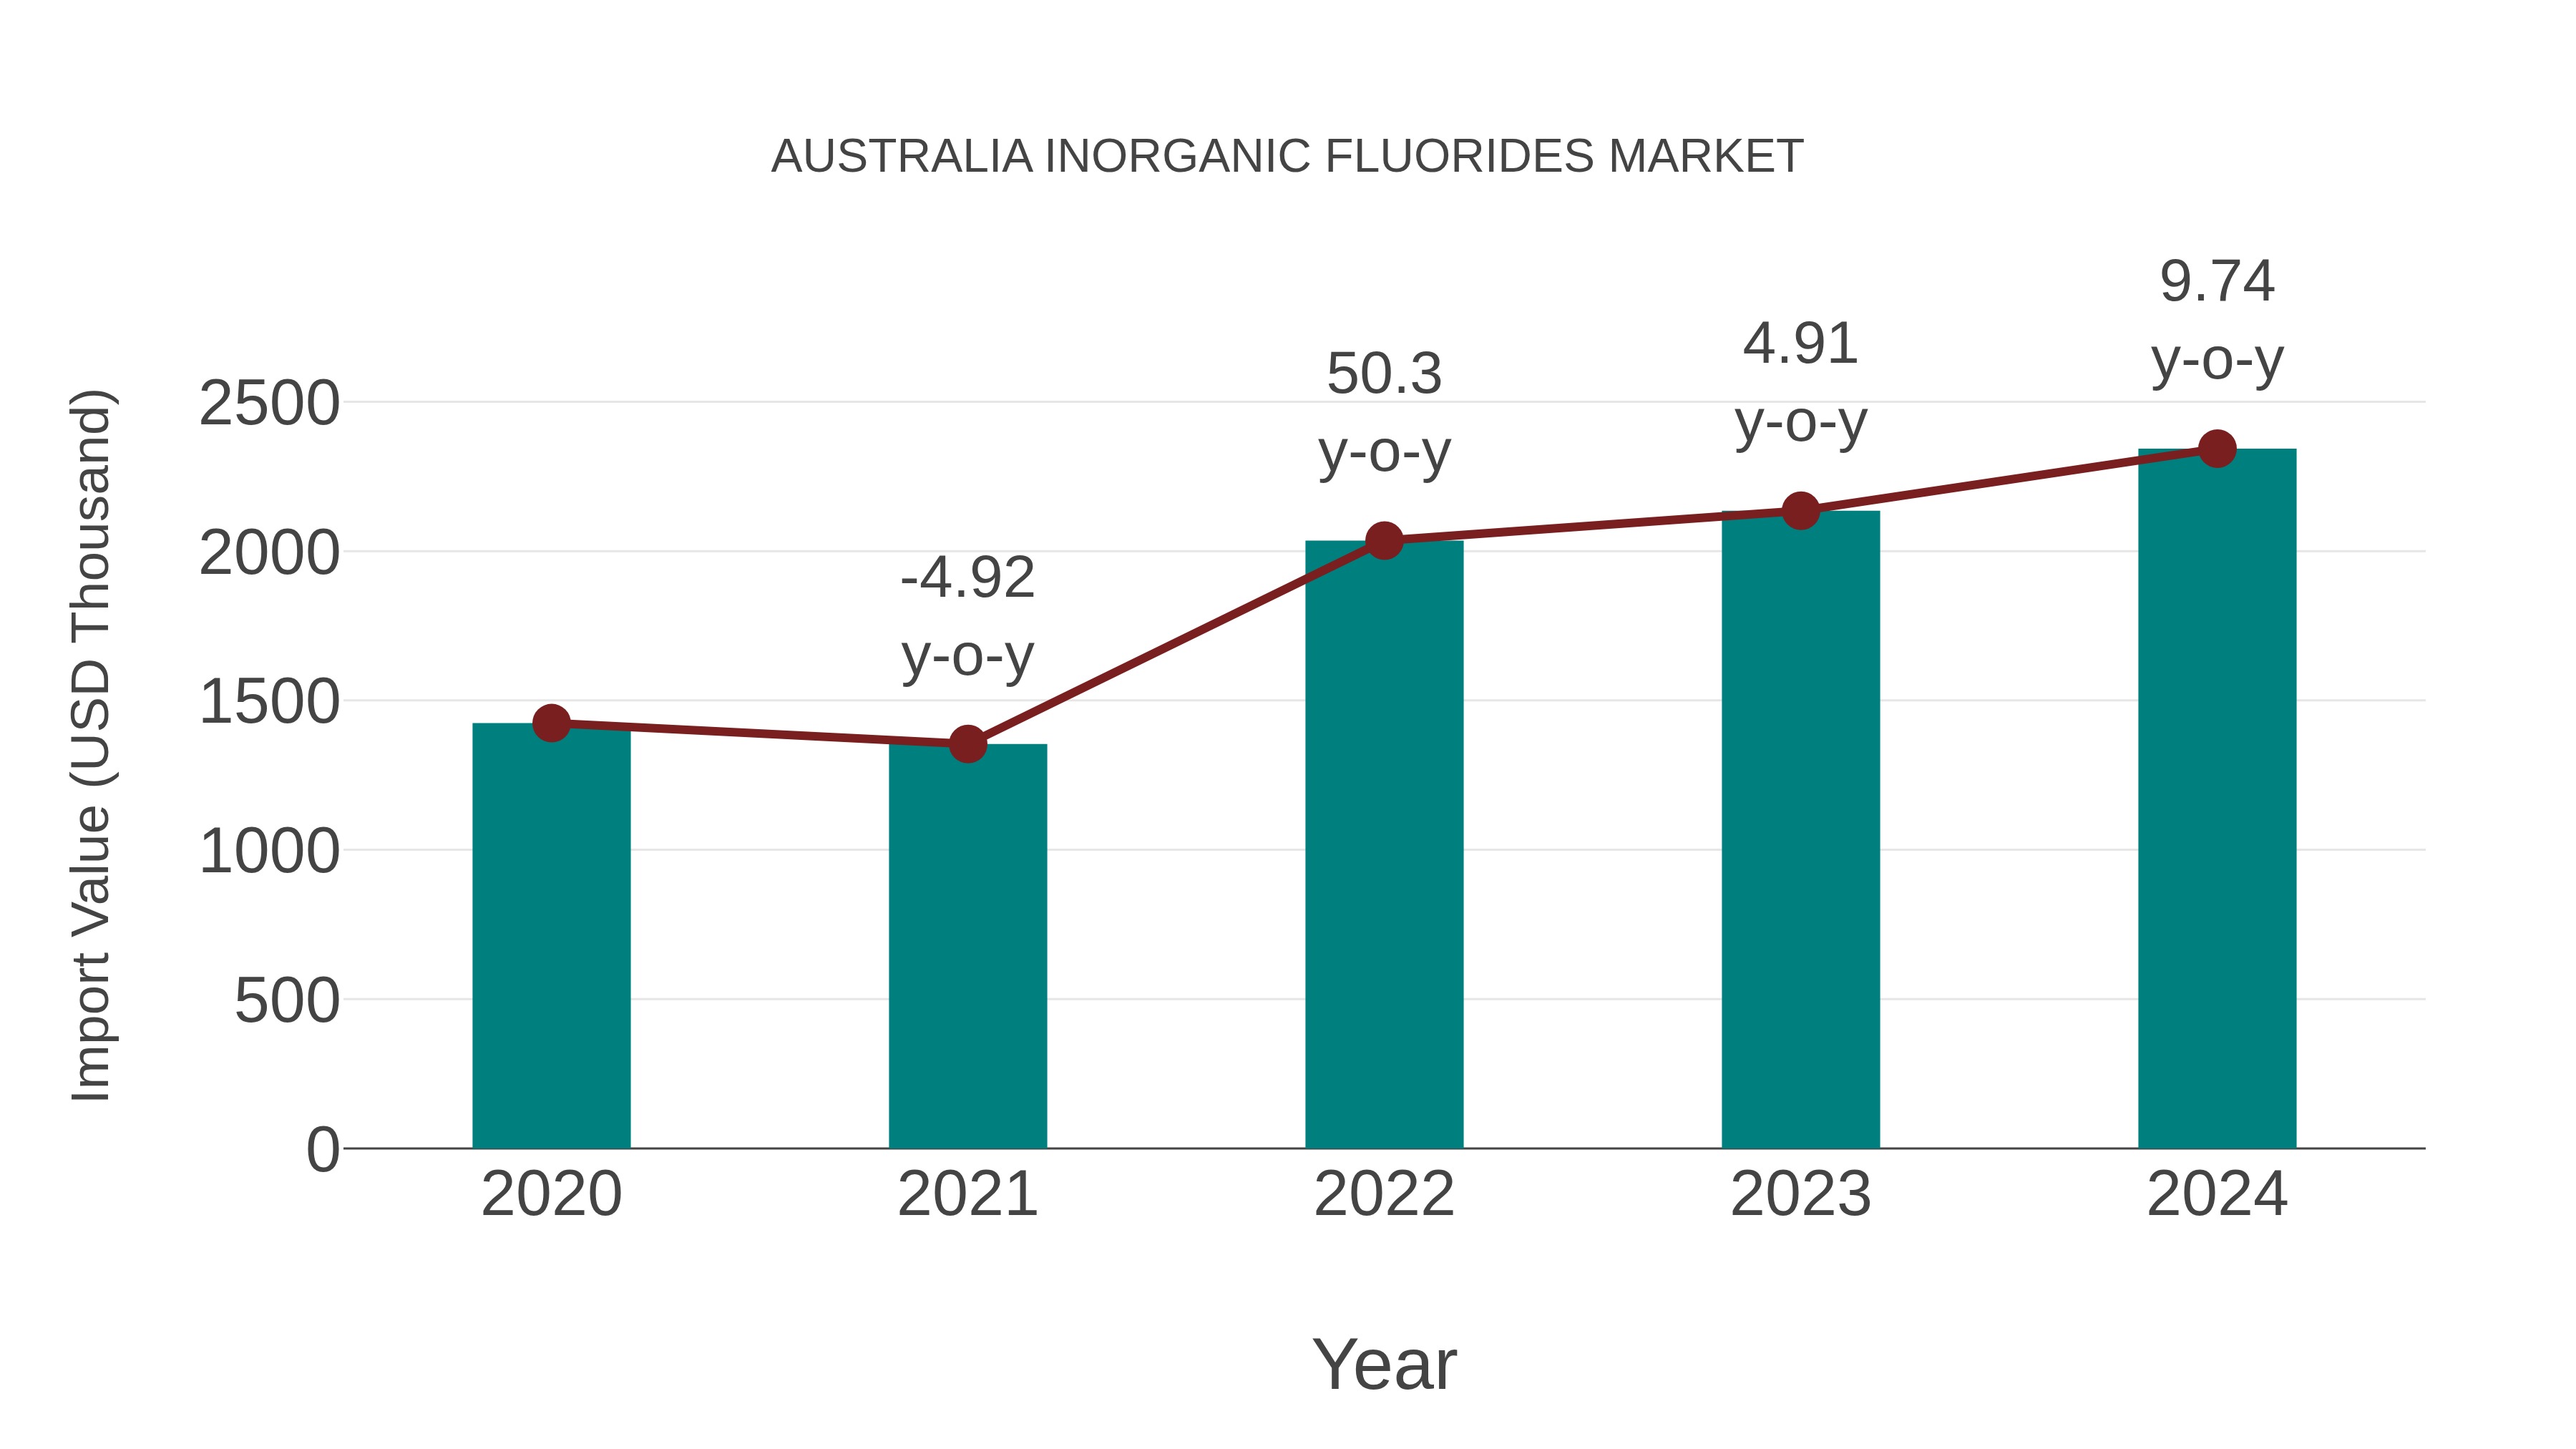
Australia Inorganic Fluorides Market: Import Trend Analysis
Australia`s import trend for inorganic fluorides in 2024 exhibited a growth rate of 9.74% compared to the previous year, with a compound annual growth rate (CAGR) of 13.26% from 2020 to 2024. This growth can be attributed to a steady import momentum driven by increasing industrial demand for fluorides in various sectors.
Australia Inorganic Fluorides Market Overview
Australia inorganic fluorides market is witnessing growth driven by demand from industries such as metallurgy, glass manufacturing, and electronics. Inorganic fluorides are essential materials used in various applications including fluxes, catalysts, and chemical synthesis.
Drivers of the market
The Australia Inorganic Fluorides market experiences significant growth driven by the demand for fluorine-based chemicals in various industrial applications. With the increasing use of fluorides in sectors such as aluminum production, chemical manufacturing, and pharmaceuticals, there is a rising requirement for high-purity fluoride compounds that offer specific functionalities and properties. Moreover, the expansion of electronics manufacturing and the semiconductor industry further stimulate market expansion. Additionally, the growing emphasis on environmental regulations and safety standards influences the adoption of fluorine compounds with minimal environmental impact.
Challenges of the market
Challenges in the inorganic fluorides market include toxicity concerns, regulatory compliance, and technological advancements. Manufacturers must develop fluorides that meet industrial demands for applications such as aluminum production, fluoridation of drinking water, and pharmaceutical synthesis while addressing health and environmental risks associated with fluoride exposure.
Government Policy of the market
Government policies in the inorganic fluorides market may prioritize environmental protection, public health, and industrial applications. Regulations may be implemented to ensure that inorganic fluorides meet safety standards for handling, storage, and disposal. Additionally, environmental regulations may govern the emissions and wastewater discharges of fluoride-producing industries to prevent pollution and minimize environmental impact. Furthermore, government initiatives may support research and development in fluoride alternatives and waste treatment technologies to promote sustainability in fluoride production and usage.
Key Highlights of the Report:
- Australia Inorganic Fluorides Market Outlook
- Market Size of Australia Inorganic Fluorides Market, 2025
- Forecast of Australia Inorganic Fluorides Market, 2032
- Historical Data and Forecast of Australia Inorganic Fluorides Revenues & Volume for the Period 2022-2032F
- Australia Inorganic Fluorides Market Trend Evolution
- Australia Inorganic Fluorides Market Drivers and Challenges
- Australia Inorganic Fluorides Price Trends
- Australia Inorganic Fluorides Porter's Five Forces
- Australia Inorganic Fluorides Industry Life Cycle
- Historical Data and Forecast of Australia Inorganic Fluorides Market Revenues & Volume By Product Type for the Period 2022-2032F
- Historical Data and Forecast of Australia Inorganic Fluorides Market Revenues & Volume By Ammonium Hydrogen Fluoride for the Period 2022-2032F
- Historical Data and Forecast of Australia Inorganic Fluorides Market Revenues & Volume By Calcium Fluoride for the Period 2022-2032F
- Historical Data and Forecast of Australia Inorganic Fluorides Market Revenues & Volume By Hydrogen Fluoride for the Period 2022-2032F
- Historical Data and Forecast of Australia Inorganic Fluorides Market Revenues & Volume By Sodium Fluoride for the Period 2022-2032F
- Historical Data and Forecast of Australia Inorganic Fluorides Market Revenues & Volume By Sulphur Hexafluoride for the Period 2022-2032F
- Historical Data and Forecast of Australia Inorganic Fluorides Market Revenues & Volume By Others for the Period 2022-2032F
- Historical Data and Forecast of Australia Inorganic Fluorides Market Revenues & Volume By End-Use Industry for the Period 2022-2032F
- Historical Data and Forecast of Australia Inorganic Fluorides Market Revenues & Volume By Aluminum Industry for the Period 2022-2032F
- Historical Data and Forecast of Australia Inorganic Fluorides Market Revenues & Volume By Oil and Gas Industry for the Period 2022-2032F
- Historical Data and Forecast of Australia Inorganic Fluorides Market Revenues & Volume By Pharmaceuticals for the Period 2022-2032F
- Historical Data and Forecast of Australia Inorganic Fluorides Market Revenues & Volume By Electronics for the Period 2022-2032F
- Historical Data and Forecast of Australia Inorganic Fluorides Market Revenues & Volume By Others for the Period 2022-2032F
- Australia Inorganic Fluorides Import Export Trade Statistics
- Market Opportunity Assessment By Product Type
- Market Opportunity Assessment By End-Use Industry
- Australia Inorganic Fluorides Top Companies Market Share
- Australia Inorganic Fluorides Competitive Benchmarking By Technical and Operational Parameters
- Australia Inorganic Fluorides Company Profiles
- Australia Inorganic Fluorides Key Strategic Recommendations
Australia Inorganic Fluorides Market (2026-2032): FAQs
6Wresearch actively monitors the Australia Inorganic Fluorides Market and publishes its comprehensive annual report, highlighting emerging trends, growth drivers, revenue analysis, and forecast outlook. Our insights help businesses to make data-backed strategic decisions with ongoing market dynamics. Our analysts track relevent industries related to the Australia Inorganic Fluorides Market, allowing our clients with actionable intelligence and reliable forecasts tailored to emerging regional needs.
Yes, we provide customisation as per your requirements. To learn more, feel free to contact us on sales@6wresearch.com
1 Executive Summary |
2 Introduction |
2.1 Key Highlights of the Report |
2.2 Report Description |
2.3 Market Scope & Segmentation |
2.4 Research Methodology |
2.5 Assumptions |
3 Australia Inorganic Fluorides Market Overview |
3.1 Australia Country Macro Economic Indicators |
3.2 Australia Inorganic Fluorides Market Revenues & Volume, 2022 & 2032F |
3.3 Australia Inorganic Fluorides Market - Industry Life Cycle |
3.4 Australia Inorganic Fluorides Market - Porter's Five Forces |
3.5 Australia Inorganic Fluorides Market Revenues & Volume Share, By Product Type, 2022 & 2032F |
3.6 Australia Inorganic Fluorides Market Revenues & Volume Share, By End-Use Industry, 2022 & 2032F |
4 Australia Inorganic Fluorides Market Dynamics |
4.1 Impact Analysis |
4.2 Market Drivers |
4.2.1 Increasing demand for inorganic fluorides in industries such as electronics, metallurgy, and pharmaceuticals |
4.2.2 Growing investments in research and development to enhance the applications of inorganic fluorides |
4.2.3 Stringent environmental regulations driving the adoption of eco-friendly inorganic fluoride products |
4.3 Market Restraints |
4.3.1 Fluctuating prices of raw materials such as fluorite and hydrofluoric acid impacting the cost of production |
4.3.2 Health and environmental concerns associated with the use of certain inorganic fluorides |
4.3.3 Competition from substitute products like organic fluorides affecting market growth |
5 Australia Inorganic Fluorides Market Trends |
6 Australia Inorganic Fluorides Market, By Types |
6.1 Australia Inorganic Fluorides Market, By Product Type |
6.1.1 Overview and Analysis |
6.1.2 Australia Inorganic Fluorides Market Revenues & Volume, By Product Type, 2022-2032F |
6.1.3 Australia Inorganic Fluorides Market Revenues & Volume, By Ammonium Hydrogen Fluoride, 2022-2032F |
6.1.4 Australia Inorganic Fluorides Market Revenues & Volume, By Calcium Fluoride, 2022-2032F |
6.1.5 Australia Inorganic Fluorides Market Revenues & Volume, By Hydrogen Fluoride, 2022-2032F |
6.1.6 Australia Inorganic Fluorides Market Revenues & Volume, By Sodium Fluoride, 2022-2032F |
6.1.7 Australia Inorganic Fluorides Market Revenues & Volume, By Sulphur Hexafluoride, 2022-2032F |
6.1.8 Australia Inorganic Fluorides Market Revenues & Volume, By Others, 2022-2032F |
6.2 Australia Inorganic Fluorides Market, By End-Use Industry |
6.2.1 Overview and Analysis |
6.2.2 Australia Inorganic Fluorides Market Revenues & Volume, By Aluminum Industry, 2022-2032F |
6.2.3 Australia Inorganic Fluorides Market Revenues & Volume, By Oil and Gas Industry, 2022-2032F |
6.2.4 Australia Inorganic Fluorides Market Revenues & Volume, By Pharmaceuticals, 2022-2032F |
6.2.5 Australia Inorganic Fluorides Market Revenues & Volume, By Electronics, 2022-2032F |
6.2.6 Australia Inorganic Fluorides Market Revenues & Volume, By Others, 2022-2032F |
7 Australia Inorganic Fluorides Market Import-Export Trade Statistics |
7.1 Australia Inorganic Fluorides Market Export to Major Countries |
7.2 Australia Inorganic Fluorides Market Imports from Major Countries |
8 Australia Inorganic Fluorides Market Key Performance Indicators |
8.1 Number of patents filed for new applications of inorganic fluorides |
8.2 Investment in infrastructure for inorganic fluoride production and distribution |
8.3 Adoption rate of eco-friendly inorganic fluoride products |
8.4 Percentage of market share held by key players in the inorganic fluorides market |
8.5 Rate of adoption of inorganic fluorides in emerging industries |
9 Australia Inorganic Fluorides Market - Opportunity Assessment |
9.1 Australia Inorganic Fluorides Market Opportunity Assessment, By Product Type, 2022 & 2032F |
9.2 Australia Inorganic Fluorides Market Opportunity Assessment, By End-Use Industry, 2022 & 2032F |
10 Australia Inorganic Fluorides Market - Competitive Landscape |
10.1 Australia Inorganic Fluorides Market Revenue Share, By Companies, 2025 |
10.2 Australia Inorganic Fluorides Market Competitive Benchmarking, By Operating and Technical Parameters |
11 Company Profiles |
12 Recommendations |
13 Disclaimer |
Export potential assessment - trade Analytics for 2030
Export potential enables firms to identify high-growth global markets with greater confidence by combining advanced trade intelligence with a structured quantitative methodology. The framework analyzes emerging demand trends and country-level import patterns while integrating macroeconomic and trade datasets such as GDP and population forecasts, bilateral import–export flows, tariff structures, elasticity differentials between developed and developing economies, geographic distance, and import demand projections. Using weighted trade values from 2020–2024 as the base period to project country-to-country export potential for 2030, these inputs are operationalized through calculated drivers such as gravity model parameters, tariff impact factors, and projected GDP per-capita growth. Through an analysis of hidden potentials, demand hotspots, and market conditions that are most favorable to success, this method enables firms to focus on target countries, maximize returns, and global expansion with data, backed by accuracy.
By factoring in the projected importer demand gap that is currently unmet and could be potential opportunity, it identifies the potential for the Exporter (Country) among 190 countries, against the general trade analysis, which identifies the biggest importer or exporter.
To discover high-growth global markets and optimize your business strategy:
Click Here
Pricing
- Single User License$ 1,995
- Department License$ 2,400
- Site License$ 3,120
- Global License$ 3,795

Search
Thought Leadership and Analyst Meet


Our Clients
Latest Reports
- Canada Cloud CFD Market (2026-2032) | Size & Revenue, Industry, Growth, Competitive Landscape, Forecast, Segmentation, Value, Outlook, Trends, Share, Analysis, Companies
- Taiwan Food Delivery Platform Market (2026-2032) | Companies, Outlook, Analysis, Trends, Value, Revenue, Segmentation, Share, Forecast, Competitive Landscape, Growth, Size & Forecast
- United Kingdom (UK) Long-term Care Insurance Market (2026-2032) | Growth, Share, Consumer Insights, Drivers, Opportunities, Competition, Pricing Analysis, Segments, Restraints, Companies, Competitive, Value, Outlook, Size, Demand, Analysis, Challenges, Strategic Insights, Investment Trends, Revenue, Trends, Supply, Forecast
- United Kingdom (UK) Long Term Care Market (2026-2032) | Companies, Outlook, Analysis, Trends, Value, Revenue, Segmentation, Share, Forecast, Competitive Landscape, Growth, Size & Forecast
- Iraq Insulation and Waterproofing Market (2026-2032) | Outlook, Drivers, Growth, Size, Share, Industry, Revenue, Trends, Demand, Competitive, Strategic Insights, Opportunities, Segments, Companies, Challenges, Strategy, Consumer Insights, Analysis, Investment Trends, Value, Segmentation, Forecast, Restraints
- India Switchgear Market Outlook (2026-2032) | Size, Share, Trends, Growth, Revenue, Forecast, Analysis, Value, Outlook
- Pakistan Contraceptive Implants Market (2025-2031) | Demand, Growth, Size, Share, Industry, Pricing Analysis, Competitive, Strategic Insights, Strategy, Consumer Insights, Analysis, Investment Trends, Opportunities, Revenue, Segments, Value, Segmentation, Supply, Forecast, Restraints, Outlook, Competition, Drivers, Trends, Companies, Challenges
- Sri Lanka Packaging Market (2026-2032) | Outlook, Competition, Drivers, Trends, Demand, Pricing Analysis, Competitive, Strategic Insights, Companies, Challenges, Strategy, Consumer Insights, Analysis, Investment Trends, Opportunities, Growth, Size, Share, Industry, Revenue, Segments, Value, Segmentation, Supply, Forecast, Restraints
- India Kids Watches Market (2026-2032) | Strategy, Consumer Insights, Analysis, Investment Trends, Opportunities, Growth, Size, Share, Industry, Revenue, Segments, Value, Segmentation, Supply, Forecast, Restraints, Outlook, Competition, Drivers, Trends, Demand, Pricing Analysis, Competitive, Strategic Insights, Companies, Challenges
- Saudi Arabia Core Assurance Service Market (2025-2031) | Strategy, Consumer Insights, Analysis, Investment Trends, Opportunities, Growth, Size, Share, Industry, Revenue, Segments, Value, Segmentation, Supply, Forecast, Restraints, Outlook, Competition, Drivers, Trends, Demand, Pricing Analysis, Competitive, Strategic Insights, Companies, Challenges
Industry Events and Analyst Meet

India EV Show 2026

EV tech India Expo 2026

Auto Tech Asia 2026

Battery Tech India 2026

Smart Production Solutions Guangzhou 2026
Whitepaper
- Middle East & Africa Commercial Security Market Click here to view more.
- Middle East & Africa Fire Safety Systems & Equipment Market Click here to view more.
- GCC Drone Market Click here to view more.
- Middle East Lighting Fixture Market Click here to view more.
- GCC Physical & Perimeter Security Market Click here to view more.
6WResearch In News
- Doha a strategic location for EV manufacturing hub: IPA Qatar
- Demand for luxury TVs surging in the GCC, says Samsung
- Empowering Growth: The Thriving Journey of Bangladesh’s Cable Industry
- Demand for luxury TVs surging in the GCC, says Samsung
- Video call with a traditional healer? Once unthinkable, it’s now common in South Africa
- Intelligent Buildings To Smooth GCC’s Path To Net Zero