Australia Insulated electric wire & cable Market (2026-2032) | Growth, Analysis, Size, Industry, Share, Companies, Value, Outlook, Forecast, Revenue & Trends
Market Forecast By Types (Metals, Plastics, Optical Fibers), By Applications (Electrical Equipment, Construction, Telecommunications, Motor Vehicles, Industrial Machinery) And Competitive Landscape
| Product Code: ETC039316 | Publication Date: Jan 2021 | Updated Date: Jun 2026 | Product Type: Report | |
| Publisher: 6Wresearch | Author: Ravi Bhandari | No. of Pages: 70 | No. of Figures: 35 | No. of Tables: 5 |
Australia Insulated electric wire & cable Market Summary
The australia insulated electric wire & cable market was estimated at USD 147 Million in 2025 and is projected to reach USD 173 Million by 2032, growing at a CAGR of 2.6% from 2026 to 2032.
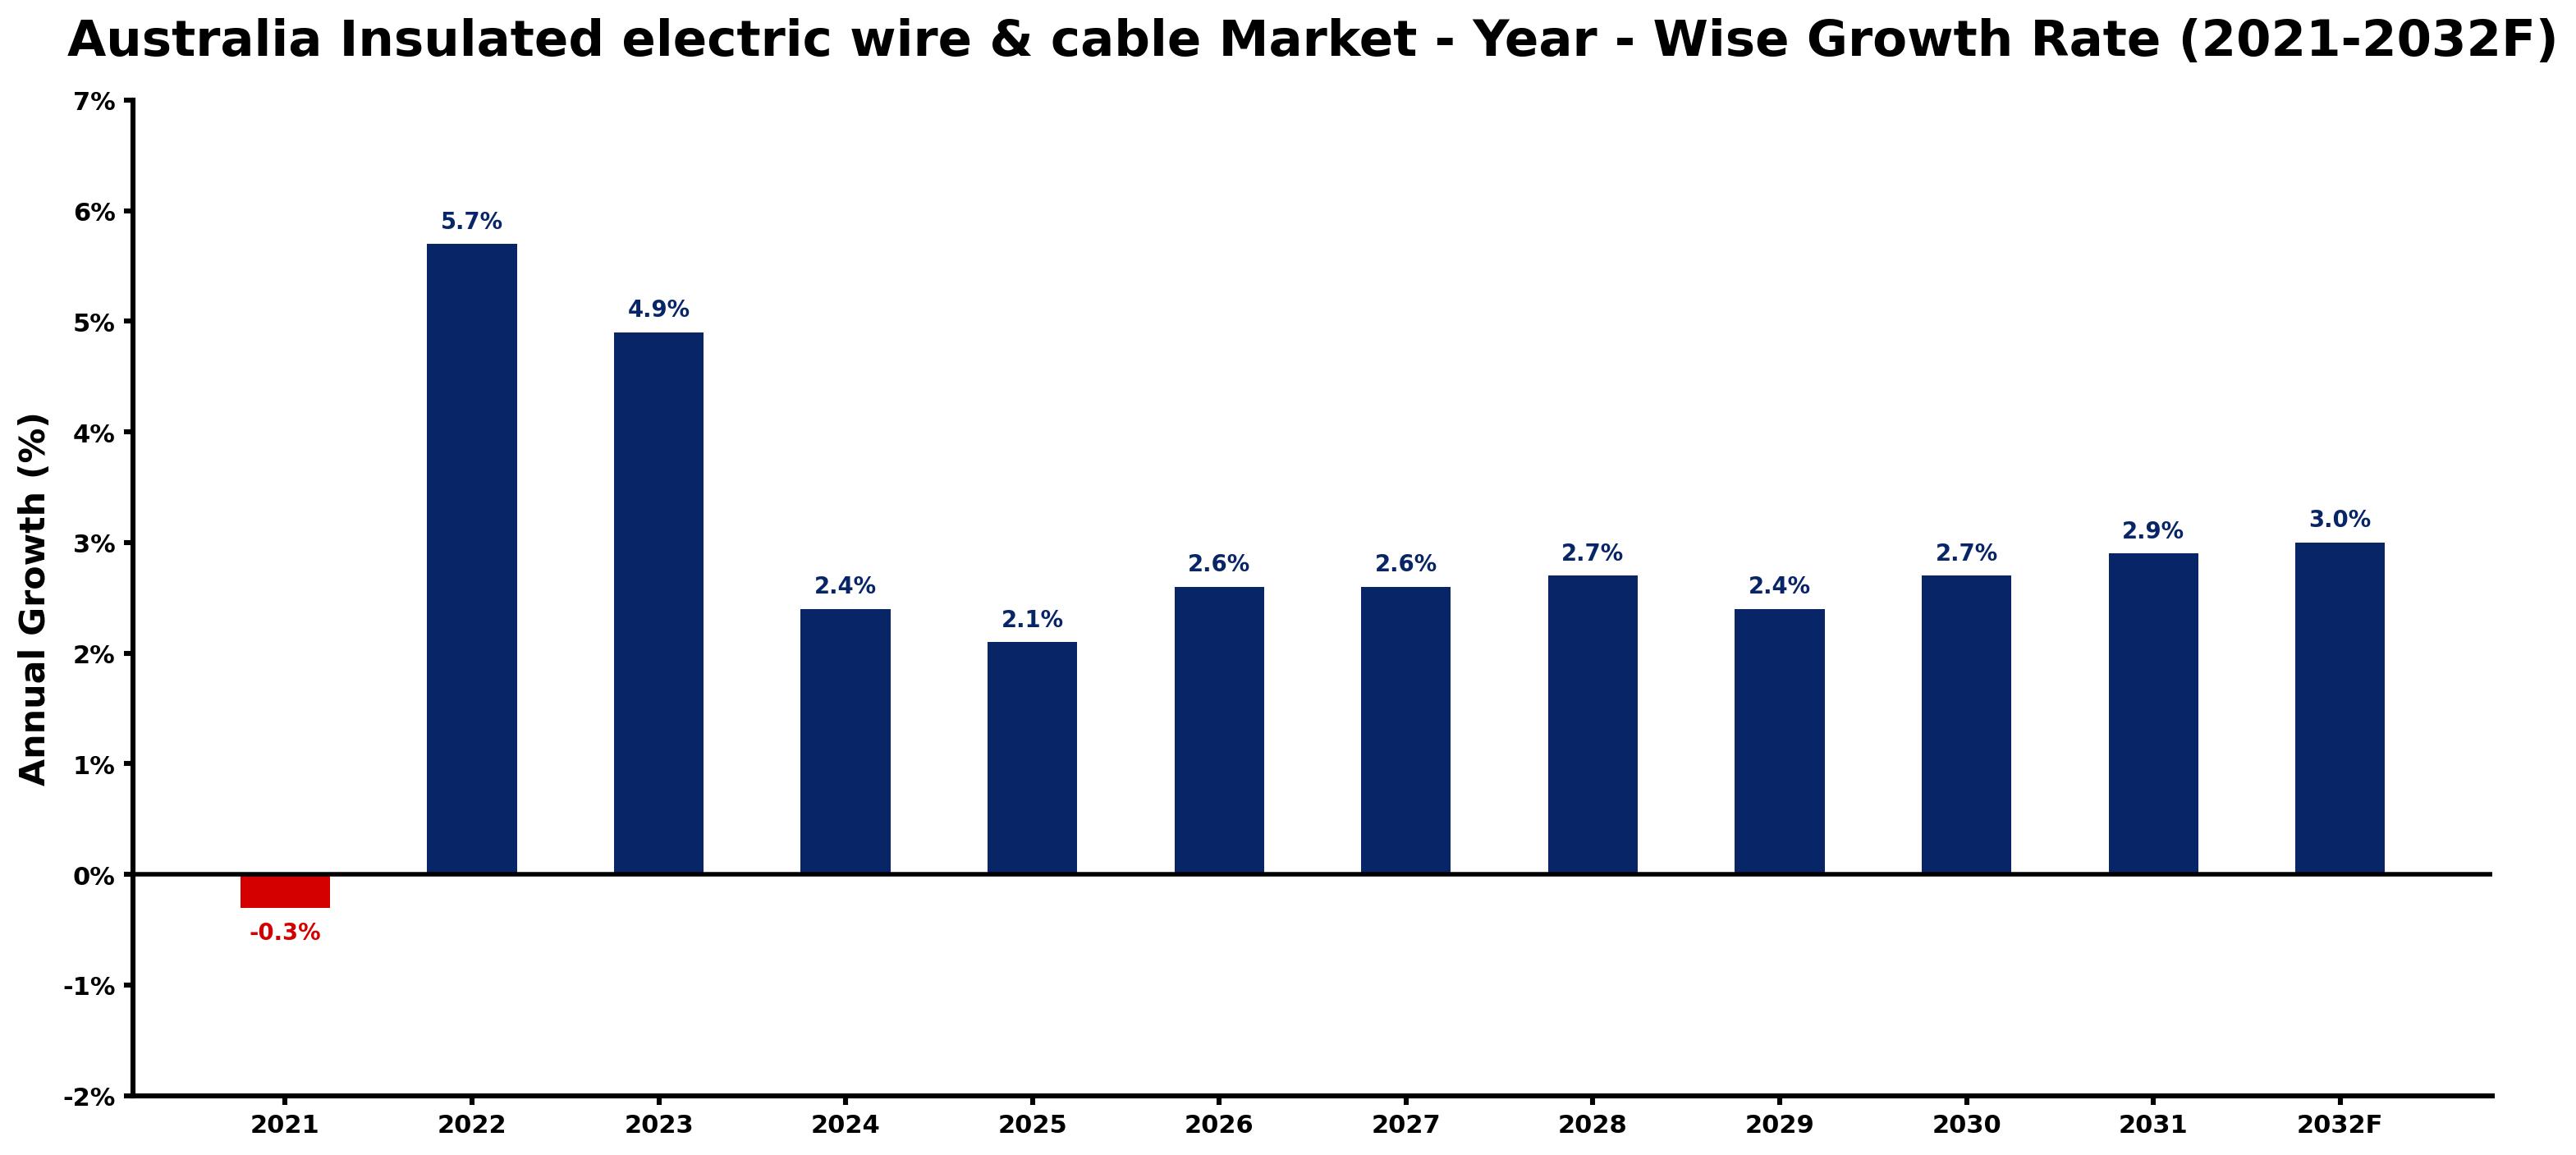
Australia Insulated electric wire & cable Market Growth Rate Analysis (2021-2032)
The Australian insulated electric wire and cable market has exhibited a notable recovery and growth pattern following a slight decline of 0.3% in 2021. Driven by infrastructure investments and the energy transition initiatives, the market grew by an impressive 5.7% in 2022 and continued to expand at 4.9% in 2023. This growth momentum is forecasted to maintain a steady pace, with anticipated increases of 2.4% in 2024 and further upticks around the 2.6-2.9% range until 2032. The rise in demand is largely fueled by advancements in technology and heightened consumer demand for efficient energy solutions, bolstered by supportive policies aimed at enhancing renewable energy adoption and infrastructure development.
Australia Insulated electric wire & cable Market Year-wise Growth Rate and Key Drivers
This graph highlights how the Australia Insulated electric wire & cable Market has steadily grown over the past five years, supported by major growth factors.
The table below presents the year wise growth rates along with the key drivers influencing the market
| Year | Growth Rate | Major Drivers |
| 2021 | -0.3% | Supply chain disruptions hampered manufacturing output, leading to diminished availability of insulated electric wire and cable. |
| 2022 | 5.7% | Legacy copper grid failures highlighted the urgency for reliable insulated cable solutions. |
| 2023 | 4.9% | Enterprise budgets prioritizing energy efficiency boosted demand for insulated electric wire. |
| 2024 | 2.4% | Increased activity in renewable energy projects required extensive wiring for solar installations. |
| 2025 | 2.1% | Infrastructure development in urban centers spurred the need for robust electrical cabling. |
| 2026 | 2.6% | Technological innovations in electric vehicles created new specifications for insulated wiring. |
| 2027 | 2.6% | Smart home trends encouraged installation of advanced insulated cable systems in residences. |
| 2028 | 2.7% | A shift towards sustainable construction practices enhanced the appeal of insulated wire products. |
| 2029 | 2.4% | Emerging industries focused on electrification augmented market potential for insulated cables. |
| 2030 | 2.7% | Demand for high-performance electrical systems increased competition among insulation manufacturers. |
| 2031 | 2.9% | Post-pandemic economic recovery fueled investments in electrical grid modernization projects. |
| 2032 | 3.0% | Experience with extreme weather events emphasized the necessity for durable insulated cabling. |
Note - Market size estimations and growth projections presented in this report are based on 6Wresearch's advanced forecasting approach, validated with industry datasets as of June 2026.
Australia Insulated electric wire & cable Market Synopsis
The Australia Insulated electric wire cable Market is projected to reach 2.6% and witness significant growth during the forecast period (2026-2032). This market is driven by a robust demand for insulated wire and cable products across various sectors, including residential, commercial, and industrial applications.
Australia Insulated electric wire & cable Market Growth Drivers
Several factors are fostering the growth of the Australia insulated electric wire & cable market. A key driver is the ongoing infrastructure development and construction activities which are vital for expanding the electrical grid capacity. Furthermore, advancements in electrical wiring projects in urban centers are creating new opportunities for insulated cable products. The increasing demand for electricity stemming from rapid urbanization also propels the market forward.
- The construction sector's growth has a direct correlation with the demand for insulated cables, as builders and contractors require high-quality wiring solutions to meet the requirements of modern homes and commercial spaces.
- Additionally, the push for renewable energy projects enhances market prospects, as these initiatives necessitate specialized insulated wires and cables for efficient energy transmission.
- The surge in electric vehicle adoption strengthens the need for effective electrical connections, spurring demand for insulated cable solutions.
- Moreover, heightened awareness regarding energy efficiency within building codes promotes the use of advanced insulated cable designs, encouraging manufacturers to innovate.
- Regulatory mandates emphasizing fire safety and electrical reliability further substantiate the demand for insulated wires and cables, driving manufacturers to comply with higher safety standards.
Australia Insulated electric wire & cable Market Challenges and Restraints
Despite optimistic growth prospects, the Australia insulated electric wire & cable market faces several challenges. Key issues include stringent safety standards and performance requirements that manufacturers must navigate to remain competitive.
- The necessity for compliance with evolving safety regulations poses a significant barrier, as companies must invest in quality assurance processes and testing to ensure their products meet these standards.
- Market competition, especially from international players, can exert downward pressure on prices, making it difficult for local manufacturers to maintain profitability.
- Environmental factors and the increasing complexity of electrical designs add to the challenge, as insulated cables must be capable of withstanding various stresses and conditions.
- Moreover, fluctuating raw material costs can impact manufacturers' pricing strategies, leaving them vulnerable to economic variations.
- Finally, as technology evolves, cable manufacturers must continuously innovate and upgrade their product offerings to keep pace with consumer demands for efficiency and reliability.
Australia Insulated electric wire & cable Market Government Investment and Initiatives
Government support plays a crucial role in shaping the Australia insulated electric wire & cable market. Various policies and initiatives are designed to enhance electrical safety and promote energy efficiency.
- The Australian government has implemented regulations that establish standards for insulation materials, conductor sizing, and voltage ratings, ensuring that products provided in the market meet necessary safety criteria and building codes.
- Investments are directed towards research and development aimed at creating energy-efficient designs in insulated cables, facilitating a transition towards sustainable energy solutions.
- Public spending on infrastructure projects is prioritized, with significant allocations made for upgrades to the electrical grid, which often require modern insulated wiring solutions.
- Furthermore, government agencies are working in collaboration with industry stakeholders to devise guidelines for safe cable installation and maintenance, thereby enhancing public safety and property protection.
- Incentives for the adoption of innovative cable technologies are also being explored, fostering an environment of continuous improvement within the sector.
Australia Insulated electric wire & cable Market Latest Developments (May 2025 - June 2026)
The period from May 2025 to June 2026 has seen notable developments in the Australia insulated electric wire & cable market, reflecting the sector's adaptability to changing demands and standards.
- Recent industry trends indicate an increasing focus on sustainable cable materials and designs, driven by regulatory pressures and consumer preferences for eco-friendly products.
- Moreover, technological advancements in manufacturing processes have enhanced the production efficiency of insulated cables, allowing companies to respond quickly to market fluctuations.
- Industry stakeholders have begun to prioritize the integration of smart technologies into cable systems, enabling better monitoring of electrical consumption and performance.
- Trade shows and industry conferences have become platforms for showcasing innovative products and industry best practices, fostering collaboration across various sectors.
- Finally, the overall sentiment within the market remains positive, supported by ongoing investments from both public and private sectors, indicating a promising outlook for future growth.
Australia Insulated electric wire & cable Market - Key Attractiveness of the Report
- 10 Years of Market Numbers
- Historical Data Starting from 2022 to 2025
- Base Year: 2025
- Forecast Data until 2032
- Key Performance Indicators Impacting the Market
- Major Upcoming Developments and Projects
Key Highlights of the Report:
- Australia Insulated electric wire & cable Market Outlook
- Market Size of Australia Insulated electric wire & cable Market, 2025
- Forecast of Australia Insulated electric wire & cable Market, 2032
- Historical Data and Forecast of Australia Insulated electric wire & cable Revenues & Volume for the Period 2022-2032F
- Australia Insulated electric wire & cable Market Trend Evolution
- Australia Insulated electric wire & cable Market Drivers and Challenges
- Australia Insulated electric wire & cable Price Trends
- Australia Insulated electric wire & cable Porter's Five Forces
- Australia Insulated electric wire & cable Industry Life Cycle
- Historical Data and Forecast of Australia Insulated electric wire & cable Market Revenues & Volume By Types for the Period 2022-2032F
- Historical Data and Forecast of Australia Insulated electric wire & cable Market Revenues & Volume By Metals for the Period 2022-2032F
- Historical Data and Forecast of Australia Insulated electric wire & cable Market Revenues & Volume By Plastics for the Period 2022-2032F
- Historical Data and Forecast of Australia Insulated electric wire & cable Market Revenues & Volume By Optical Fibers for the Period 2022-2032F
- Historical Data and Forecast of Australia Insulated electric wire & cable Market Revenues & Volume By Applications for the Period 2022-2032F
- Historical Data and Forecast of Australia Insulated electric wire & cable Market Revenues & Volume By Electrical Equipment for the Period 2022-2032F
- Historical Data and Forecast of Australia Insulated electric wire & cable Market Revenues & Volume By Construction for the Period 2022-2032F
- Historical Data and Forecast of Australia Insulated electric wire & cable Market Revenues & Volume By Telecommunications for the Period 2022-2032F
- Historical Data and Forecast of Australia Insulated electric wire & cable Market Revenues & Volume By Motor Vehicles for the Period 2022-2032F
- Historical Data and Forecast of Australia Insulated electric wire & cable Market Revenues & Volume By Industrial Machinery for the Period 2022-2032F
- Australia Insulated electric wire & cable Import Export Trade Statistics
- Market Opportunity Assessment By Types
- Market Opportunity Assessment By Applications
- Australia Insulated electric wire & cable Top Companies Market Share
- Australia Insulated electric wire & cable Competitive Benchmarking By Technical and Operational Parameters
- Australia Insulated electric wire & cable Company Profiles
- Australia Insulated electric wire & cable Key Strategic Recommendations
Frequently Asked Questions About the Market Study (FAQs):
The growth is primarily driven by infrastructure development, increased electricity demand across sectors, and the expansion of renewable energy projects.
Challenges include stringent safety standards, competitive pricing pressures, and the necessity for continuous innovation in cable design and manufacturing.
Government investment is significant, focusing on regulatory compliance, infrastructure enhancement, and support for research and development of energy-efficient cable technologies.
Current trends include the shift towards sustainable materials, the integration of smart technologies in wiring solutions, and increased investments in electrical infrastructure.
6Wresearch actively monitors the Australia Insulated electric wire & cable Market and publishes its comprehensive annual report, highlighting emerging trends, growth drivers, revenue analysis, and forecast outlook. Our insights help businesses to make data-backed strategic decisions with ongoing market dynamics. Our analysts track relevent industries related to the Australia Insulated electric wire & cable Market, allowing our clients with actionable intelligence and reliable forecasts tailored to emerging regional needs.
Yes, we provide customisation as per your requirements. To learn more, feel free to contact us on sales@6wresearch.com
1 Executive Summary |
2 Introduction |
2.1 Key Highlights of the Report |
2.2 Report Description |
2.3 Market Scope & Segmentation |
2.4 Research Methodology |
2.5 Assumptions |
3 Australia Insulated electric wire & cable Market Overview |
3.1 Australia Country Macro Economic Indicators |
3.2 Australia Insulated electric wire & cable Market Revenues & Volume, 2022 & 2032F |
3.3 Australia Insulated electric wire & cable Market - Industry Life Cycle |
3.4 Australia Insulated electric wire & cable Market - Porter's Five Forces |
3.5 Australia Insulated electric wire & cable Market Revenues & Volume Share, By Types, 2022 & 2032F |
3.6 Australia Insulated electric wire & cable Market Revenues & Volume Share, By Applications, 2022 & 2032F |
4 Australia Insulated electric wire & cable Market Dynamics |
4.1 Impact Analysis |
4.2 Market Drivers |
4.2.1 Increasing demand for energy-efficient solutions in residential and commercial buildings |
4.2.2 Growing investments in infrastructure projects in Australia |
4.2.3 Adoption of renewable energy sources driving the need for insulated electric wire cable |
4.3 Market Restraints |
4.3.1 Fluctuating raw material prices impacting production costs |
4.3.2 Intense competition from local and international manufacturers |
4.3.3 Stringent regulations and standards for product safety and quality |
5 Australia Insulated electric wire & cable Market Trends |
6 Australia Insulated electric wire & cable Market, By Types |
6.1 Australia Insulated electric wire & cable Market, By Types |
6.1.1 Overview and Analysis |
6.1.2 Australia Insulated electric wire & cable Market Revenues & Volume, By Types, 2022-2032F |
6.1.3 Australia Insulated electric wire & cable Market Revenues & Volume, By Metals, 2022-2032F |
6.1.4 Australia Insulated electric wire & cable Market Revenues & Volume, By Plastics, 2022-2032F |
6.1.5 Australia Insulated electric wire & cable Market Revenues & Volume, By Optical Fibers, 2022-2032F |
6.2 Australia Insulated electric wire & cable Market, By Applications |
6.2.1 Overview and Analysis |
6.2.2 Australia Insulated electric wire & cable Market Revenues & Volume, By Electrical Equipment, 2022-2032F |
6.2.3 Australia Insulated electric wire & cable Market Revenues & Volume, By Construction, 2022-2032F |
6.2.4 Australia Insulated electric wire & cable Market Revenues & Volume, By Telecommunications, 2022-2032F |
6.2.5 Australia Insulated electric wire & cable Market Revenues & Volume, By Motor Vehicles, 2022-2032F |
6.2.6 Australia Insulated electric wire & cable Market Revenues & Volume, By Industrial Machinery, 2022-2032F |
7 Australia Insulated electric wire & cable Market Import-Export Trade Statistics |
7.1 Australia Insulated electric wire & cable Market Export to Major Countries |
7.2 Australia Insulated electric wire & cable Market Imports from Major Countries |
8 Australia Insulated electric wire & cable Market Key Performance Indicators |
8.1 Average selling price of insulated electric wire cable |
8.2 Percentage of revenue from innovative product lines |
8.3 Number of new contracts or partnerships in the industry |
9 Australia Insulated electric wire & cable Market - Opportunity Assessment |
9.1 Australia Insulated electric wire & cable Market Opportunity Assessment, By Types, 2022 & 2032F |
9.2 Australia Insulated electric wire & cable Market Opportunity Assessment, By Applications, 2022 & 2032F |
10 Australia Insulated electric wire & cable Market - Competitive Landscape |
10.1 Australia Insulated electric wire & cable Market Revenue Share, By Companies, 2025 |
10.2 Australia Insulated electric wire & cable Market Competitive Benchmarking, By Operating and Technical Parameters |
11 Company Profiles |
12 Recommendations |
13 Disclaimer |
Global Go To Market Strategy - 2030
Export potential enables firms to identify high-growth global markets with greater confidence by combining advanced trade intelligence with a structured quantitative methodology. The framework analyzes emerging demand trends and country-level import patterns while integrating macroeconomic and trade datasets such as GDP and population forecasts, bilateral import–export flows, tariff structures, elasticity differentials between developed and developing economies, geographic distance, and import demand projections. Using weighted trade values from 2020–2024 as the base period to project country-to-country export potential for 2030, these inputs are operationalized through calculated drivers such as gravity model parameters, tariff impact factors, and projected GDP per-capita growth. Through an analysis of hidden potentials, demand hotspots, and market conditions that are most favorable to success, this method enables firms to focus on target countries, maximize returns, and global expansion with data, backed by accuracy.
By factoring in the projected importer demand gap that is currently unmet and could be potential opportunity, it identifies the potential for the Exporter (Country) among 190 countries, against the general trade analysis, which identifies the biggest importer or exporter.
To discover high-growth global markets and optimize your business strategy:
Click Here
Pricing
- Single User License$ 1,995
- Department License$ 2,400
- Site License$ 3,120
- Global License$ 3,795

Leadership Perspectives from Industry Events
Search
Thought Leadership and Analyst Meet


Our Clients
6WResearch In News
- India Air Conditioner Market Set for Strong Rebound in 2026 After Weather-Led Correction and GST-Driven Recovery: 6Wresearch
- ADAS in India: How Automatic Emergency Braking, Blind Spot Detection & Driver Monitoring are Transforming Road Safety
- Doha a strategic location for EV manufacturing hub: IPA Qatar
- Demand for luxury TVs surging in the GCC, says Samsung
- Empowering Growth: The Thriving Journey of Bangladesh’s Cable Industry
- Demand for luxury TVs surging in the GCC, says Samsung
Latest Reports
- Poland Fire Protection Systems Market (2026-2032)
- Cape Verde Portable Hand-Thrown Extinguisher Market (2026-2032)
- Canada Portable Hand-Thrown Extinguisher Market (2026-2032)
- Cameroon Portable Hand-Thrown Extinguisher Market (2026-2032)
- Burundi Portable Hand-Thrown Extinguisher Market (2026-2032)
- Burkina Faso Portable Hand-Thrown Extinguisher Market (2026-2032)
- Bulgaria Portable Hand-Thrown Extinguisher Market (2026-2032)
- Brunei Portable Hand-Thrown Extinguisher Market (2026-2032)
- Botswana Portable Hand-Thrown Extinguisher Market (2026-2032)
- Bosnia and Herzegovina Portable Hand-Thrown Extinguisher Market (2026-2032)
Industry Events and Analyst Meet

HIMTEX 2026

India Refining Summit 2026

India EV Show 2026

EV tech India Expo 2026

Auto Tech Asia 2026
Whitepaper
- Middle East & Africa Commercial Security Market Click here to view more.
- Middle East & Africa Fire Safety Systems & Equipment Market Click here to view more.
- GCC Drone Market Click here to view more.
- Middle East Lighting Fixture Market Click here to view more.
- GCC Physical & Perimeter Security Market Click here to view more.