Australia Ion Exchange Resin Market (2026-2032) | Outlook, Share, Industry, Competitive Landscape, Value, Forecast, Growth, Size & Revenue, Analysis, Companies, Segmentation, Trends
Market Forecast By Type (Cationic Resins, Anionic Resins, Others), By Application (Water, Non-water), By End-use industry (Power, Chemical & Petrochemical, Food & Beverage, Pharmaceutical, Electrical & Electronics, Metal & Mining, Others) And Competitive Landscape
| Product Code: ETC6183335 | Publication Date: Sep 2024 | Updated Date: Feb 2026 | Product Type: Market Research Report | |
| Publisher: 6Wresearch | Author: Summon Dutta | No. of Pages: 75 | No. of Figures: 35 | No. of Tables: 20 |
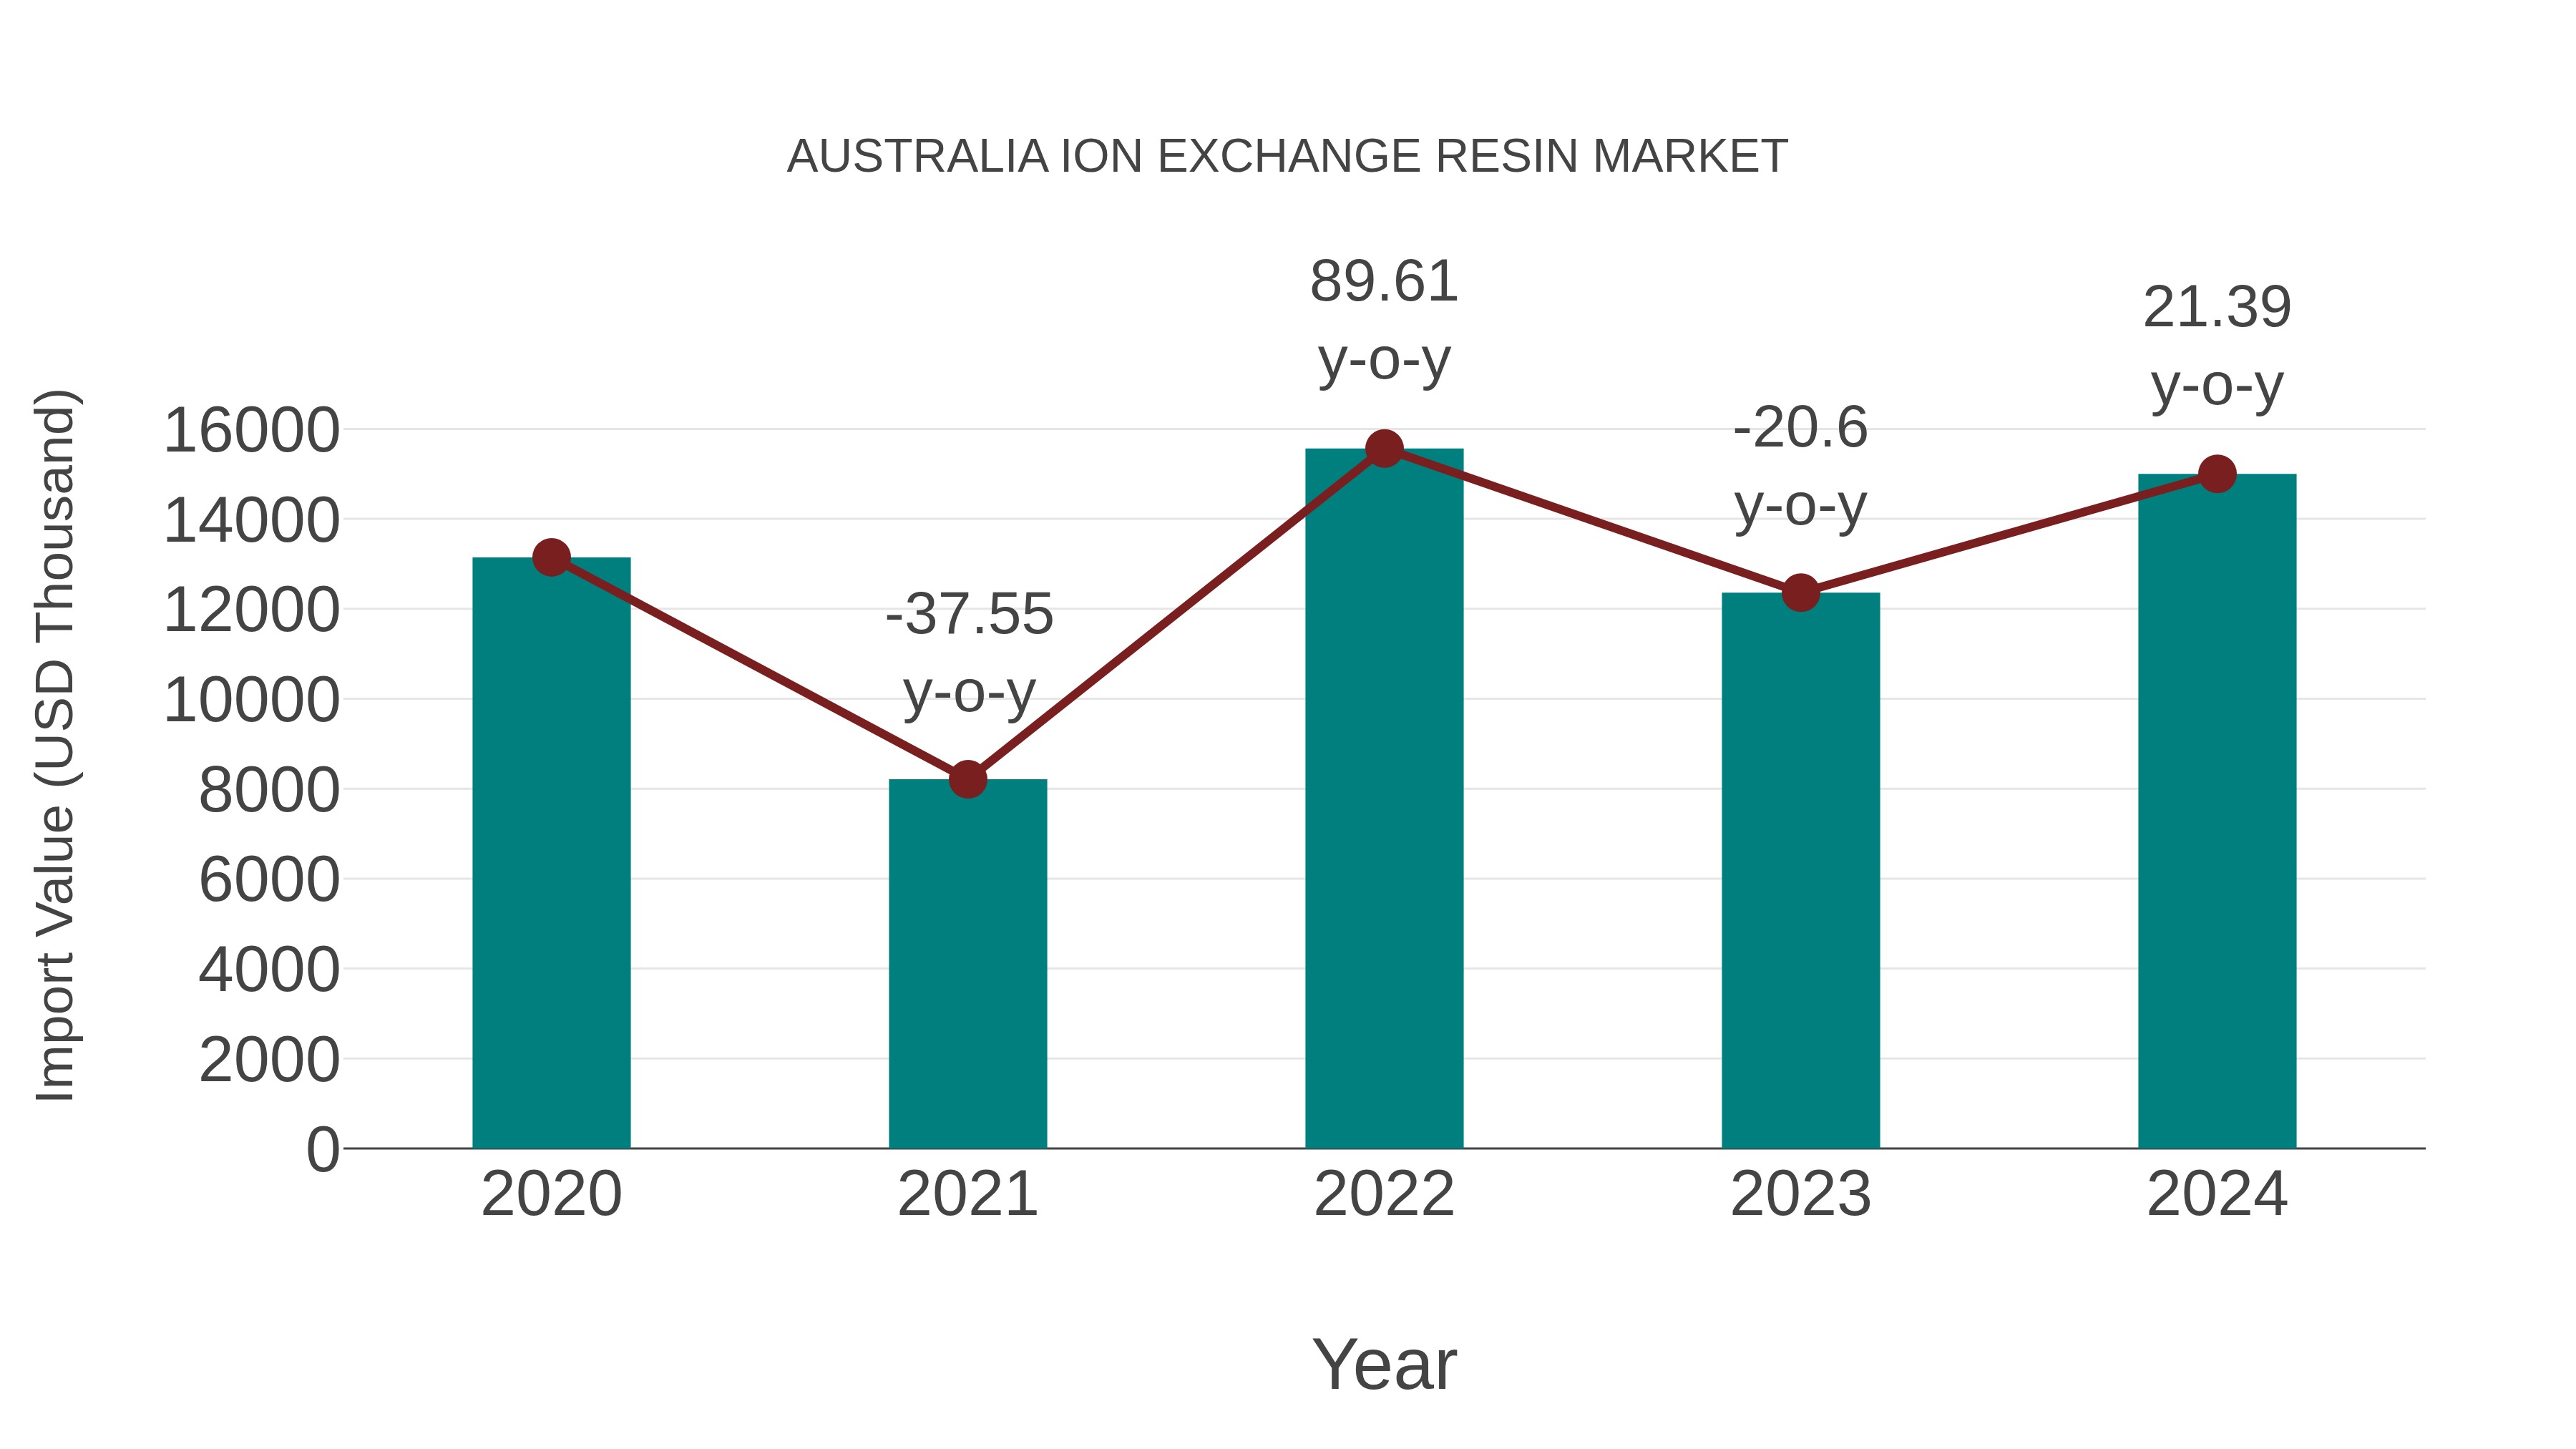
Australia Ion Exchange Resin Market: Import Trend Analysis
In the Australia ion exchange resin market, the import trend showed significant growth from 2023 to 2024, with a growth rate of 21.39%. The compound annual growth rate (CAGR) for the period 2020-2024 stood at 3.36%. This surge in imports can be attributed to a notable shift in demand dynamics within the market, potentially driven by evolving industrial requirements or changes in the competitive landscape.
Australia Ion Exchange Resin Market Overview
Ion exchange resins are widely used in Australia for water softening, demineralization, and purification processes in industries such as power generation, pharmaceuticals, and food processing. Municipal and industrial water treatment projects continue to fuel market demand, supported by government initiatives for sustainable water management. The mining industry also employs these resins for metal recovery and purification. The market is competitive, with both global players and local suppliers offering tailored solutions.
Trends of the market
The ion exchange resin market in Australia is evolving due to the increased demand in water treatment, chemical processing, and mining industries. Resins are being tailored for specific applications such as removal of heavy metals, softening of hard water, and recovery of valuable metals. The mining industry, in particular, is a major driver, with ion exchange resins playing a crucial role in the hydrometallurgical extraction of rare earth elements and precious metals. This has led to a trend of enhanced focus on high-capacity and chemically robust resin formulations.
Challenges of the market
The Ion Exchange Resin market in Australia is hindered by issues related to resin degradation over time, which affects the efficiency of ion exchange processes. Another challenge is the limited availability of high-quality resins that meet the stringent industry standards required for various applications such as water treatment and chemical processing. Furthermore, the increasing concerns over environmental sustainability lead to greater scrutiny of the resin disposal processes, which can be both costly and environmentally damaging. The market also experiences volatility in raw material costs, as most ion exchange resins are derived from petrochemicals.
Investment opportunities in the Market
The Australian Ion Exchange Resin Market offers promising investment opportunities, particularly due to its critical role in industries such as water treatment, pharmaceuticals, and food production. As regulations around water quality tighten and demand for more sustainable, environmentally friendly water treatment solutions grows, the need for high-performance resins increases. Investors can consider putting capital into companies that specialize in resin production with novel regeneration techniques or those focused on the development of resins for niche applications like heavy metals removal or high-purity water treatment systems.
Government Policy of the market
The ion exchange resin market in Australia is governed by various environmental and industrial regulations that prioritize sustainable chemical use and water treatment. Policies aimed at reducing water wastage, improving wastewater treatment, and promoting the recycling of water in agriculture, industry, and municipalities have driven demand for ion exchange resins. Australia`s commitment to reducing industrial waste and minimizing environmental impacts encourages the adoption of ion exchange resins in chemical processing and water purification systems. Additionally, the governments support for innovation in water treatment technologies has fostered market growth.
Key Highlights of the Report:
- Australia Ion Exchange Resin Market Outlook
- Market Size of Australia Ion Exchange Resin Market, 2025
- Forecast of Australia Ion Exchange Resin Market, 2032
- Historical Data and Forecast of Australia Ion Exchange Resin Revenues & Volume for the Period 2022 - 2032F
- Australia Ion Exchange Resin Market Trend Evolution
- Australia Ion Exchange Resin Market Drivers and Challenges
- Australia Ion Exchange Resin Price Trends
- Australia Ion Exchange Resin Porter's Five Forces
- Australia Ion Exchange Resin Industry Life Cycle
- Historical Data and Forecast of Australia Ion Exchange Resin Market Revenues & Volume By Type for the Period 2022 - 2032F
- Historical Data and Forecast of Australia Ion Exchange Resin Market Revenues & Volume By Cationic Resins for the Period 2022 - 2032F
- Historical Data and Forecast of Australia Ion Exchange Resin Market Revenues & Volume By Anionic Resins for the Period 2022 - 2032F
- Historical Data and Forecast of Australia Ion Exchange Resin Market Revenues & Volume By Others for the Period 2022 - 2032F
- Historical Data and Forecast of Australia Ion Exchange Resin Market Revenues & Volume By Application for the Period 2022 - 2032F
- Historical Data and Forecast of Australia Ion Exchange Resin Market Revenues & Volume By Water for the Period 2022 - 2032F
- Historical Data and Forecast of Australia Ion Exchange Resin Market Revenues & Volume By Non-water for the Period 2022 - 2032F
- Historical Data and Forecast of Australia Ion Exchange Resin Market Revenues & Volume By End-use industry for the Period 2022 - 2032F
- Historical Data and Forecast of Australia Ion Exchange Resin Market Revenues & Volume By Power for the Period 2022 - 2032F
- Historical Data and Forecast of Australia Ion Exchange Resin Market Revenues & Volume By Chemical & Petrochemical for the Period 2022 - 2032F
- Historical Data and Forecast of Australia Ion Exchange Resin Market Revenues & Volume By Food & Beverage for the Period 2022 - 2032F
- Historical Data and Forecast of Australia Ion Exchange Resin Market Revenues & Volume By Pharmaceutical for the Period 2022 - 2032F
- Historical Data and Forecast of Australia Ion Exchange Resin Market Revenues & Volume By Electrical & Electronics for the Period 2022 - 2032F
- Historical Data and Forecast of Australia Ion Exchange Resin Market Revenues & Volume By Metal & Mining for the Period 2022 - 2032F
- Historical Data and Forecast of Australia Ion Exchange Resin Market Revenues & Volume By Others for the Period 2022 - 2032F
- Australia Ion Exchange Resin Import Export Trade Statistics
- Market Opportunity Assessment By Type
- Market Opportunity Assessment By Application
- Market Opportunity Assessment By End-use industry
- Australia Ion Exchange Resin Top Companies Market Share
- Australia Ion Exchange Resin Competitive Benchmarking By Technical and Operational Parameters
- Australia Ion Exchange Resin Company Profiles
- Australia Ion Exchange Resin Key Strategic Recommendations
Frequently Asked Questions About the Market Study (FAQs):
6Wresearch actively monitors the Australia Ion Exchange Resin Market and publishes its comprehensive annual report, highlighting emerging trends, growth drivers, revenue analysis, and forecast outlook. Our insights help businesses to make data-backed strategic decisions with ongoing market dynamics. Our analysts track relevent industries related to the Australia Ion Exchange Resin Market, allowing our clients with actionable intelligence and reliable forecasts tailored to emerging regional needs.
Yes, we provide customisation as per your requirements. To learn more, feel free to contact us on sales@6wresearch.com
1 Executive Summary |
2 Introduction |
2.1 Key Highlights of the Report |
2.2 Report Description |
2.3 Market Scope & Segmentation |
2.4 Research Methodology |
2.5 Assumptions |
3 Australia Ion Exchange Resin Market Overview |
3.1 Australia Country Macro Economic Indicators |
3.2 Australia Ion Exchange Resin Market Revenues & Volume, 2022 & 2032F |
3.3 Australia Ion Exchange Resin Market - Industry Life Cycle |
3.4 Australia Ion Exchange Resin Market - Porter's Five Forces |
3.5 Australia Ion Exchange Resin Market Revenues & Volume Share, By Type, 2022 & 2032F |
3.6 Australia Ion Exchange Resin Market Revenues & Volume Share, By Application, 2022 & 2032F |
3.7 Australia Ion Exchange Resin Market Revenues & Volume Share, By End-use industry, 2022 & 2032F |
4 Australia Ion Exchange Resin Market Dynamics |
4.1 Impact Analysis |
4.2 Market Drivers |
4.2.1 Growing demand for water treatment and purification processes in various industries |
4.2.2 Increasing focus on environmental sustainability and regulations promoting the use of ion exchange resins |
4.2.3 Technological advancements leading to improved efficiency and effectiveness of ion exchange resins |
4.3 Market Restraints |
4.3.1 High initial investment and operational costs associated with ion exchange resin systems |
4.3.2 Competition from alternative water treatment technologies impacting market growth |
4.3.3 Fluctuating raw material prices affecting the overall production costs |
5 Australia Ion Exchange Resin Market Trends |
6 Australia Ion Exchange Resin Market, By Types |
6.1 Australia Ion Exchange Resin Market, By Type |
6.1.1 Overview and Analysis |
6.1.2 Australia Ion Exchange Resin Market Revenues & Volume, By Type, 2022 - 2032F |
6.1.3 Australia Ion Exchange Resin Market Revenues & Volume, By Cationic Resins, 2022 - 2032F |
6.1.4 Australia Ion Exchange Resin Market Revenues & Volume, By Anionic Resins, 2022 - 2032F |
6.1.5 Australia Ion Exchange Resin Market Revenues & Volume, By Others, 2022 - 2032F |
6.2 Australia Ion Exchange Resin Market, By Application |
6.2.1 Overview and Analysis |
6.2.2 Australia Ion Exchange Resin Market Revenues & Volume, By Water, 2022 - 2032F |
6.2.3 Australia Ion Exchange Resin Market Revenues & Volume, By Non-water, 2022 - 2032F |
6.3 Australia Ion Exchange Resin Market, By End-use industry |
6.3.1 Overview and Analysis |
6.3.2 Australia Ion Exchange Resin Market Revenues & Volume, By Power, 2022 - 2032F |
6.3.3 Australia Ion Exchange Resin Market Revenues & Volume, By Chemical & Petrochemical, 2022 - 2032F |
6.3.4 Australia Ion Exchange Resin Market Revenues & Volume, By Food & Beverage, 2022 - 2032F |
6.3.5 Australia Ion Exchange Resin Market Revenues & Volume, By Pharmaceutical, 2022 - 2032F |
6.3.6 Australia Ion Exchange Resin Market Revenues & Volume, By Electrical & Electronics, 2022 - 2032F |
6.3.7 Australia Ion Exchange Resin Market Revenues & Volume, By Metal & Mining, 2022 - 2032F |
7 Australia Ion Exchange Resin Market Import-Export Trade Statistics |
7.1 Australia Ion Exchange Resin Market Export to Major Countries |
7.2 Australia Ion Exchange Resin Market Imports from Major Countries |
8 Australia Ion Exchange Resin Market Key Performance Indicators |
8.1 Adoption rate of ion exchange resin technology in key industries (e.g., pharmaceuticals, food beverage, power generation) |
8.2 Rate of regulatory compliance and environmental standards adherence by industries using ion exchange resins |
8.3 Research and development investments in new ion exchange resin formulations and applications |
9 Australia Ion Exchange Resin Market - Opportunity Assessment |
9.1 Australia Ion Exchange Resin Market Opportunity Assessment, By Type, 2022 & 2032F |
9.2 Australia Ion Exchange Resin Market Opportunity Assessment, By Application, 2022 & 2032F |
9.3 Australia Ion Exchange Resin Market Opportunity Assessment, By End-use industry, 2022 & 2032F |
10 Australia Ion Exchange Resin Market - Competitive Landscape |
10.1 Australia Ion Exchange Resin Market Revenue Share, By Companies, 2032 |
10.2 Australia Ion Exchange Resin Market Competitive Benchmarking, By Operating and Technical Parameters |
11 Company Profiles |
12 Recommendations |
13 Disclaimer |
Export potential assessment - trade Analytics for 2030
Export potential enables firms to identify high-growth global markets with greater confidence by combining advanced trade intelligence with a structured quantitative methodology. The framework analyzes emerging demand trends and country-level import patterns while integrating macroeconomic and trade datasets such as GDP and population forecasts, bilateral import–export flows, tariff structures, elasticity differentials between developed and developing economies, geographic distance, and import demand projections. Using weighted trade values from 2020–2024 as the base period to project country-to-country export potential for 2030, these inputs are operationalized through calculated drivers such as gravity model parameters, tariff impact factors, and projected GDP per-capita growth. Through an analysis of hidden potentials, demand hotspots, and market conditions that are most favorable to success, this method enables firms to focus on target countries, maximize returns, and global expansion with data, backed by accuracy.
By factoring in the projected importer demand gap that is currently unmet and could be potential opportunity, it identifies the potential for the Exporter (Country) among 190 countries, against the general trade analysis, which identifies the biggest importer or exporter.
To discover high-growth global markets and optimize your business strategy:
Click Here
Pricing
- Single User License$ 1,995
- Department License$ 2,400
- Site License$ 3,120
- Global License$ 3,795

Search
Thought Leadership and Analyst Meet


Our Clients
Related Reports
- India Switchgear Market Outlook (2026 - 2032) | Size, Share, Trends, Growth, Revenue, Forecast, Analysis, Value, Outlook
- Pakistan Contraceptive Implants Market (2025-2031) | Demand, Growth, Size, Share, Industry, Pricing Analysis, Competitive, Strategic Insights, Strategy, Consumer Insights, Analysis, Investment Trends, Opportunities, Revenue, Segments, Value, Segmentation, Supply, Forecast, Restraints, Outlook, Competition, Drivers, Trends, Companies, Challenges
- Sri Lanka Packaging Market (2026-2032) | Outlook, Competition, Drivers, Trends, Demand, Pricing Analysis, Competitive, Strategic Insights, Companies, Challenges, Strategy, Consumer Insights, Analysis, Investment Trends, Opportunities, Growth, Size, Share, Industry, Revenue, Segments, Value, Segmentation, Supply, Forecast, Restraints
- India Kids Watches Market (2026-2032) | Strategy, Consumer Insights, Analysis, Investment Trends, Opportunities, Growth, Size, Share, Industry, Revenue, Segments, Value, Segmentation, Supply, Forecast, Restraints, Outlook, Competition, Drivers, Trends, Demand, Pricing Analysis, Competitive, Strategic Insights, Companies, Challenges
- Saudi Arabia Core Assurance Service Market (2025-2031) | Strategy, Consumer Insights, Analysis, Investment Trends, Opportunities, Growth, Size, Share, Industry, Revenue, Segments, Value, Segmentation, Supply, Forecast, Restraints, Outlook, Competition, Drivers, Trends, Demand, Pricing Analysis, Competitive, Strategic Insights, Companies, Challenges
- Romania Uninterruptible Power Supply (UPS) Market (2026-2032) | Industry, Analysis, Revenue, Size, Forecast, Outlook, Value, Trends, Share, Growth & Companies
- Saudi Arabia Car Window Tinting Film, Paint Protection Film (PPF), and Ceramic Coating Market (2025-2031) | Strategy, Consumer Insights, Analysis, Investment Trends, Opportunities, Growth, Size, Share, Industry, Revenue, Segments, Value, Segmentation, Supply, Forecast, Restraints, Outlook, Competition, Drivers, Trends, Demand, Pricing Analysis, Competitive, Strategic Insights, Companies, Challenges
- South Africa Stationery Market (2025-2031) | Share, Size, Industry, Value, Growth, Revenue, Analysis, Trends, Segmentation & Outlook
- Afghanistan Rocking Chairs And Adirondack Chairs Market (2026-2032) | Size & Revenue, Competitive Landscape, Share, Segmentation, Industry, Value, Outlook, Analysis, Trends, Growth, Forecast, Companies
- Afghanistan Apparel Market (2026-2032) | Growth, Outlook, Industry, Segmentation, Forecast, Size, Companies, Trends, Value, Share, Analysis & Revenue
Industry Events and Analyst Meet

India EV Show 2026

EV tech India Expo 2026

Auto Tech Asia 2026

Battery Tech India 2026

Smart Production Solutions Guangzhou 2026
Whitepaper
- Middle East & Africa Commercial Security Market Click here to view more.
- Middle East & Africa Fire Safety Systems & Equipment Market Click here to view more.
- GCC Drone Market Click here to view more.
- Middle East Lighting Fixture Market Click here to view more.
- GCC Physical & Perimeter Security Market Click here to view more.
6WResearch In News
- Doha a strategic location for EV manufacturing hub: IPA Qatar
- Demand for luxury TVs surging in the GCC, says Samsung
- Empowering Growth: The Thriving Journey of Bangladesh’s Cable Industry
- Demand for luxury TVs surging in the GCC, says Samsung
- Video call with a traditional healer? Once unthinkable, it’s now common in South Africa
- Intelligent Buildings To Smooth GCC’s Path To Net Zero