Australia Phosphorus and Derivatives Market (2026-2032) Outlook | Growth, Analysis, Share, Industry, Trends, Revenue, Size, Companies, Value & Forecast
Market Forecast By Product Type (Ammonium Phosphates, Industrial Phosphates, Purified Phosphoric Acid, Phosphorus Chloride, Phosphorus Pentoxide, Phosphorus Pentasulfide), By Application (Fertilizers, Detergents, Food Industry, Water Treatment Chemicals, Metal Finishing, Flame Retardant Material) And Competitive Landscape
| Product Code: ETC192227 | Publication Date: May 2022 | Updated Date: Mar 2026 | Product Type: Market Research Report | |
| Publisher: 6Wresearch | Author: Ravi Bhandari | No. of Pages: 60 | No. of Figures: 40 | No. of Tables: 7 |
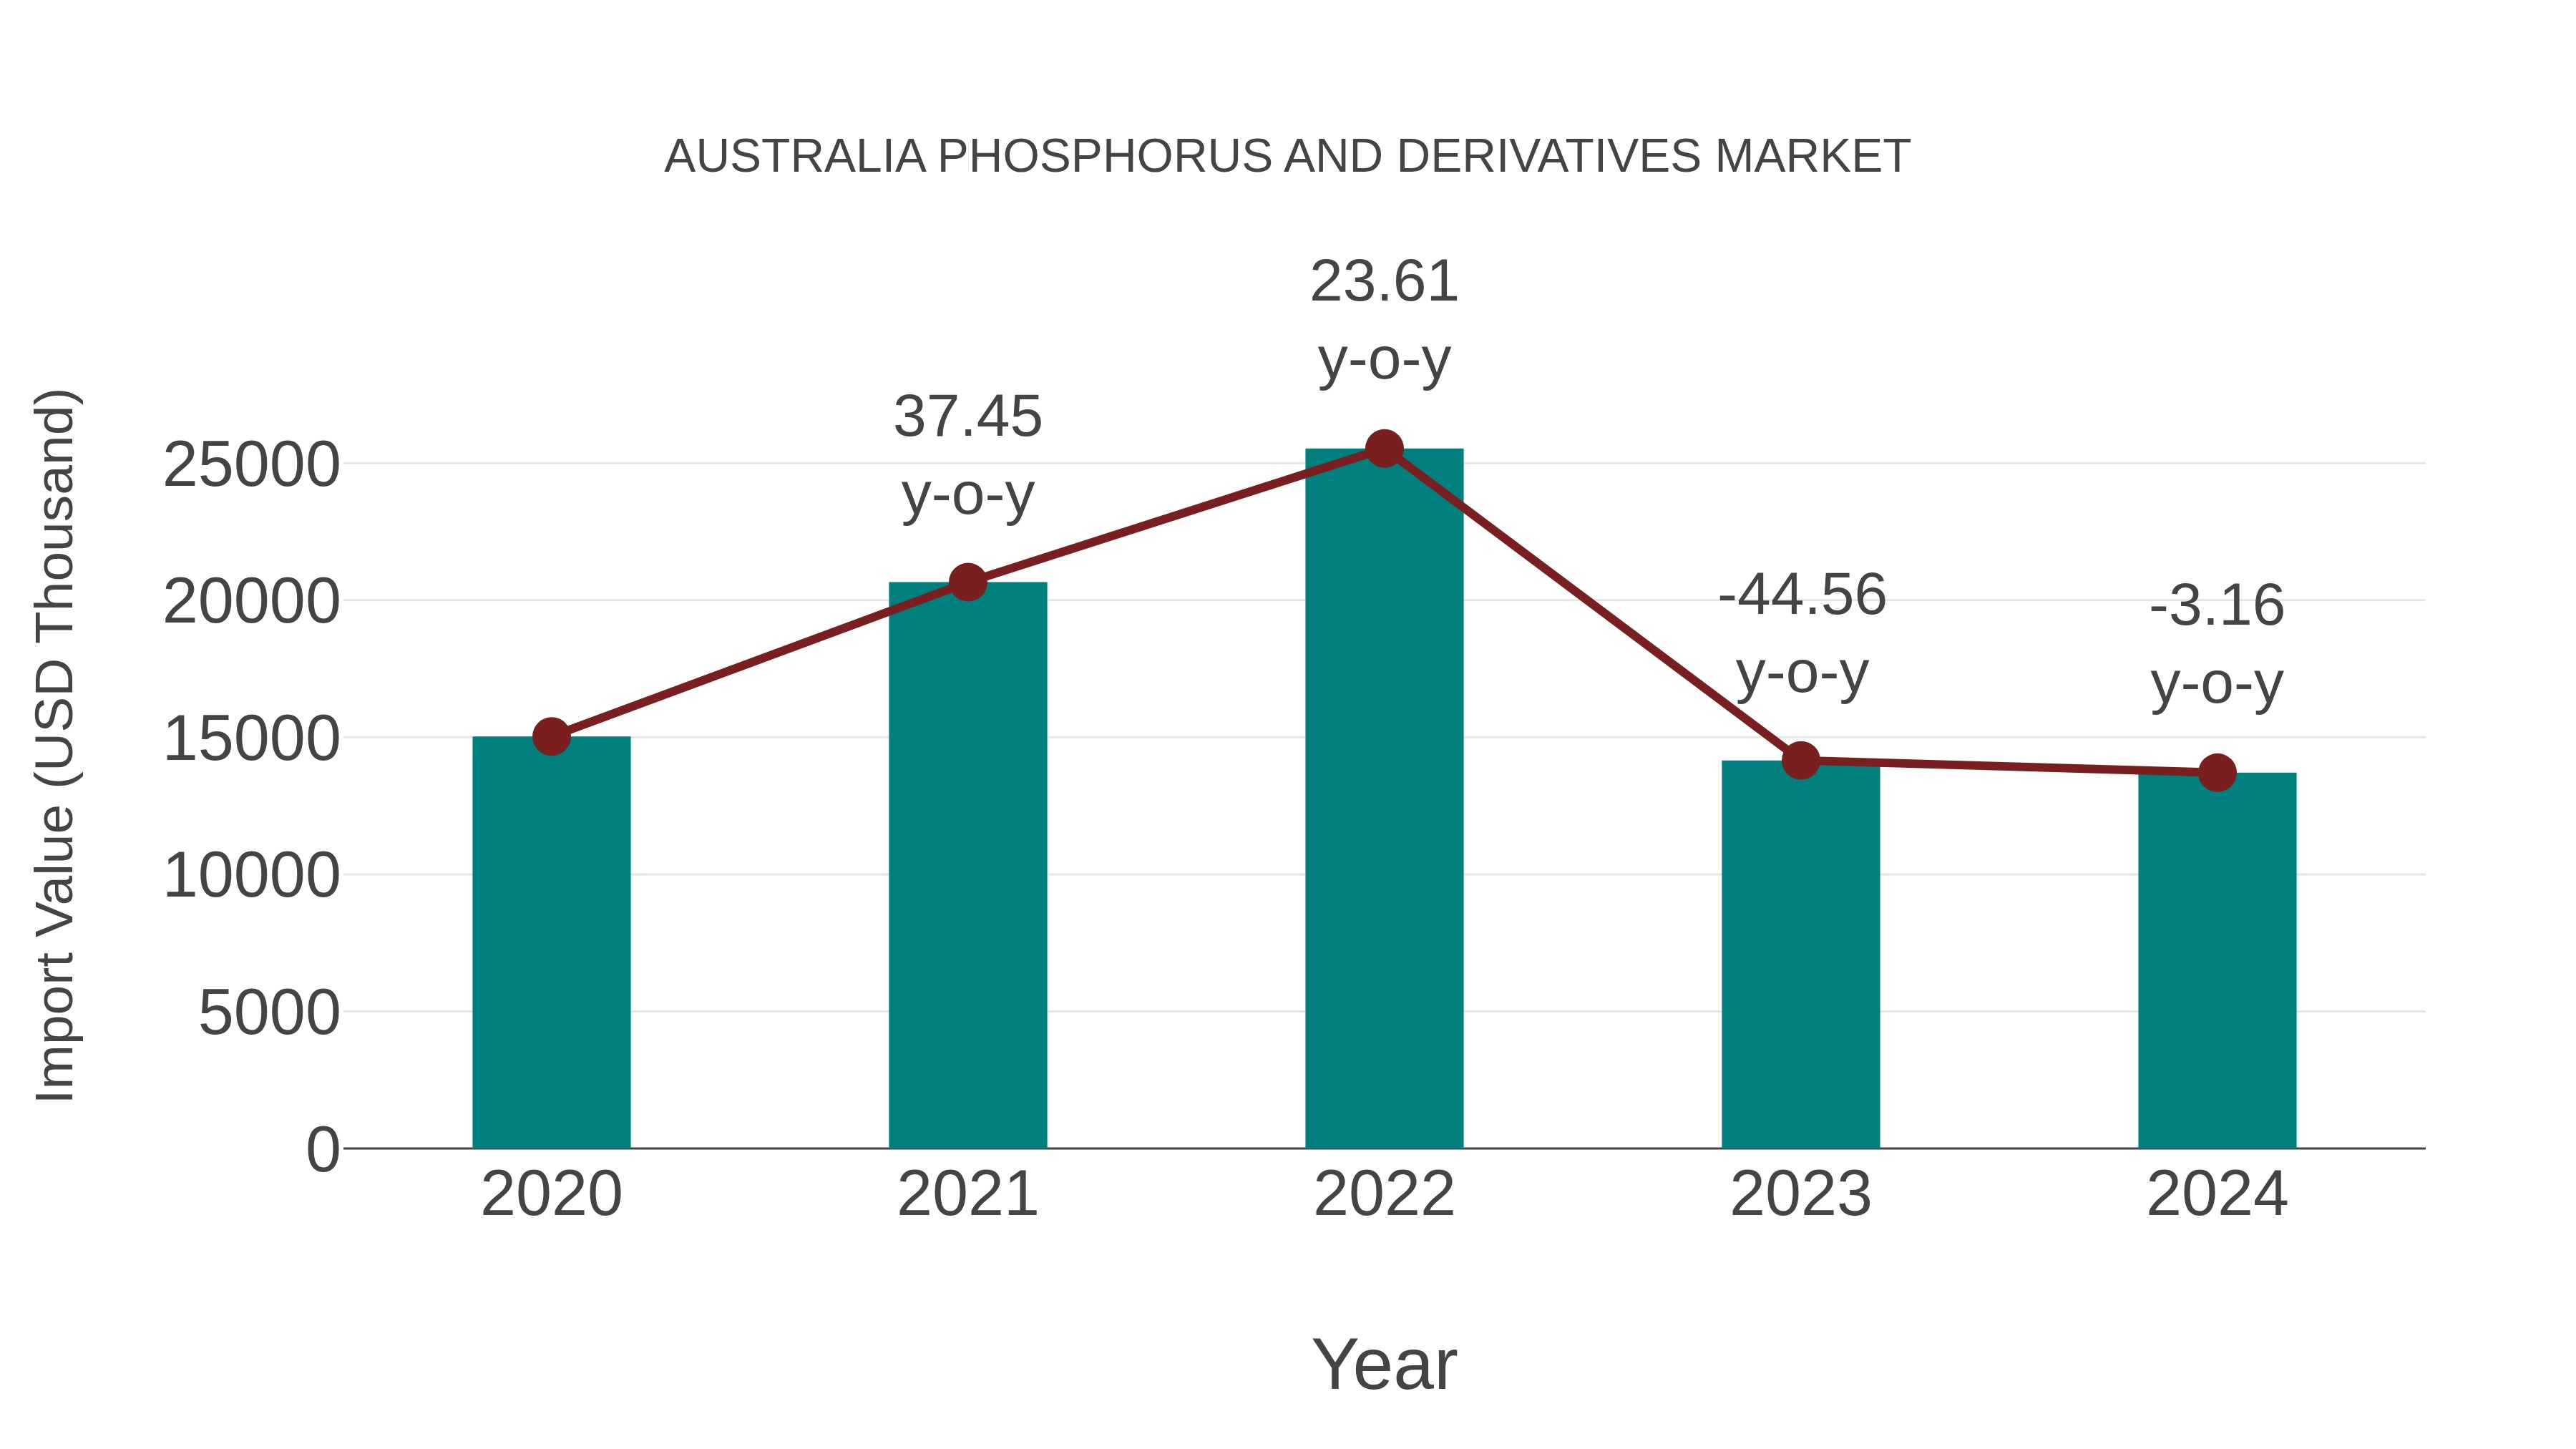
Australia Phosphorus and Derivatives Market: Import Trend Analysis
In the Australia phosphorus and derivatives market, the import trend experienced a decline with a growth rate of -3.16% from 2023 to 2024 and a compound annual growth rate (CAGR) of -2.27% for the period 2020-2024. This negative momentum can be attributed to shifts in demand dynamics or changes in trade policies affecting market stability.
Australia Phosphorus And Derivatives Market Synopsis
The phosphorus and derivatives market in Australia is essential for agriculture, food, and industrial applications. Phosphorus-based fertilizers dominate demand, while phosphoric acid and phosphates are used in food additives, detergents, and pharmaceuticals. Market dynamics are influenced by global phosphate rock availability and the shift towards sustainable phosphorus recovery methods.
Drivers of the market
The phosphorus and derivatives market in Australia is experiencing steady growth due to their widespread applications in agriculture, food, and industrial sectors. The rising demand for phosphate-based fertilizers is a key driver of the market, while applications in pharmaceuticals and water treatment also contribute to its expansion. Sustainable mining practices and regulatory policies play a crucial role in shaping the supply chain and overall market stability.
Challenges of the market
The phosphorus and derivatives market in Australia struggles with raw material supply constraints, as phosphorus is not abundantly available in the country. Dependence on imports exposes the market to price fluctuations and international trade restrictions. Environmental concerns regarding phosphorus runoff from fertilizers also lead to strict regulatory controls, increasing costs for agricultural and industrial users. Additionally, competition from alternative chemical compounds in industrial applications affects demand stability.
Investment opportunities in the Market
Phosphorus and its derivatives are vital in agriculture, pharmaceuticals, and industrial applications, creating investment opportunities in phosphorus mining, chemical processing, and fertilizer production. Advanced phosphorus-based products, including flame retardants and food additives, offer additional revenue streams.
Government Policy of the market
The phosphorus and derivatives market in Australia is regulated under mining, chemical safety, and agricultural policies. The government enforces strict environmental laws on phosphorus extraction to prevent soil and water contamination. Quality control measures ensure that phosphorus-based products meet agricultural and industrial safety standards. Trade policies oversee the import and export of phosphorus and its derivatives, aligning with global market regulations. Additionally, research funding is allocated to explore sustainable phosphorus sourcing and alternative applications.
Key Highlights of the Report:
- Australia Phosphorus and Derivatives Market Outlook
- Market Size of Australia Phosphorus and Derivatives Market, 2025
- Forecast of Australia Phosphorus and Derivatives Market, 2032
- Historical Data and Forecast of Australia Phosphorus and Derivatives Revenues & Volume for the Period 2022-2032F
- Australia Phosphorus and Derivatives Market Trend Evolution
- Australia Phosphorus and Derivatives Market Drivers and Challenges
- Australia Phosphorus and Derivatives Price Trends
- Australia Phosphorus and Derivatives Porter's Five Forces
- Australia Phosphorus and Derivatives Industry Life Cycle
- Historical Data and Forecast of Australia Phosphorus and Derivatives Market Revenues & Volume By Product Type for the Period 2022-2032F
- Historical Data and Forecast of Australia Phosphorus and Derivatives Market Revenues & Volume By Ammonium Phosphates for the Period 2022-2032F
- Historical Data and Forecast of Australia Phosphorus and Derivatives Market Revenues & Volume By Industrial Phosphates for the Period 2022-2032F
- Historical Data and Forecast of Australia Phosphorus and Derivatives Market Revenues & Volume By Purified Phosphoric Acid for the Period 2022-2032F
- Historical Data and Forecast of Australia Phosphorus and Derivatives Market Revenues & Volume By Phosphorus Chloride for the Period 2022-2032F
- Historical Data and Forecast of Australia Phosphorus and Derivatives Market Revenues & Volume By Phosphorus Pentoxide for the Period 2022-2032F
- Historical Data and Forecast of Australia Phosphorus and Derivatives Market Revenues & Volume By Phosphorus Pentasulfide for the Period 2022-2032F
- Historical Data and Forecast of Australia Phosphorus and Derivatives Market Revenues & Volume By Application for the Period 2022-2032F
- Historical Data and Forecast of Australia Phosphorus and Derivatives Market Revenues & Volume By Fertilizers for the Period 2022-2032F
- Historical Data and Forecast of Australia Phosphorus and Derivatives Market Revenues & Volume By Detergents for the Period 2022-2032F
- Historical Data and Forecast of Australia Phosphorus and Derivatives Market Revenues & Volume By Food Industry for the Period 2022-2032F
- Historical Data and Forecast of Australia Phosphorus and Derivatives Market Revenues & Volume By Water Treatment Chemicals for the Period 2022-2032F
- Historical Data and Forecast of Australia Phosphorus and Derivatives Market Revenues & Volume By Metal Finishing for the Period 2022-2032F
- Historical Data and Forecast of Australia Phosphorus and Derivatives Market Revenues & Volume By Flame Retardant Material for the Period 2022-2032F
- Australia Phosphorus and Derivatives Import Export Trade Statistics
- Market Opportunity Assessment By Product Type
- Market Opportunity Assessment By Application
- Australia Phosphorus and Derivatives Top Companies Market Share
- Australia Phosphorus and Derivatives Competitive Benchmarking By Technical and Operational Parameters
- Australia Phosphorus and Derivatives Company Profiles
- Australia Phosphorus and Derivatives Key Strategic Recommendations
Australia Phosphorus and Derivatives Market (2026-2032): FAQs
6Wresearch actively monitors the Australia Phosphorus and Derivatives Market and publishes its comprehensive annual report, highlighting emerging trends, growth drivers, revenue analysis, and forecast outlook. Our insights help businesses to make data-backed strategic decisions with ongoing market dynamics. Our analysts track relevent industries related to the Australia Phosphorus and Derivatives Market, allowing our clients with actionable intelligence and reliable forecasts tailored to emerging regional needs.
Yes, we provide customisation as per your requirements. To learn more, feel free to contact us on sales@6wresearch.com
1 Executive Summary |
2 Introduction |
2.1 Key Highlights of the Report |
2.2 Report Description |
2.3 Market Scope & Segmentation |
2.4 Research Methodology |
2.5 Assumptions |
3 Australia Phosphorus and Derivatives Market Overview |
3.1 Australia Country Macro Economic Indicators |
3.2 Australia Phosphorus and Derivatives Market Revenues & Volume, 2022 & 2032F |
3.3 Australia Phosphorus and Derivatives Market - Industry Life Cycle |
3.4 Australia Phosphorus and Derivatives Market - Porter's Five Forces |
3.5 Australia Phosphorus and Derivatives Market Revenues & Volume Share, By Product Type, 2022 & 2032F |
3.6 Australia Phosphorus and Derivatives Market Revenues & Volume Share, By Application, 2022 & 2032F |
4 Australia Phosphorus and Derivatives Market Dynamics |
4.1 Impact Analysis |
4.2 Market Drivers |
4.2.1 Increasing demand for fertilizers in the agriculture sector |
4.2.2 Growing awareness about the benefits of phosphorus-based products in crop production |
4.2.3 Technological advancements leading to the development of innovative phosphorus derivatives |
4.3 Market Restraints |
4.3.1 Fluctuating prices of raw materials used in phosphorus and derivatives production |
4.3.2 Environmental regulations impacting the usage of phosphorus-based products |
4.3.3 Competition from alternative products or substitutes in the market |
5 Australia Phosphorus and Derivatives Market Trends |
6 Australia Phosphorus and Derivatives Market, By Types |
6.1 Australia Phosphorus and Derivatives Market, By Product Type |
6.1.1 Overview and Analysis |
6.1.2 Australia Phosphorus and Derivatives Market Revenues & Volume, By Product Type, 2022-2032F |
6.1.3 Australia Phosphorus and Derivatives Market Revenues & Volume, By Ammonium Phosphates, 2022-2032F |
6.1.4 Australia Phosphorus and Derivatives Market Revenues & Volume, By Industrial Phosphates, 2022-2032F |
6.1.5 Australia Phosphorus and Derivatives Market Revenues & Volume, By Purified Phosphoric Acid, 2022-2032F |
6.1.6 Australia Phosphorus and Derivatives Market Revenues & Volume, By Phosphorus Chloride, 2022-2032F |
6.1.7 Australia Phosphorus and Derivatives Market Revenues & Volume, By Phosphorus Pentoxide, 2022-2032F |
6.1.8 Australia Phosphorus and Derivatives Market Revenues & Volume, By Phosphorus Pentasulfide, 2022-2032F |
6.2 Australia Phosphorus and Derivatives Market, By Application |
6.2.1 Overview and Analysis |
6.2.2 Australia Phosphorus and Derivatives Market Revenues & Volume, By Fertilizers, 2022-2032F |
6.2.3 Australia Phosphorus and Derivatives Market Revenues & Volume, By Detergents, 2022-2032F |
6.2.4 Australia Phosphorus and Derivatives Market Revenues & Volume, By Food Industry, 2022-2032F |
6.2.5 Australia Phosphorus and Derivatives Market Revenues & Volume, By Water Treatment Chemicals, 2022-2032F |
6.2.6 Australia Phosphorus and Derivatives Market Revenues & Volume, By Metal Finishing, 2022-2032F |
6.2.7 Australia Phosphorus and Derivatives Market Revenues & Volume, By Flame Retardant Material, 2022-2032F |
7 Australia Phosphorus and Derivatives Market Import-Export Trade Statistics |
7.1 Australia Phosphorus and Derivatives Market Export to Major Countries |
7.2 Australia Phosphorus and Derivatives Market Imports from Major Countries |
8 Australia Phosphorus and Derivatives Market Key Performance Indicators |
8.1 Research and development investment in phosphorus-based technologies |
8.2 Adoption rate of phosphorus derivatives in agriculture practices |
8.3 Number of patents filed for innovative phosphorus products |
8.4 Environmental sustainability initiatives in phosphorus production |
8.5 Market acceptance of phosphorus-based solutions in non-agricultural sectors |
9 Australia Phosphorus and Derivatives Market - Opportunity Assessment |
9.1 Australia Phosphorus and Derivatives Market Opportunity Assessment, By Product Type, 2022 & 2032F |
9.2 Australia Phosphorus and Derivatives Market Opportunity Assessment, By Application, 2022 & 2032F |
10 Australia Phosphorus and Derivatives Market - Competitive Landscape |
10.1 Australia Phosphorus and Derivatives Market Revenue Share, By Companies, 2025 |
10.2 Australia Phosphorus and Derivatives Market Competitive Benchmarking, By Operating and Technical Parameters |
11 Company Profiles |
12 Recommendations |
13 Disclaimer |
Export potential assessment - trade Analytics for 2030
Export potential enables firms to identify high-growth global markets with greater confidence by combining advanced trade intelligence with a structured quantitative methodology. The framework analyzes emerging demand trends and country-level import patterns while integrating macroeconomic and trade datasets such as GDP and population forecasts, bilateral import–export flows, tariff structures, elasticity differentials between developed and developing economies, geographic distance, and import demand projections. Using weighted trade values from 2020–2024 as the base period to project country-to-country export potential for 2030, these inputs are operationalized through calculated drivers such as gravity model parameters, tariff impact factors, and projected GDP per-capita growth. Through an analysis of hidden potentials, demand hotspots, and market conditions that are most favorable to success, this method enables firms to focus on target countries, maximize returns, and global expansion with data, backed by accuracy.
By factoring in the projected importer demand gap that is currently unmet and could be potential opportunity, it identifies the potential for the Exporter (Country) among 190 countries, against the general trade analysis, which identifies the biggest importer or exporter.
To discover high-growth global markets and optimize your business strategy:
Click Here
Pricing
- Single User License$ 1,995
- Department License$ 2,400
- Site License$ 3,120
- Global License$ 3,795

Search
Thought Leadership and Analyst Meet


Our Clients
Latest Reports
- Taiwan Food Delivery Platform Market (2026-2032) | Companies, Outlook, Analysis, Trends, Value, Revenue, Segmentation, Share, Forecast, Competitive Landscape, Growth, Size & Forecast
- United Kingdom (UK) Long-term Care Insurance Market (2026-2032) | Growth, Share, Consumer Insights, Drivers, Opportunities, Competition, Pricing Analysis, Segments, Restraints, Companies, Competitive, Value, Outlook, Size, Demand, Analysis, Challenges, Strategic Insights, Investment Trends, Revenue, Trends, Supply, Forecast
- United Kingdom (UK) Long Term Care Market (2026-2032) | Companies, Outlook, Analysis, Trends, Value, Revenue, Segmentation, Share, Forecast, Competitive Landscape, Growth, Size & Forecast
- Iraq Insulation and Waterproofing Market (2026-2032) | Outlook, Drivers, Growth, Size, Share, Industry, Revenue, Trends, Demand, Competitive, Strategic Insights, Opportunities, Segments, Companies, Challenges, Strategy, Consumer Insights, Analysis, Investment Trends, Value, Segmentation, Forecast, Restraints
- India Switchgear Market Outlook (2026-2032) | Size, Share, Trends, Growth, Revenue, Forecast, Analysis, Value, Outlook
- Pakistan Contraceptive Implants Market (2025-2031) | Demand, Growth, Size, Share, Industry, Pricing Analysis, Competitive, Strategic Insights, Strategy, Consumer Insights, Analysis, Investment Trends, Opportunities, Revenue, Segments, Value, Segmentation, Supply, Forecast, Restraints, Outlook, Competition, Drivers, Trends, Companies, Challenges
- Sri Lanka Packaging Market (2026-2032) | Outlook, Competition, Drivers, Trends, Demand, Pricing Analysis, Competitive, Strategic Insights, Companies, Challenges, Strategy, Consumer Insights, Analysis, Investment Trends, Opportunities, Growth, Size, Share, Industry, Revenue, Segments, Value, Segmentation, Supply, Forecast, Restraints
- India Kids Watches Market (2026-2032) | Strategy, Consumer Insights, Analysis, Investment Trends, Opportunities, Growth, Size, Share, Industry, Revenue, Segments, Value, Segmentation, Supply, Forecast, Restraints, Outlook, Competition, Drivers, Trends, Demand, Pricing Analysis, Competitive, Strategic Insights, Companies, Challenges
- Saudi Arabia Core Assurance Service Market (2025-2031) | Strategy, Consumer Insights, Analysis, Investment Trends, Opportunities, Growth, Size, Share, Industry, Revenue, Segments, Value, Segmentation, Supply, Forecast, Restraints, Outlook, Competition, Drivers, Trends, Demand, Pricing Analysis, Competitive, Strategic Insights, Companies, Challenges
- Romania Uninterruptible Power Supply (UPS) Market (2026-2032) | Industry, Analysis, Revenue, Size, Forecast, Outlook, Value, Trends, Share, Growth & Companies
Industry Events and Analyst Meet

India EV Show 2026

EV tech India Expo 2026

Auto Tech Asia 2026

Battery Tech India 2026

Smart Production Solutions Guangzhou 2026
Whitepaper
- Middle East & Africa Commercial Security Market Click here to view more.
- Middle East & Africa Fire Safety Systems & Equipment Market Click here to view more.
- GCC Drone Market Click here to view more.
- Middle East Lighting Fixture Market Click here to view more.
- GCC Physical & Perimeter Security Market Click here to view more.
6WResearch In News
- Doha a strategic location for EV manufacturing hub: IPA Qatar
- Demand for luxury TVs surging in the GCC, says Samsung
- Empowering Growth: The Thriving Journey of Bangladesh’s Cable Industry
- Demand for luxury TVs surging in the GCC, says Samsung
- Video call with a traditional healer? Once unthinkable, it’s now common in South Africa
- Intelligent Buildings To Smooth GCC’s Path To Net Zero