Australia Protective Clothing Market (2026-2032) Outlook | Trends, Share, Forecast, Analysis, Companies, Growth, Revenue, Size, Value & Industry
Market Forecast By Material Type (Aramid & Blends, Polyolefins & Blends, Polyamide, Pbi, Uhmw Pe, Cotton Fibers, Laminated Polyesters, Others), By Application (Thermal, Chemical, Mechanical, Biological/radiation, Visibility, Others), By End-use (Oil & Gas, Construction, Manufacturing, Healthcare/medical, Firefighting & Law Enforcement, Mining, Military, Warehouse & Logistics) And Competitive Landscape
| Product Code: ETC275615 | Publication Date: Aug 2022 | Updated Date: Mar 2026 | Product Type: Market Research Report | |
| Publisher: 6Wresearch | Author: Ravi Bhandari | No. of Pages: 75 | No. of Figures: 35 | No. of Tables: 20 |
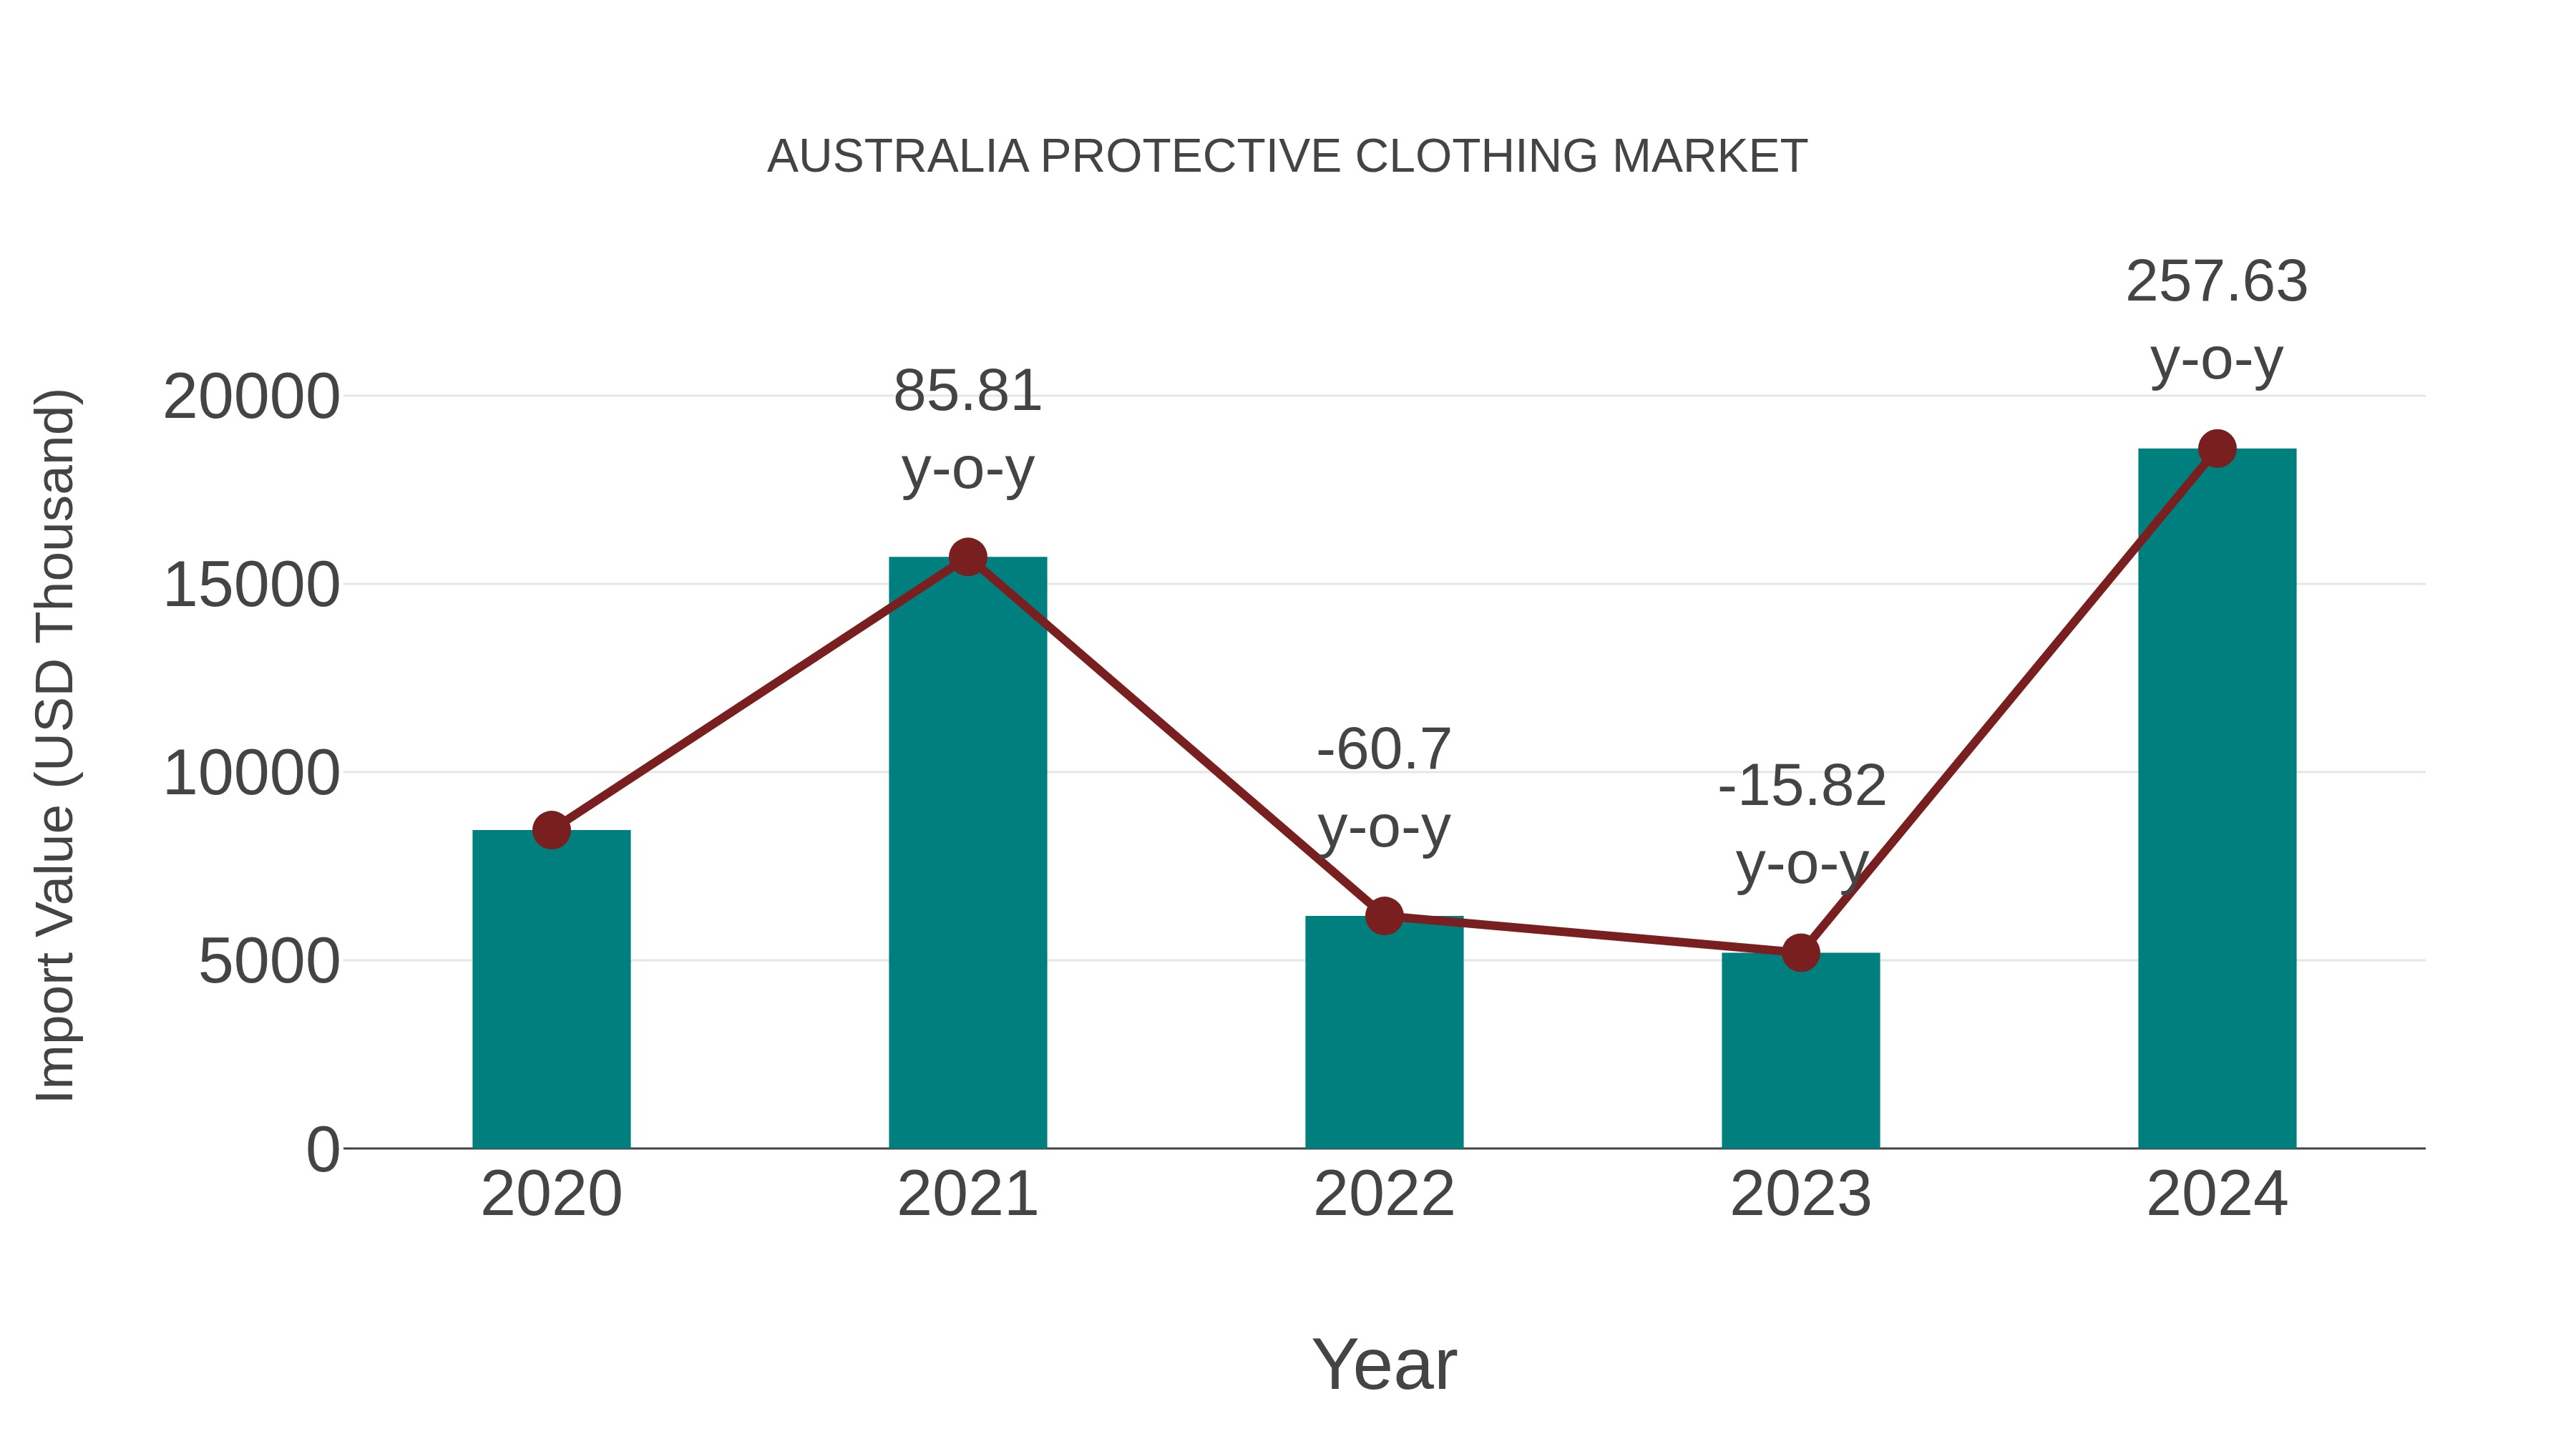
Australia Protective Clothing Market: Import Trend Analysis
In the Australia protective clothing market, the import trend showed a significant growth rate of 257.63% from 2023 to 2024, with a compound annual growth rate (CAGR) of 21.77% from 2020 to 2024. This surge can be attributed to a notable demand shift towards higher-quality protective gear, potentially influenced by evolving safety regulations or increased awareness of workplace safety standards.
Australia Protective Clothing Market Synopsis
Australia`s protective clothing market is expanding due to increasing workplace safety regulations in industries such as construction, mining, healthcare, and manufacturing. Demand for fire-resistant, chemical-resistant, and high-visibility clothing is on the rise, with advancements in material technology enhancing durability and comfort. The pandemic has also driven demand for personal protective equipment (PPE) in the healthcare sector.
Drivers of the market
The increasing emphasis on workplace safety regulations and the growth of hazardous industries such as mining, construction, and manufacturing are key drivers of the protective clothing market in Australia. The rising awareness of personal protective equipment (PPE) and innovations in high-performance protective fabrics further support market growth. Additionally, the demand for specialized protective clothing in healthcare and emergency response sectors is expanding market opportunities.
Challenges of the market
The demand for protective clothing in Australia is strong, but challenges arise from high production costs, compliance with safety standards, and competition from international manufacturers offering lower-priced alternatives. Sustainability concerns also pressure companies to develop eco-friendly materials.
Investment opportunities in the Market
With increasing awareness of workplace safety and regulatory requirements, the protective clothing market in Australia is witnessing steady growth. The expansion of industries such as construction, mining, and healthcare is driving demand for high-quality protective gear. Investors can tap into opportunities in manufacturing flame-resistant, chemical-resistant, and high-visibility clothing. Additionally, innovations in lightweight and breathable materials are reshaping the market, offering scope for R&D investments.
Government Policy of the market
Workplace safety regulations under Safe Work Australia drive the demand for protective clothing. Government policies ensure that manufacturers comply with Australian safety standards, particularly in high-risk industries like mining, construction, and healthcare. There are also incentives for innovation in fire-resistant and antimicrobial protective wear.
Key Highlights of the Report:
- Australia Protective Clothing Market Outlook
- Market Size of Australia Protective Clothing Market, 2025
- Forecast of Australia Protective Clothing Market, 2032
- Historical Data and Forecast of Australia Protective Clothing Revenues & Volume for the Period 2022-2032F
- Australia Protective Clothing Market Trend Evolution
- Australia Protective Clothing Market Drivers and Challenges
- Australia Protective Clothing Price Trends
- Australia Protective Clothing Porter's Five Forces
- Australia Protective Clothing Industry Life Cycle
- Historical Data and Forecast of Australia Protective Clothing Market Revenues & Volume By Material Type for the Period 2022-2032F
- Historical Data and Forecast of Australia Protective Clothing Market Revenues & Volume By Aramid & Blends for the Period 2022-2032F
- Historical Data and Forecast of Australia Protective Clothing Market Revenues & Volume By Polyolefins & Blends for the Period 2022-2032F
- Historical Data and Forecast of Australia Protective Clothing Market Revenues & Volume By Polyamide for the Period 2022-2032F
- Historical Data and Forecast of Australia Protective Clothing Market Revenues & Volume By Pbi for the Period 2022-2032F
- Historical Data and Forecast of Australia Protective Clothing Market Revenues & Volume By Uhmw Pe for the Period 2022-2032F
- Historical Data and Forecast of Australia Protective Clothing Market Revenues & Volume By Cotton Fibers for the Period 2022-2032F
- Historical Data and Forecast of Australia Protective Clothing Market Revenues & Volume By Laminated Polyesters for the Period 2022-2032F
- Historical Data and Forecast of Australia Aramid & Blends Protective Clothing Market Revenues & Volume By Others for the Period 2022-2032F
- Historical Data and Forecast of Australia Protective Clothing Market Revenues & Volume By Application for the Period 2022-2032F
- Historical Data and Forecast of Australia Protective Clothing Market Revenues & Volume By Thermal for the Period 2022-2032F
- Historical Data and Forecast of Australia Protective Clothing Market Revenues & Volume By Chemical for the Period 2022-2032F
- Historical Data and Forecast of Australia Protective Clothing Market Revenues & Volume By Mechanical for the Period 2022-2032F
- Historical Data and Forecast of Australia Protective Clothing Market Revenues & Volume By Biological/radiation for the Period 2022-2032F
- Historical Data and Forecast of Australia Protective Clothing Market Revenues & Volume By Visibility for the Period 2022-2032F
- Historical Data and Forecast of Australia Protective Clothing Market Revenues & Volume By Others for the Period 2022-2032F
- Historical Data and Forecast of Australia Protective Clothing Market Revenues & Volume By End-use for the Period 2022-2032F
- Historical Data and Forecast of Australia Protective Clothing Market Revenues & Volume By Oil & Gas for the Period 2022-2032F
- Historical Data and Forecast of Australia Protective Clothing Market Revenues & Volume By Construction for the Period 2022-2032F
- Historical Data and Forecast of Australia Protective Clothing Market Revenues & Volume By Manufacturing for the Period 2022-2032F
- Historical Data and Forecast of Australia Protective Clothing Market Revenues & Volume By Healthcare/medical for the Period 2022-2032F
- Historical Data and Forecast of Australia Protective Clothing Market Revenues & Volume By Firefighting & Law Enforcement for the Period 2022-2032F
- Historical Data and Forecast of Australia Protective Clothing Market Revenues & Volume By Mining for the Period 2022-2032F
- Historical Data and Forecast of Australia Protective Clothing Market Revenues & Volume By Military for the Period 2022-2032F
- Historical Data and Forecast of Australia Protective Clothing Market Revenues & Volume By Warehouse & Logistics for the Period 2022-2032F
- Australia Protective Clothing Import Export Trade Statistics
- Market Opportunity Assessment By Material Type
- Market Opportunity Assessment By Application
- Market Opportunity Assessment By End-use
- Australia Protective Clothing Top Companies Market Share
- Australia Protective Clothing Competitive Benchmarking By Technical and Operational Parameters
- Australia Protective Clothing Company Profiles
- Australia Protective Clothing Key Strategic Recommendations
Australia Protective Clothing Market (2026-2032): FAQs
6Wresearch actively monitors the Australia Protective Clothing Market and publishes its comprehensive annual report, highlighting emerging trends, growth drivers, revenue analysis, and forecast outlook. Our insights help businesses to make data-backed strategic decisions with ongoing market dynamics. Our analysts track relevent industries related to the Australia Protective Clothing Market, allowing our clients with actionable intelligence and reliable forecasts tailored to emerging regional needs.
Yes, we provide customisation as per your requirements. To learn more, feel free to contact us on sales@6wresearch.com
1 Executive Summary |
2 Introduction |
2.1 Key Highlights of the Report |
2.2 Report Description |
2.3 Market Scope & Segmentation |
2.4 Research Methodology |
2.5 Assumptions |
3 Australia Protective Clothing Market Overview |
3.1 Australia Country Macro Economic Indicators |
3.2 Australia Protective Clothing Market Revenues & Volume, 2022 & 2032F |
3.3 Australia Protective Clothing Market - Industry Life Cycle |
3.4 Australia Protective Clothing Market - Porter's Five Forces |
3.5 Australia Protective Clothing Market Revenues & Volume Share, By Material Type, 2022 & 2032F |
3.6 Australia Protective Clothing Market Revenues & Volume Share, By Application, 2022 & 2032F |
3.7 Australia Protective Clothing Market Revenues & Volume Share, By End-use, 2022 & 2032F |
4 Australia Protective Clothing Market Dynamics |
4.1 Impact Analysis |
4.2 Market Drivers |
4.2.1 Increasing awareness about workplace safety regulations in Australia |
4.2.2 Growing demand for protective clothing in industries such as mining, construction, and healthcare |
4.2.3 Technological advancements leading to the development of innovative and high-performance protective clothing |
4.3 Market Restraints |
4.3.1 Fluctuations in raw material prices impacting the cost of protective clothing production |
4.3.2 Intense competition among market players leading to pricing pressures |
4.3.3 Lack of standardized regulations across different industries affecting the adoption of protective clothing |
5 Australia Protective Clothing Market Trends |
6 Australia Protective Clothing Market, By Types |
6.1 Australia Protective Clothing Market, By Material Type |
6.1.1 Overview and Analysis |
6.1.2 Australia Protective Clothing Market Revenues & Volume, By Material Type, 2022-2032F |
6.1.3 Australia Protective Clothing Market Revenues & Volume, By Aramid & Blends, 2022-2032F |
6.1.4 Australia Protective Clothing Market Revenues & Volume, By Polyolefins & Blends, 2022-2032F |
6.1.5 Australia Protective Clothing Market Revenues & Volume, By Polyamide, 2022-2032F |
6.1.6 Australia Protective Clothing Market Revenues & Volume, By Pbi, 2022-2032F |
6.1.7 Australia Protective Clothing Market Revenues & Volume, By Uhmw Pe, 2022-2032F |
6.1.8 Australia Protective Clothing Market Revenues & Volume, By Cotton Fibers, 2022-2032F |
6.1.9 Australia Protective Clothing Market Revenues & Volume, By Others, 2022-2032F |
6.1.10 Australia Protective Clothing Market Revenues & Volume, By Others, 2022-2032F |
6.2 Australia Protective Clothing Market, By Application |
6.2.1 Overview and Analysis |
6.2.2 Australia Protective Clothing Market Revenues & Volume, By Thermal, 2022-2032F |
6.2.3 Australia Protective Clothing Market Revenues & Volume, By Chemical, 2022-2032F |
6.2.4 Australia Protective Clothing Market Revenues & Volume, By Mechanical, 2022-2032F |
6.2.5 Australia Protective Clothing Market Revenues & Volume, By Biological/radiation, 2022-2032F |
6.2.6 Australia Protective Clothing Market Revenues & Volume, By Visibility, 2022-2032F |
6.2.7 Australia Protective Clothing Market Revenues & Volume, By Others, 2022-2032F |
6.3 Australia Protective Clothing Market, By End-use |
6.3.1 Overview and Analysis |
6.3.2 Australia Protective Clothing Market Revenues & Volume, By Oil & Gas, 2022-2032F |
6.3.3 Australia Protective Clothing Market Revenues & Volume, By Construction, 2022-2032F |
6.3.4 Australia Protective Clothing Market Revenues & Volume, By Manufacturing, 2022-2032F |
6.3.5 Australia Protective Clothing Market Revenues & Volume, By Healthcare/medical, 2022-2032F |
6.3.6 Australia Protective Clothing Market Revenues & Volume, By Firefighting & Law Enforcement, 2022-2032F |
6.3.7 Australia Protective Clothing Market Revenues & Volume, By Mining, 2022-2032F |
6.3.8 Australia Protective Clothing Market Revenues & Volume, By Warehouse & Logistics, 2022-2032F |
6.3.9 Australia Protective Clothing Market Revenues & Volume, By Warehouse & Logistics, 2022-2032F |
7 Australia Protective Clothing Market Import-Export Trade Statistics |
7.1 Australia Protective Clothing Market Export to Major Countries |
7.2 Australia Protective Clothing Market Imports from Major Countries |
8 Australia Protective Clothing Market Key Performance Indicators |
8.1 Number of workplace accidents reported annually in industries requiring protective clothing |
8.2 Percentage of companies compliant with safety regulations regarding the use of protective clothing |
8.3 Investment in research and development for new protective clothing technologies |
8.4 Rate of adoption of sustainable and eco-friendly materials in protective clothing manufacturing |
8.5 Frequency of product recalls or safety incidents related to protective clothing |
9 Australia Protective Clothing Market - Opportunity Assessment |
9.1 Australia Protective Clothing Market Opportunity Assessment, By Material Type, 2022 & 2032F |
9.2 Australia Protective Clothing Market Opportunity Assessment, By Application, 2022 & 2032F |
9.3 Australia Protective Clothing Market Opportunity Assessment, By End-use, 2022 & 2032F |
10 Australia Protective Clothing Market - Competitive Landscape |
10.1 Australia Protective Clothing Market Revenue Share, By Companies, 2025 |
10.2 Australia Protective Clothing Market Competitive Benchmarking, By Operating and Technical Parameters |
11 Company Profiles |
12 Recommendations |
13 Disclaimer |
Export potential assessment - trade Analytics for 2030
Export potential enables firms to identify high-growth global markets with greater confidence by combining advanced trade intelligence with a structured quantitative methodology. The framework analyzes emerging demand trends and country-level import patterns while integrating macroeconomic and trade datasets such as GDP and population forecasts, bilateral import–export flows, tariff structures, elasticity differentials between developed and developing economies, geographic distance, and import demand projections. Using weighted trade values from 2020–2024 as the base period to project country-to-country export potential for 2030, these inputs are operationalized through calculated drivers such as gravity model parameters, tariff impact factors, and projected GDP per-capita growth. Through an analysis of hidden potentials, demand hotspots, and market conditions that are most favorable to success, this method enables firms to focus on target countries, maximize returns, and global expansion with data, backed by accuracy.
By factoring in the projected importer demand gap that is currently unmet and could be potential opportunity, it identifies the potential for the Exporter (Country) among 190 countries, against the general trade analysis, which identifies the biggest importer or exporter.
To discover high-growth global markets and optimize your business strategy:
Click Here
Pricing
- Single User License$ 1,995
- Department License$ 2,400
- Site License$ 3,120
- Global License$ 3,795

Search
Thought Leadership and Analyst Meet


Our Clients
Latest Reports
- United Kingdom (UK) Long-term Care Insurance Market (2026-2032) | Growth, Share, Consumer Insights, Drivers, Opportunities, Competition, Pricing Analysis, Segments, Restraints, Companies, Competitive, Value, Outlook, Size, Demand, Analysis, Challenges, Strategic Insights, Investment Trends, Revenue, Trends, Supply, Forecast
- United Kingdom (UK) Long Term Care Market (2026-2032) | Companies, Outlook, Analysis, Trends, Value, Revenue, Segmentation, Share, Forecast, Competitive Landscape, Growth, Size & Forecast
- Iraq Insulation and Waterproofing Market (2026-2032) | Outlook, Drivers, Growth, Size, Share, Industry, Revenue, Trends, Demand, Competitive, Strategic Insights, Opportunities, Segments, Companies, Challenges, Strategy, Consumer Insights, Analysis, Investment Trends, Value, Segmentation, Forecast, Restraints
- India Switchgear Market Outlook (2026 - 2032) | Size, Share, Trends, Growth, Revenue, Forecast, Analysis, Value, Outlook
- Pakistan Contraceptive Implants Market (2025-2031) | Demand, Growth, Size, Share, Industry, Pricing Analysis, Competitive, Strategic Insights, Strategy, Consumer Insights, Analysis, Investment Trends, Opportunities, Revenue, Segments, Value, Segmentation, Supply, Forecast, Restraints, Outlook, Competition, Drivers, Trends, Companies, Challenges
- Sri Lanka Packaging Market (2026-2032) | Outlook, Competition, Drivers, Trends, Demand, Pricing Analysis, Competitive, Strategic Insights, Companies, Challenges, Strategy, Consumer Insights, Analysis, Investment Trends, Opportunities, Growth, Size, Share, Industry, Revenue, Segments, Value, Segmentation, Supply, Forecast, Restraints
- India Kids Watches Market (2026-2032) | Strategy, Consumer Insights, Analysis, Investment Trends, Opportunities, Growth, Size, Share, Industry, Revenue, Segments, Value, Segmentation, Supply, Forecast, Restraints, Outlook, Competition, Drivers, Trends, Demand, Pricing Analysis, Competitive, Strategic Insights, Companies, Challenges
- Saudi Arabia Core Assurance Service Market (2025-2031) | Strategy, Consumer Insights, Analysis, Investment Trends, Opportunities, Growth, Size, Share, Industry, Revenue, Segments, Value, Segmentation, Supply, Forecast, Restraints, Outlook, Competition, Drivers, Trends, Demand, Pricing Analysis, Competitive, Strategic Insights, Companies, Challenges
- Romania Uninterruptible Power Supply (UPS) Market (2026-2032) | Industry, Analysis, Revenue, Size, Forecast, Outlook, Value, Trends, Share, Growth & Companies
- Saudi Arabia Car Window Tinting Film, Paint Protection Film (PPF), and Ceramic Coating Market (2025-2031) | Strategy, Consumer Insights, Analysis, Investment Trends, Opportunities, Growth, Size, Share, Industry, Revenue, Segments, Value, Segmentation, Supply, Forecast, Restraints, Outlook, Competition, Drivers, Trends, Demand, Pricing Analysis, Competitive, Strategic Insights, Companies, Challenges
Industry Events and Analyst Meet

India EV Show 2026

EV tech India Expo 2026

Auto Tech Asia 2026

Battery Tech India 2026

Smart Production Solutions Guangzhou 2026
Whitepaper
- Middle East & Africa Commercial Security Market Click here to view more.
- Middle East & Africa Fire Safety Systems & Equipment Market Click here to view more.
- GCC Drone Market Click here to view more.
- Middle East Lighting Fixture Market Click here to view more.
- GCC Physical & Perimeter Security Market Click here to view more.
6WResearch In News
- Doha a strategic location for EV manufacturing hub: IPA Qatar
- Demand for luxury TVs surging in the GCC, says Samsung
- Empowering Growth: The Thriving Journey of Bangladesh’s Cable Industry
- Demand for luxury TVs surging in the GCC, says Samsung
- Video call with a traditional healer? Once unthinkable, it’s now common in South Africa
- Intelligent Buildings To Smooth GCC’s Path To Net Zero