Bahamas Digital Photo Frame Market (2026-2032) | Forecast, Segmentation, Industry, Share, Outlook, Analysis, Companies, Revenue, Value, Size, Trends & Growth
Market Forecast By Product Type (Pan Touch Control Frame, Remote Control Frame), By Size (Standard Frame (4:3), Widescreen Frame (16:9)), By Inch (Up to 7, Between 7 to 15, Above 15), By Power Source (Electricity Power Source, Battery Power Source), By Application (Residential, Commercial), By Distribution Channel (Online, Offline) And Competitive Landscape
| Product Code: ETC4796246 | Publication Date: Nov 2023 | Updated Date: Feb 2026 | Product Type: Market Research Report | |
| Publisher: 6Wresearch | Author: Sachin Kumar Rai | No. of Pages: 60 | No. of Figures: 30 | No. of Tables: 5 |
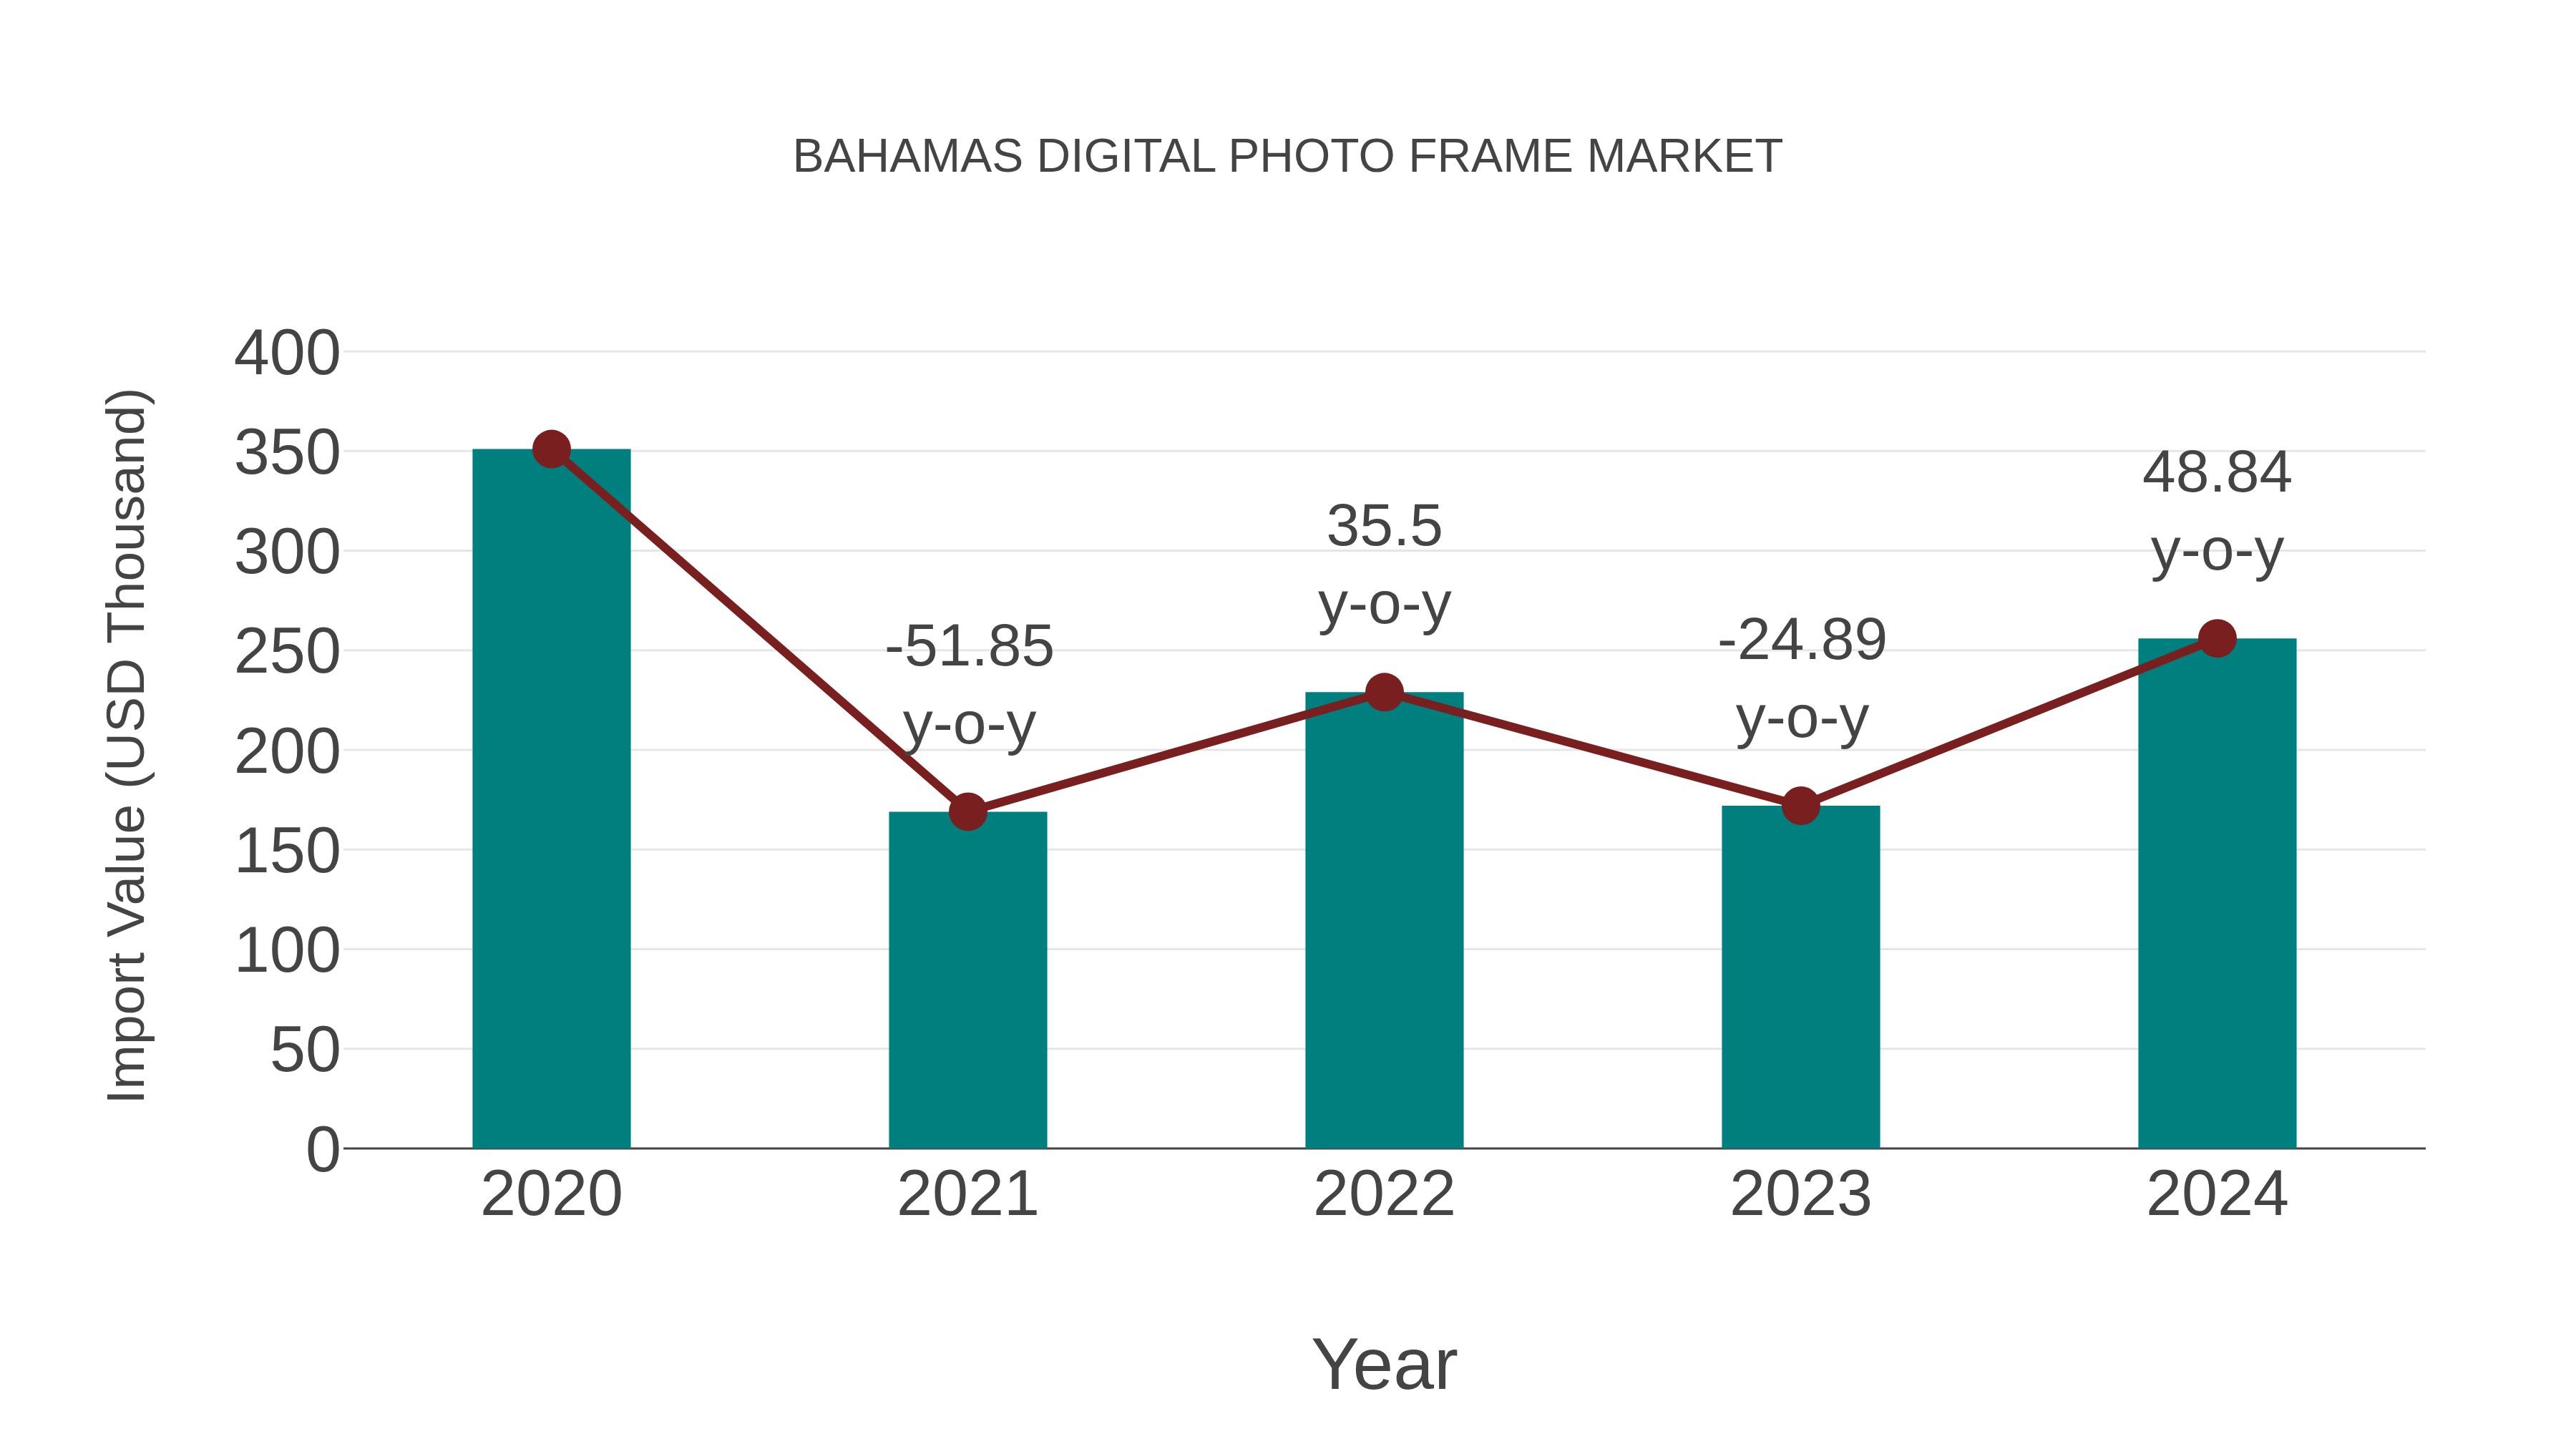
Bahamas Digital Photo Frame Market: Import Trend Analysis
The Bahamas digital photo frame market experienced a negative Compound Annual Growth Rate (CAGR) of -7.59% during 2020-2024. However, in 2023-2024, there was a year-on-year growth rate of 48.84%. This increase in imports in 2023-2024 helped offset the overall decline in the market during the entire period.
Bahamas Digital Photo Frame Market Overview
The Bahamas digital photo frame market is evolving with advancements in display technologies and connectivity options. Key trends include high-definition screens, wireless connectivity, and compatibility with social media platforms for easy photo sharing. Rising consumer demand for personalized digital experiences is fueling market growth, with manufacturers focusing on design aesthetics and user-friendly interfaces.
Drivers of the market
The Bahamas` Digital Photo Frame market is driven by the increasing popularity of digital media consumption and personalized visual content display solutions. Digital photo frames offer high-resolution displays, multimedia playback capabilities, and remote content management features. Rising consumer preference for digital photo sharing, smart home integration, and personalized gifting options contribute to the market growth of digital photo frames.
Challenges of the market
Challenges in the Bahamas` digital photo frame market involve consumer preference shifts towards multifunctional digital displays. Connectivity issues and compatibility with various image formats also impact market demand.
Government Policy of the market
The government supports the digital photo frame market through policies aimed at promoting digital media consumption and local manufacturing. Initiatives include tax incentives for photo frame manufacturers, subsidies for digital content creation, and regulations ensuring compatibility with international digital media standards.
Key Highlights of the Report:
- Bahamas Digital Photo Frame Market Outlook
- Market Size of Bahamas Digital Photo Frame Market, 2025
- Forecast of Bahamas Digital Photo Frame Market, 2032
- Historical Data and Forecast of Bahamas Digital Photo Frame Revenues & Volume for the Period 2022-2032F
- Bahamas Digital Photo Frame Market Trend Evolution
- Bahamas Digital Photo Frame Market Drivers and Challenges
- Bahamas Digital Photo Frame Price Trends
- Bahamas Digital Photo Frame Porter`s Five Forces
- Bahamas Digital Photo Frame Industry Life Cycle
- Historical Data and Forecast of Bahamas Digital Photo Frame Market Revenues & Volume By Product Type for the Period 2022-2032F
- Historical Data and Forecast of Bahamas Digital Photo Frame Market Revenues & Volume By Pan Touch Control Frame for the Period 2022-2032F
- Historical Data and Forecast of Bahamas Digital Photo Frame Market Revenues & Volume By Remote Control Frame for the Period 2022-2032F
- Historical Data and Forecast of Bahamas Digital Photo Frame Market Revenues & Volume By Size for the Period 2022-2032F
- Historical Data and Forecast of Bahamas Digital Photo Frame Market Revenues & Volume By Standard Frame (4:3) for the Period 2022-2032F
- Historical Data and Forecast of Bahamas Digital Photo Frame Market Revenues & Volume By Widescreen Frame (16:9) for the Period 2022-2032F
- Historical Data and Forecast of Bahamas Digital Photo Frame Market Revenues & Volume By Inch for the Period 2022-2032F
- Historical Data and Forecast of Bahamas Digital Photo Frame Market Revenues & Volume By Up to 7 for the Period 2022-2032F
- Historical Data and Forecast of Bahamas Digital Photo Frame Market Revenues & Volume By Between 7 to 15 for the Period 2022-2032F
- Historical Data and Forecast of Bahamas Digital Photo Frame Market Revenues & Volume By Above 15 for the Period 2022-2032F
- Historical Data and Forecast of Bahamas Digital Photo Frame Market Revenues & Volume By Power Source for the Period 2022-2032F
- Historical Data and Forecast of Bahamas Digital Photo Frame Market Revenues & Volume By Electricity Power Source for the Period 2022-2032F
- Historical Data and Forecast of Bahamas Digital Photo Frame Market Revenues & Volume By Battery Power Source for the Period 2022-2032F
- Historical Data and Forecast of Bahamas Digital Photo Frame Market Revenues & Volume By Application for the Period 2022-2032F
- Historical Data and Forecast of Bahamas Digital Photo Frame Market Revenues & Volume By Residential for the Period 2022-2032F
- Historical Data and Forecast of Bahamas Digital Photo Frame Market Revenues & Volume By Commercial for the Period 2022-2032F
- Historical Data and Forecast of Bahamas Digital Photo Frame Market Revenues & Volume By Distribution Channel for the Period 2022-2032F
- Historical Data and Forecast of Bahamas Digital Photo Frame Market Revenues & Volume By Online for the Period 2022-2032F
- Historical Data and Forecast of Bahamas Digital Photo Frame Market Revenues & Volume By Offline for the Period 2022-2032F
- Bahamas Digital Photo Frame Import Export Trade Statistics
- Market Opportunity Assessment By Product Type
- Market Opportunity Assessment By Size
- Market Opportunity Assessment By Inch
- Market Opportunity Assessment By Power Source
- Market Opportunity Assessment By Application
- Market Opportunity Assessment By Distribution Channel
- Bahamas Digital Photo Frame Top Companies Market Share
- Bahamas Digital Photo Frame Competitive Benchmarking By Technical and Operational Parameters
- Bahamas Digital Photo Frame Company Profiles
- Bahamas Digital Photo Frame Key Strategic Recommendations
Frequently Asked Questions About the Market Study (FAQs):
6Wresearch actively monitors the Bahamas Digital Photo Frame Market and publishes its comprehensive annual report, highlighting emerging trends, growth drivers, revenue analysis, and forecast outlook. Our insights help businesses to make data-backed strategic decisions with ongoing market dynamics. Our analysts track relevent industries related to the Bahamas Digital Photo Frame Market, allowing our clients with actionable intelligence and reliable forecasts tailored to emerging regional needs.
Yes, we provide customisation as per your requirements. To learn more, feel free to contact us on sales@6wresearch.com
1 Executive Summary |
2 Introduction |
2.1 Key Highlights of the Report |
2.2 Report Description |
2.3 Market Scope & Segmentation |
2.4 Research Methodology |
2.5 Assumptions |
3 Bahamas Digital Photo Frame Market Overview |
3.1 Bahamas Country Macro Economic Indicators |
3.2 Bahamas Digital Photo Frame Market Revenues & Volume, 2022 & 2032F |
3.3 Bahamas Digital Photo Frame Market - Industry Life Cycle |
3.4 Bahamas Digital Photo Frame Market - Porter's Five Forces |
3.5 Bahamas Digital Photo Frame Market Revenues & Volume Share, By Product Type, 2022 & 2032F |
3.6 Bahamas Digital Photo Frame Market Revenues & Volume Share, By Size, 2022 & 2032F |
3.7 Bahamas Digital Photo Frame Market Revenues & Volume Share, By Inch, 2022 & 2032F |
3.8 Bahamas Digital Photo Frame Market Revenues & Volume Share, By Power Source, 2022 & 2032F |
3.9 Bahamas Digital Photo Frame Market Revenues & Volume Share, By Application, 2022 & 2032F |
3.10 Bahamas Digital Photo Frame Market Revenues & Volume Share, By Distribution Channel, 2022 & 2032F |
4 Bahamas Digital Photo Frame Market Dynamics |
4.1 Impact Analysis |
4.2 Market Drivers |
4.3 Market Restraints |
5 Bahamas Digital Photo Frame Market Trends |
6 Bahamas Digital Photo Frame Market Segmentations |
6.1 Bahamas Digital Photo Frame Market, By Product Type |
6.1.1 Overview and Analysis |
6.1.2 Bahamas Digital Photo Frame Market Revenues & Volume, By Pan Touch Control Frame, 2022-2032F |
6.1.3 Bahamas Digital Photo Frame Market Revenues & Volume, By Remote Control Frame, 2022-2032F |
6.2 Bahamas Digital Photo Frame Market, By Size |
6.2.1 Overview and Analysis |
6.2.2 Bahamas Digital Photo Frame Market Revenues & Volume, By Standard Frame (4:3), 2022-2032F |
6.2.3 Bahamas Digital Photo Frame Market Revenues & Volume, By Widescreen Frame (16:9), 2022-2032F |
6.3 Bahamas Digital Photo Frame Market, By Inch |
6.3.1 Overview and Analysis |
6.3.2 Bahamas Digital Photo Frame Market Revenues & Volume, By Up to 7, 2022-2032F |
6.3.3 Bahamas Digital Photo Frame Market Revenues & Volume, By Between 7 to 15, 2022-2032F |
6.3.4 Bahamas Digital Photo Frame Market Revenues & Volume, By Above 15, 2022-2032F |
6.4 Bahamas Digital Photo Frame Market, By Power Source |
6.4.1 Overview and Analysis |
6.4.2 Bahamas Digital Photo Frame Market Revenues & Volume, By Electricity Power Source, 2022-2032F |
6.4.3 Bahamas Digital Photo Frame Market Revenues & Volume, By Battery Power Source, 2022-2032F |
6.5 Bahamas Digital Photo Frame Market, By Application |
6.5.1 Overview and Analysis |
6.5.2 Bahamas Digital Photo Frame Market Revenues & Volume, By Residential, 2022-2032F |
6.5.3 Bahamas Digital Photo Frame Market Revenues & Volume, By Commercial, 2022-2032F |
6.6 Bahamas Digital Photo Frame Market, By Distribution Channel |
6.6.1 Overview and Analysis |
6.6.2 Bahamas Digital Photo Frame Market Revenues & Volume, By Online, 2022-2032F |
6.6.3 Bahamas Digital Photo Frame Market Revenues & Volume, By Offline, 2022-2032F |
7 Bahamas Digital Photo Frame Market Import-Export Trade Statistics |
7.1 Bahamas Digital Photo Frame Market Export to Major Countries |
7.2 Bahamas Digital Photo Frame Market Imports from Major Countries |
8 Bahamas Digital Photo Frame Market Key Performance Indicators |
9 Bahamas Digital Photo Frame Market - Opportunity Assessment |
9.1 Bahamas Digital Photo Frame Market Opportunity Assessment, By Product Type, 2022 & 2032F |
9.2 Bahamas Digital Photo Frame Market Opportunity Assessment, By Size, 2022 & 2032F |
9.3 Bahamas Digital Photo Frame Market Opportunity Assessment, By Inch, 2022 & 2032F |
9.4 Bahamas Digital Photo Frame Market Opportunity Assessment, By Power Source, 2022 & 2032F |
9.5 Bahamas Digital Photo Frame Market Opportunity Assessment, By Application, 2022 & 2032F |
9.6 Bahamas Digital Photo Frame Market Opportunity Assessment, By Distribution Channel, 2022 & 2032F |
10 Bahamas Digital Photo Frame Market - Competitive Landscape |
10.1 Bahamas Digital Photo Frame Market Revenue Share, By Companies, 2032 |
10.2 Bahamas Digital Photo Frame Market Competitive Benchmarking, By Operating and Technical Parameters |
11 Company Profiles |
12 Recommendations | 13 Disclaimer |
Export potential assessment - trade Analytics for 2030
Export potential enables firms to identify high-growth global markets with greater confidence by combining advanced trade intelligence with a structured quantitative methodology. The framework analyzes emerging demand trends and country-level import patterns while integrating macroeconomic and trade datasets such as GDP and population forecasts, bilateral import–export flows, tariff structures, elasticity differentials between developed and developing economies, geographic distance, and import demand projections. Using weighted trade values from 2020–2024 as the base period to project country-to-country export potential for 2030, these inputs are operationalized through calculated drivers such as gravity model parameters, tariff impact factors, and projected GDP per-capita growth. Through an analysis of hidden potentials, demand hotspots, and market conditions that are most favorable to success, this method enables firms to focus on target countries, maximize returns, and global expansion with data, backed by accuracy.
By factoring in the projected importer demand gap that is currently unmet and could be potential opportunity, it identifies the potential for the Exporter (Country) among 190 countries, against the general trade analysis, which identifies the biggest importer or exporter.
To discover high-growth global markets and optimize your business strategy:
Click Here
Pricing
- Single User License$ 1,995
- Department License$ 2,400
- Site License$ 3,120
- Global License$ 3,795

Search
Thought Leadership and Analyst Meet


Our Clients
Related Reports
- India Switchgear Market Outlook (2026 - 2032) | Size, Share, Trends, Growth, Revenue, Forecast, Analysis, Value, Outlook
- Pakistan Contraceptive Implants Market (2025-2031) | Demand, Growth, Size, Share, Industry, Pricing Analysis, Competitive, Strategic Insights, Strategy, Consumer Insights, Analysis, Investment Trends, Opportunities, Revenue, Segments, Value, Segmentation, Supply, Forecast, Restraints, Outlook, Competition, Drivers, Trends, Companies, Challenges
- Sri Lanka Packaging Market (2026-2032) | Outlook, Competition, Drivers, Trends, Demand, Pricing Analysis, Competitive, Strategic Insights, Companies, Challenges, Strategy, Consumer Insights, Analysis, Investment Trends, Opportunities, Growth, Size, Share, Industry, Revenue, Segments, Value, Segmentation, Supply, Forecast, Restraints
- India Kids Watches Market (2026-2032) | Strategy, Consumer Insights, Analysis, Investment Trends, Opportunities, Growth, Size, Share, Industry, Revenue, Segments, Value, Segmentation, Supply, Forecast, Restraints, Outlook, Competition, Drivers, Trends, Demand, Pricing Analysis, Competitive, Strategic Insights, Companies, Challenges
- Saudi Arabia Core Assurance Service Market (2025-2031) | Strategy, Consumer Insights, Analysis, Investment Trends, Opportunities, Growth, Size, Share, Industry, Revenue, Segments, Value, Segmentation, Supply, Forecast, Restraints, Outlook, Competition, Drivers, Trends, Demand, Pricing Analysis, Competitive, Strategic Insights, Companies, Challenges
- Romania Uninterruptible Power Supply (UPS) Market (2026-2032) | Industry, Analysis, Revenue, Size, Forecast, Outlook, Value, Trends, Share, Growth & Companies
- Saudi Arabia Car Window Tinting Film, Paint Protection Film (PPF), and Ceramic Coating Market (2025-2031) | Strategy, Consumer Insights, Analysis, Investment Trends, Opportunities, Growth, Size, Share, Industry, Revenue, Segments, Value, Segmentation, Supply, Forecast, Restraints, Outlook, Competition, Drivers, Trends, Demand, Pricing Analysis, Competitive, Strategic Insights, Companies, Challenges
- South Africa Stationery Market (2025-2031) | Share, Size, Industry, Value, Growth, Revenue, Analysis, Trends, Segmentation & Outlook
- Afghanistan Rocking Chairs And Adirondack Chairs Market (2026-2032) | Size & Revenue, Competitive Landscape, Share, Segmentation, Industry, Value, Outlook, Analysis, Trends, Growth, Forecast, Companies
- Afghanistan Apparel Market (2026-2032) | Growth, Outlook, Industry, Segmentation, Forecast, Size, Companies, Trends, Value, Share, Analysis & Revenue
Industry Events and Analyst Meet

India EV Show 2026

EV tech India Expo 2026

Auto Tech Asia 2026

Battery Tech India 2026

Smart Production Solutions Guangzhou 2026
Whitepaper
- Middle East & Africa Commercial Security Market Click here to view more.
- Middle East & Africa Fire Safety Systems & Equipment Market Click here to view more.
- GCC Drone Market Click here to view more.
- Middle East Lighting Fixture Market Click here to view more.
- GCC Physical & Perimeter Security Market Click here to view more.
6WResearch In News
- Doha a strategic location for EV manufacturing hub: IPA Qatar
- Demand for luxury TVs surging in the GCC, says Samsung
- Empowering Growth: The Thriving Journey of Bangladesh’s Cable Industry
- Demand for luxury TVs surging in the GCC, says Samsung
- Video call with a traditional healer? Once unthinkable, it’s now common in South Africa
- Intelligent Buildings To Smooth GCC’s Path To Net Zero