Barbados Shipping Container Market (2025-2031) | Size, Growth, Outlook, Revenue, Analysis, Share, Forecast, Value, Industry, Companies, Trends & Segmentation
Market Forecast By Container Size (Small Containers (20 feet), Large Containers (40 feet), High Cube Containers (40 feet)), By Product Type (Dry Storage Containers, Flat Rack Containers, Refrigerated Containers, Special Purpose Containers, Others), By End-use (Food & Beverages, Consumer Goods, Healthcare, Industrial Products, Vehicle Transport, Others) And Competitive Landscape
| Product Code: ETC5086852 | Publication Date: Nov 2023 | Updated Date: Oct 2025 | Product Type: Market Research Report | |
| Publisher: 6Wresearch | Author: Shubham Padhi | No. of Pages: 60 | No. of Figures: 30 | No. of Tables: 5 |
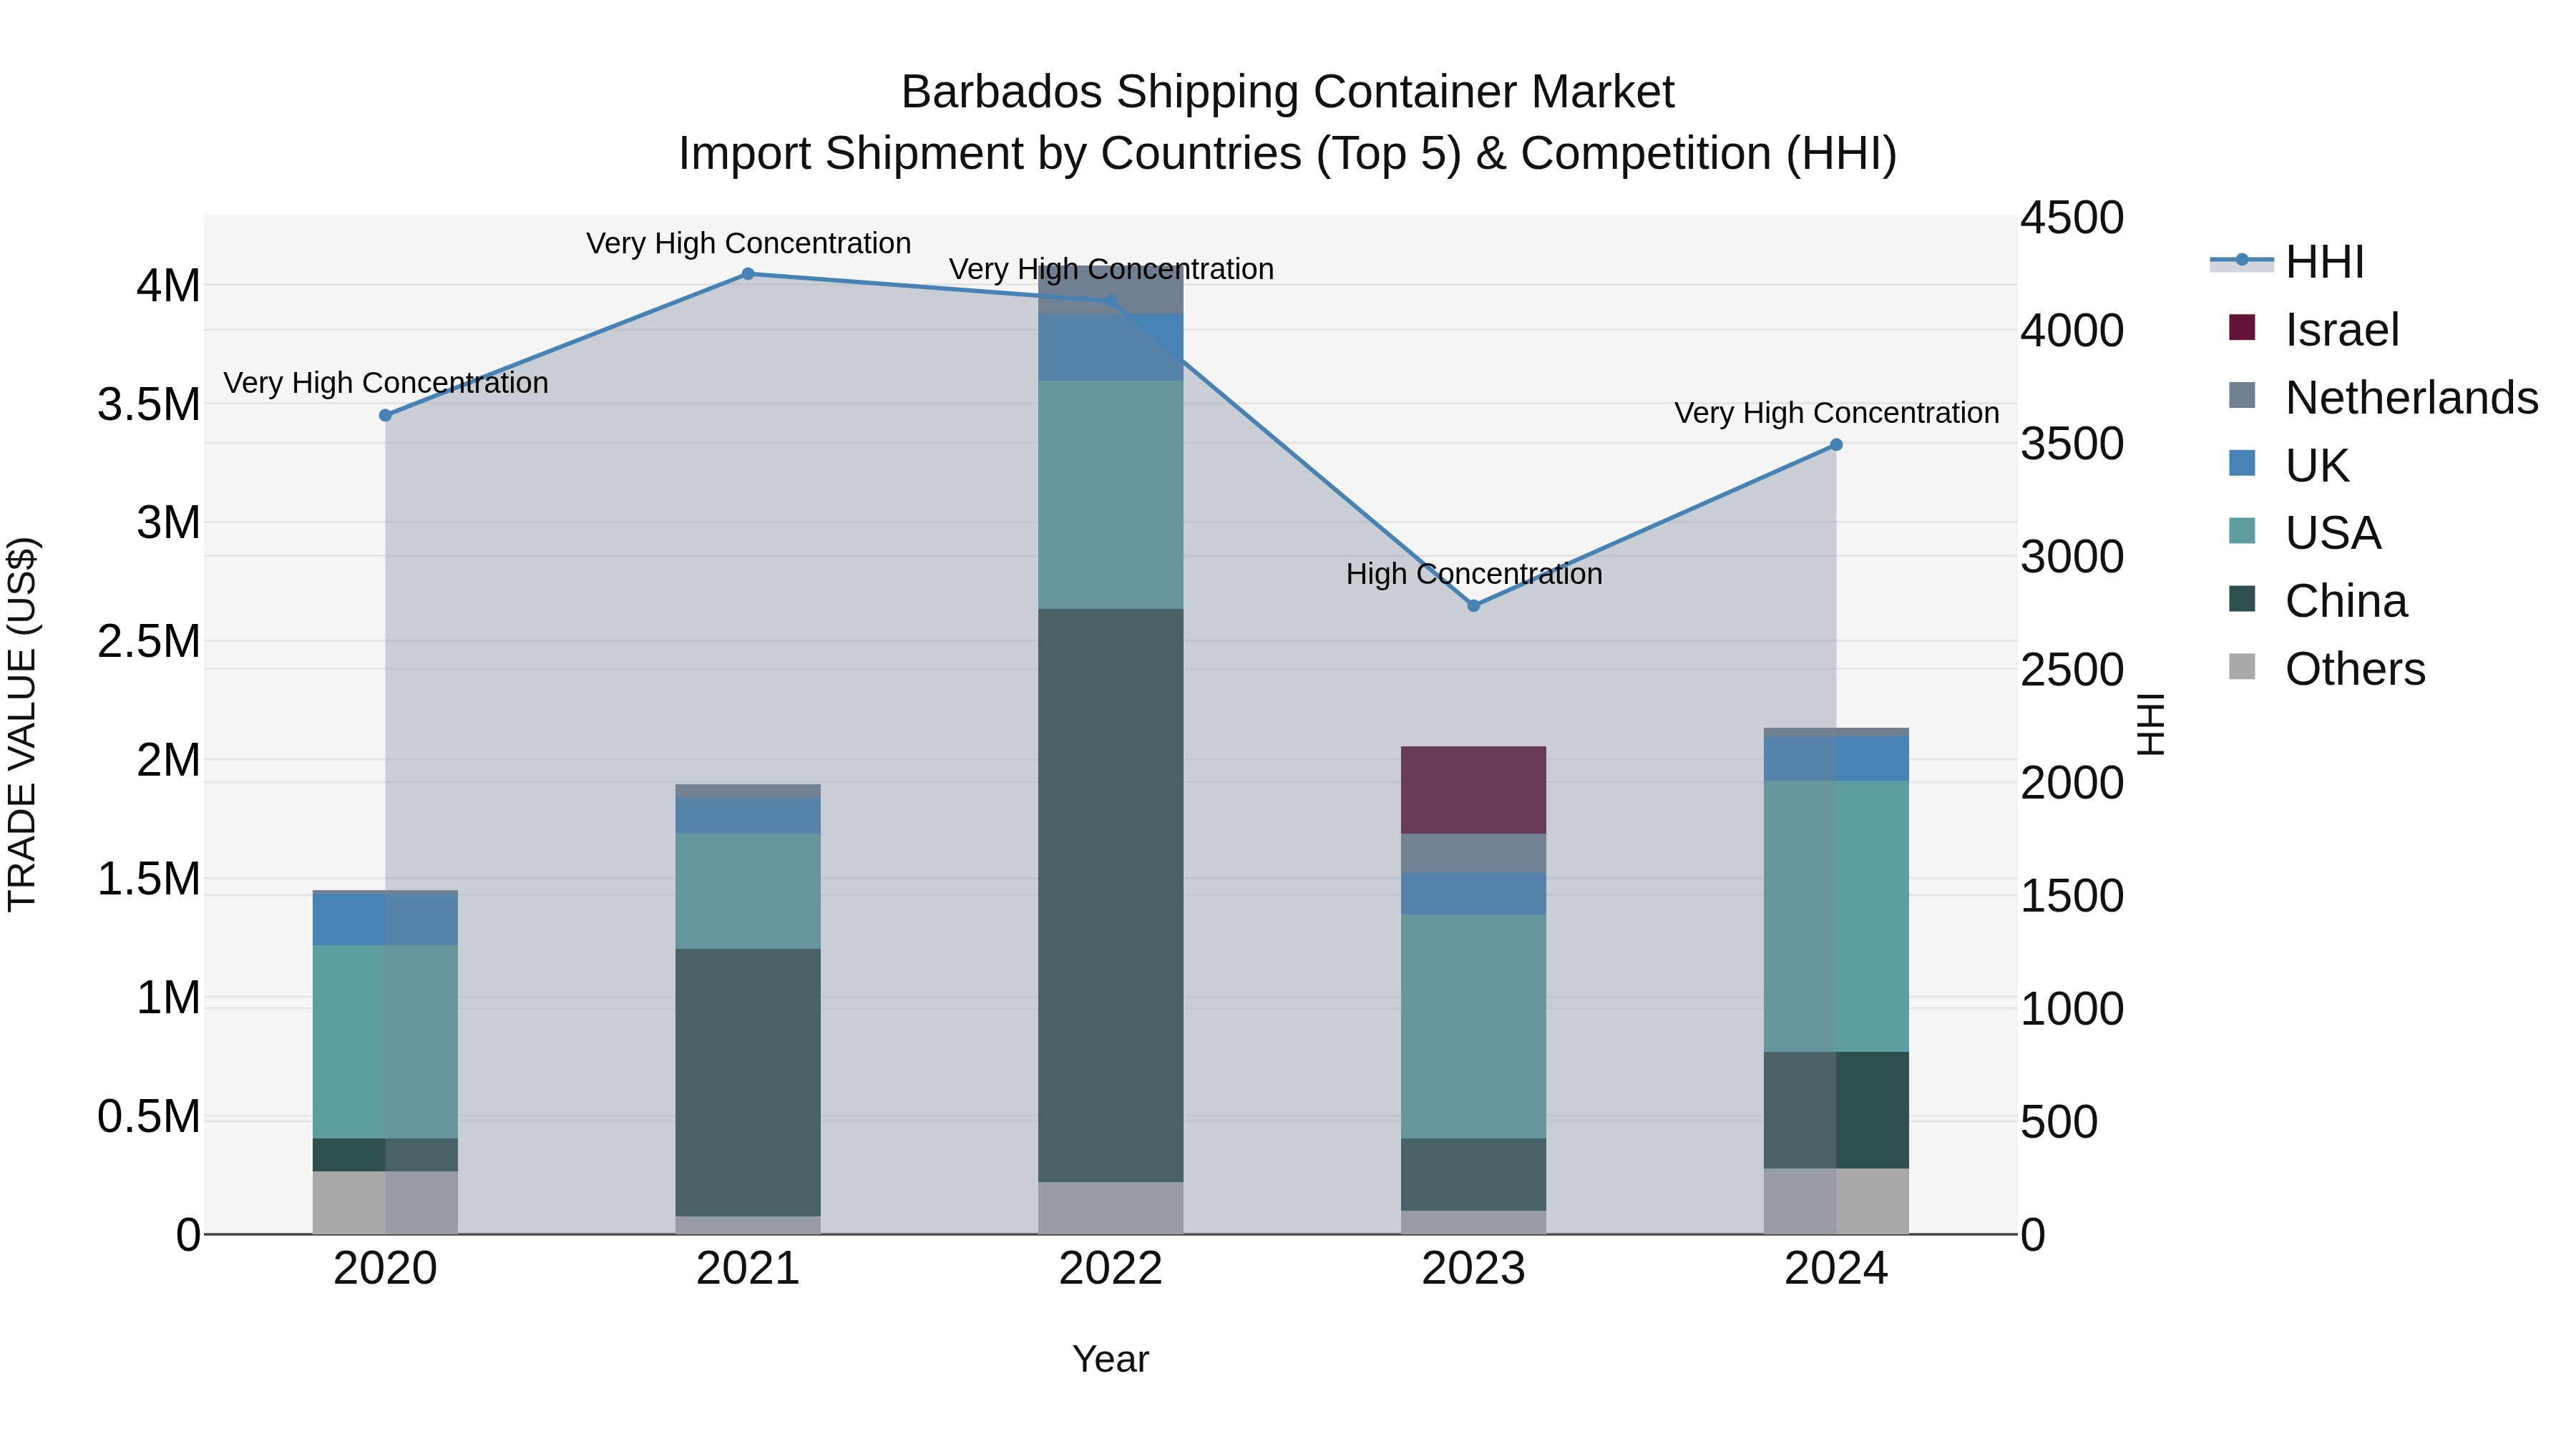
Barbados Shipping Container Market Top 5 Importing Countries and Market Competition (HHI) Analysis
Barbados` shipping container import shipments in 2024 continue to be dominated by top exporting countries such as USA, China, UK, Ghana, and Hong Kong. The market concentration, as measured by the Herfindahl-Hirschman Index (HHI), has increased significantly from 2023 to 2024, indicating very high concentration among suppliers. The compound annual growth rate (CAGR) from 2020 to 2024 stands at a healthy 10.15%, with a notable growth rate of 3.77% from 2023 to 2024. These trends suggest a strong and evolving landscape for shipping container imports into Barbados, with key players driving growth and market dynamics.
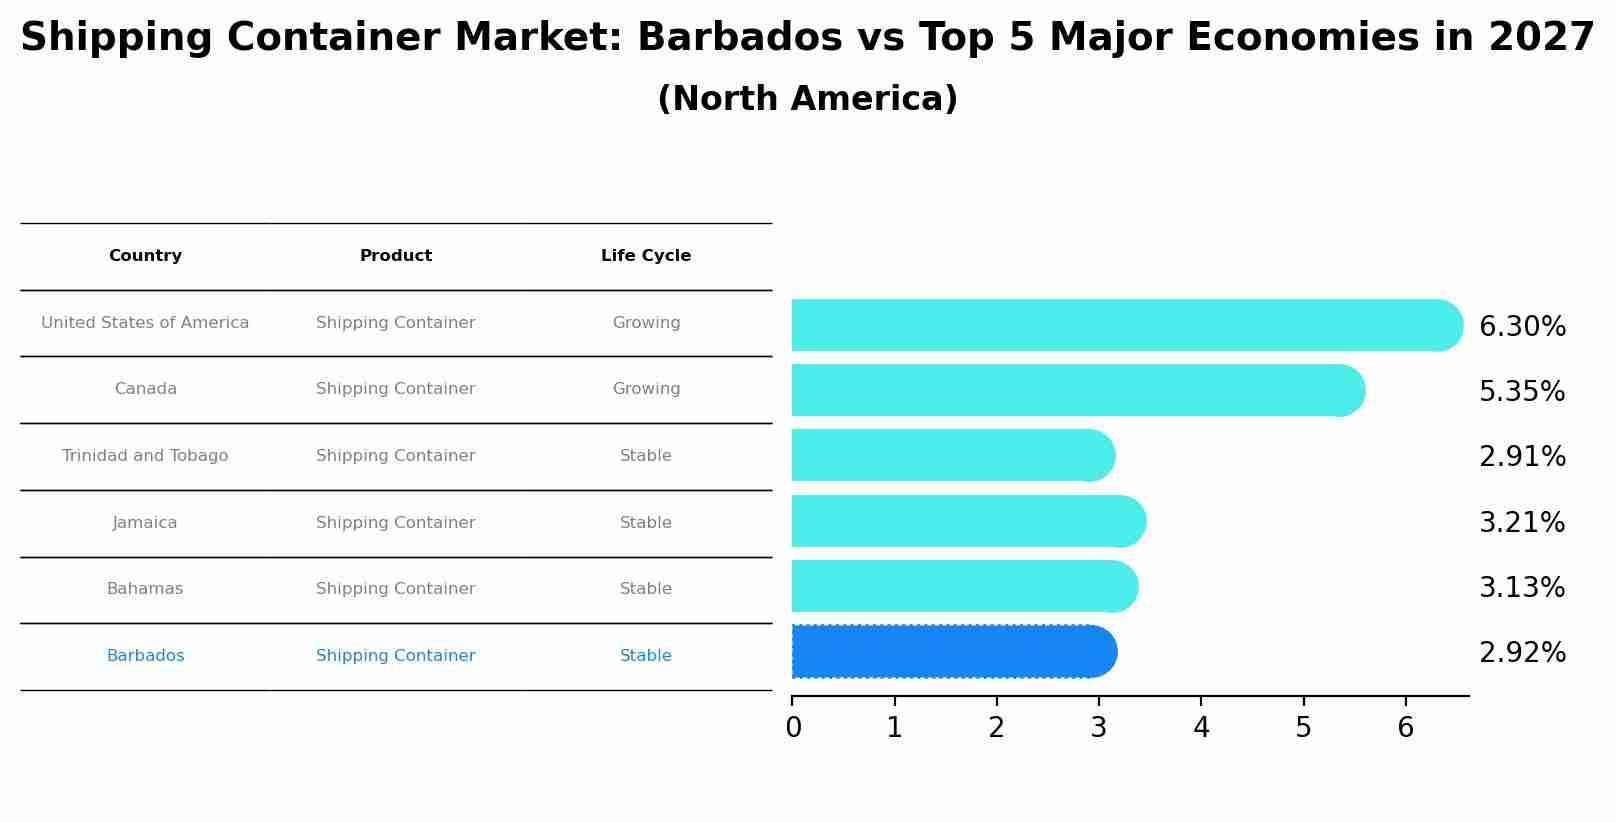
Shipping Container Market: Barbados vs Top 5 Major Economies in 2027 (North America)
In the North America region, the Shipping Container market in Barbados is projected to expand at a stable growth rate of 2.92% by 2027. The largest economy is United States of America, followed by Canada, Trinidad and Tobago, Jamaica and Bahamas.
Key Highlights of the Report:
- Barbados Shipping Container Market Outlook
- Market Size of Barbados Shipping Container Market, 2024
- Forecast of Barbados Shipping Container Market, 2031
- Historical Data and Forecast of Barbados Shipping Container Revenues & Volume for the Period 2021-2031
- Barbados Shipping Container Market Trend Evolution
- Barbados Shipping Container Market Drivers and Challenges
- Barbados Shipping Container Price Trends
- Barbados Shipping Container Porter`s Five Forces
- Barbados Shipping Container Industry Life Cycle
- Historical Data and Forecast of Barbados Shipping Container Market Revenues & Volume By Container Size for the Period 2021-2031
- Historical Data and Forecast of Barbados Shipping Container Market Revenues & Volume By Small Containers (20 feet) for the Period 2021-2031
- Historical Data and Forecast of Barbados Shipping Container Market Revenues & Volume By Large Containers (40 feet) for the Period 2021-2031
- Historical Data and Forecast of Barbados Shipping Container Market Revenues & Volume By High Cube Containers (40 feet) for the Period 2021-2031
- Historical Data and Forecast of Barbados Shipping Container Market Revenues & Volume By Product Type for the Period 2021-2031
- Historical Data and Forecast of Barbados Shipping Container Market Revenues & Volume By Dry Storage Containers for the Period 2021-2031
- Historical Data and Forecast of Barbados Shipping Container Market Revenues & Volume By Flat Rack Containers for the Period 2021-2031
- Historical Data and Forecast of Barbados Shipping Container Market Revenues & Volume By Refrigerated Containers for the Period 2021-2031
- Historical Data and Forecast of Barbados Shipping Container Market Revenues & Volume By Special Purpose Containers for the Period 2021-2031
- Historical Data and Forecast of Barbados Shipping Container Market Revenues & Volume By Others for the Period 2021-2031
- Historical Data and Forecast of Barbados Shipping Container Market Revenues & Volume By End-use for the Period 2021-2031
- Historical Data and Forecast of Barbados Shipping Container Market Revenues & Volume By Food & Beverages for the Period 2021-2031
- Historical Data and Forecast of Barbados Shipping Container Market Revenues & Volume By Consumer Goods for the Period 2021-2031
- Historical Data and Forecast of Barbados Shipping Container Market Revenues & Volume By Healthcare for the Period 2021-2031
- Historical Data and Forecast of Barbados Shipping Container Market Revenues & Volume By Industrial Products for the Period 2021-2031
- Historical Data and Forecast of Barbados Shipping Container Market Revenues & Volume By Vehicle Transport for the Period 2021-2031
- Historical Data and Forecast of Barbados Shipping Container Market Revenues & Volume By Others for the Period 2021-2031
- Barbados Shipping Container Import Export Trade Statistics
- Market Opportunity Assessment By Container Size
- Market Opportunity Assessment By Product Type
- Market Opportunity Assessment By End-use
- Barbados Shipping Container Top Companies Market Share
- Barbados Shipping Container Competitive Benchmarking By Technical and Operational Parameters
- Barbados Shipping Container Company Profiles
- Barbados Shipping Container Key Strategic Recommendations
Frequently Asked Questions About the Market Study (FAQs):
6Wresearch actively monitors the Barbados Shipping Container Market and publishes its comprehensive annual report, highlighting emerging trends, growth drivers, revenue analysis, and forecast outlook. Our insights help businesses to make data-backed strategic decisions with ongoing market dynamics. Our analysts track relevent industries related to the Barbados Shipping Container Market, allowing our clients with actionable intelligence and reliable forecasts tailored to emerging regional needs.
Yes, we provide customisation as per your requirements. To learn more, feel free to contact us on sales@6wresearch.com
1 Executive Summary |
2 Introduction |
2.1 Key Highlights of the Report |
2.2 Report Description |
2.3 Market Scope & Segmentation |
2.4 Research Methodology |
2.5 Assumptions |
3 Barbados Shipping Container Market Overview |
3.1 Barbados Country Macro Economic Indicators |
3.2 Barbados Shipping Container Market Revenues & Volume, 2021 & 2031F |
3.3 Barbados Shipping Container Market - Industry Life Cycle |
3.4 Barbados Shipping Container Market - Porter's Five Forces |
3.5 Barbados Shipping Container Market Revenues & Volume Share, By Container Size, 2021 & 2031F |
3.6 Barbados Shipping Container Market Revenues & Volume Share, By Product Type, 2021 & 2031F |
3.7 Barbados Shipping Container Market Revenues & Volume Share, By End-use, 2021 & 2031F |
4 Barbados Shipping Container Market Dynamics |
4.1 Impact Analysis |
4.2 Market Drivers |
4.2.1 Growth in international trade and globalization leading to increased demand for shipping containers. |
4.2.2 Expansion of the e-commerce industry driving the need for efficient logistics and transportation solutions. |
4.2.3 Government initiatives to develop and improve Barbados' port infrastructure, enhancing the shipping container market. |
4.3 Market Restraints |
4.3.1 Fluctuations in fuel prices impacting transportation costs and, subsequently, container shipping expenses. |
4.3.2 Economic downturns or geopolitical instability affecting trade volumes and demand for shipping containers. |
4.3.3 Environmental regulations and sustainability concerns leading to additional costs for eco-friendly container solutions. |
5 Barbados Shipping Container Market Trends |
6 Barbados Shipping Container Market Segmentations |
6.1 Barbados Shipping Container Market, By Container Size |
6.1.1 Overview and Analysis |
6.1.2 Barbados Shipping Container Market Revenues & Volume, By Small Containers (20 feet), 2021-2031F |
6.1.3 Barbados Shipping Container Market Revenues & Volume, By Large Containers (40 feet), 2021-2031F |
6.1.4 Barbados Shipping Container Market Revenues & Volume, By High Cube Containers (40 feet), 2021-2031F |
6.2 Barbados Shipping Container Market, By Product Type |
6.2.1 Overview and Analysis |
6.2.2 Barbados Shipping Container Market Revenues & Volume, By Dry Storage Containers, 2021-2031F |
6.2.3 Barbados Shipping Container Market Revenues & Volume, By Flat Rack Containers, 2021-2031F |
6.2.4 Barbados Shipping Container Market Revenues & Volume, By Refrigerated Containers, 2021-2031F |
6.2.5 Barbados Shipping Container Market Revenues & Volume, By Special Purpose Containers, 2021-2031F |
6.2.6 Barbados Shipping Container Market Revenues & Volume, By Others, 2021-2031F |
6.3 Barbados Shipping Container Market, By End-use |
6.3.1 Overview and Analysis |
6.3.2 Barbados Shipping Container Market Revenues & Volume, By Food & Beverages, 2021-2031F |
6.3.3 Barbados Shipping Container Market Revenues & Volume, By Consumer Goods, 2021-2031F |
6.3.4 Barbados Shipping Container Market Revenues & Volume, By Healthcare, 2021-2031F |
6.3.5 Barbados Shipping Container Market Revenues & Volume, By Industrial Products, 2021-2031F |
6.3.6 Barbados Shipping Container Market Revenues & Volume, By Vehicle Transport, 2021-2031F |
6.3.7 Barbados Shipping Container Market Revenues & Volume, By Others, 2021-2031F |
7 Barbados Shipping Container Market Import-Export Trade Statistics |
7.1 Barbados Shipping Container Market Export to Major Countries |
7.2 Barbados Shipping Container Market Imports from Major Countries |
8 Barbados Shipping Container Market Key Performance Indicators |
8.1 Average turnaround time for handling shipping containers at Barbados ports. |
8.2 Utilization rate of shipping containers in the Barbados market. |
8.3 Maintenance cost per shipping container over a specific period. |
8.4 Percentage of damaged or lost containers during transportation. |
8.5 Customer satisfaction scores related to container logistics services. |
9 Barbados Shipping Container Market - Opportunity Assessment |
9.1 Barbados Shipping Container Market Opportunity Assessment, By Container Size, 2021 & 2031F |
9.2 Barbados Shipping Container Market Opportunity Assessment, By Product Type, 2021 & 2031F |
9.3 Barbados Shipping Container Market Opportunity Assessment, By End-use, 2021 & 2031F |
10 Barbados Shipping Container Market - Competitive Landscape |
10.1 Barbados Shipping Container Market Revenue Share, By Companies, 2024 |
10.2 Barbados Shipping Container Market Competitive Benchmarking, By Operating and Technical Parameters |
11 Company Profiles |
12 Recommendations | 13 Disclaimer |
Export potential assessment - trade Analytics for 2030
Export potential enables firms to identify high-growth global markets with greater confidence by combining advanced trade intelligence with a structured quantitative methodology. The framework analyzes emerging demand trends and country-level import patterns while integrating macroeconomic and trade datasets such as GDP and population forecasts, bilateral import–export flows, tariff structures, elasticity differentials between developed and developing economies, geographic distance, and import demand projections. Using weighted trade values from 2020–2024 as the base period to project country-to-country export potential for 2030, these inputs are operationalized through calculated drivers such as gravity model parameters, tariff impact factors, and projected GDP per-capita growth. Through an analysis of hidden potentials, demand hotspots, and market conditions that are most favorable to success, this method enables firms to focus on target countries, maximize returns, and global expansion with data, backed by accuracy.
By factoring in the projected importer demand gap that is currently unmet and could be potential opportunity, it identifies the potential for the Exporter (Country) among 190 countries, against the general trade analysis, which identifies the biggest importer or exporter.
To discover high-growth global markets and optimize your business strategy:
Click Here
Pricing
- Single User License$ 1,995
- Department License$ 2,400
- Site License$ 3,120
- Global License$ 3,795

Search
Thought Leadership and Analyst Meet


Our Clients
Related Reports
- Saudi Arabia Core Assurance Service Market (2025-2031) | Strategy, Consumer Insights, Analysis, Investment Trends, Opportunities, Growth, Size, Share, Industry, Revenue, Segments, Value, Segmentation, Supply, Forecast, Restraints, Outlook, Competition, Drivers, Trends, Demand, Pricing Analysis, Competitive, Strategic Insights, Companies, Challenges
- Romania Uninterruptible Power Supply (UPS) Market (2026-2032) | Industry, Analysis, Revenue, Size, Forecast, Outlook, Value, Trends, Share, Growth & Companies
- Saudi Arabia Car Window Tinting Film, Paint Protection Film (PPF), and Ceramic Coating Market (2025-2031) | Strategy, Consumer Insights, Analysis, Investment Trends, Opportunities, Growth, Size, Share, Industry, Revenue, Segments, Value, Segmentation, Supply, Forecast, Restraints, Outlook, Competition, Drivers, Trends, Demand, Pricing Analysis, Competitive, Strategic Insights, Companies, Challenges
- South Africa Stationery Market (2025-2031) | Share, Size, Industry, Value, Growth, Revenue, Analysis, Trends, Segmentation & Outlook
- Afghanistan Rocking Chairs And Adirondack Chairs Market (2026-2032) | Size & Revenue, Competitive Landscape, Share, Segmentation, Industry, Value, Outlook, Analysis, Trends, Growth, Forecast, Companies
- Afghanistan Apparel Market (2026-2032) | Growth, Outlook, Industry, Segmentation, Forecast, Size, Companies, Trends, Value, Share, Analysis & Revenue
- Canada Oil and Gas Market (2026-2032) | Share, Segmentation, Value, Industry, Trends, Forecast, Analysis, Size & Revenue, Growth, Competitive Landscape, Outlook, Companies
- Germany Breakfast Food Market (2026-2032) | Industry, Share, Growth, Size, Companies, Value, Analysis, Revenue, Trends, Forecast & Outlook
- Australia Briquette Market (2025-2031) | Growth, Size, Revenue, Forecast, Analysis, Trends, Value, Share, Industry & Companies
- Vietnam System Integrator Market (2026-2032) | Size, Companies, Analysis, Industry, Value, Forecast, Growth, Trends, Revenue & Share
Industry Events and Analyst Meet

Stationery & Paper Expo Saudi Arabia 2026

Kids & Toys Expo Saudi Arabia 2026

Gifts & Homeware Expo Saudi Arabia 2026

Smart Home Expo 2026

Industrial Facilities Management Expo 2025
Whitepaper
- Middle East & Africa Commercial Security Market Click here to view more.
- Middle East & Africa Fire Safety Systems & Equipment Market Click here to view more.
- GCC Drone Market Click here to view more.
- Middle East Lighting Fixture Market Click here to view more.
- GCC Physical & Perimeter Security Market Click here to view more.
6WResearch In News
- Doha a strategic location for EV manufacturing hub: IPA Qatar
- Demand for luxury TVs surging in the GCC, says Samsung
- Empowering Growth: The Thriving Journey of Bangladesh’s Cable Industry
- Demand for luxury TVs surging in the GCC, says Samsung
- Video call with a traditional healer? Once unthinkable, it’s now common in South Africa
- Intelligent Buildings To Smooth GCC’s Path To Net Zero