Benin Hollow Glass Microspheres Market (2026-2032) | Size, Analysis, Trends, Industry, Share, Outlook, Revenue, Forecast, Value, Segmentation, Growth & Companies
Market Forecast By Type (Glass, Others), By Application (Automotive, Aerospace & Defense, Building & Construction, Paints & Coatings, Electrical & Electronics, Cosmetics & Personal Care, Healthcare) And Competitive Landscape
| Product Code: ETC4909301 | Publication Date: Nov 2023 | Updated Date: Mar 2026 | Product Type: Market Research Report | |
| Publisher: 6Wresearch | Author: Shubham Padhi | No. of Pages: 60 | No. of Figures: 30 | No. of Tables: 5 |
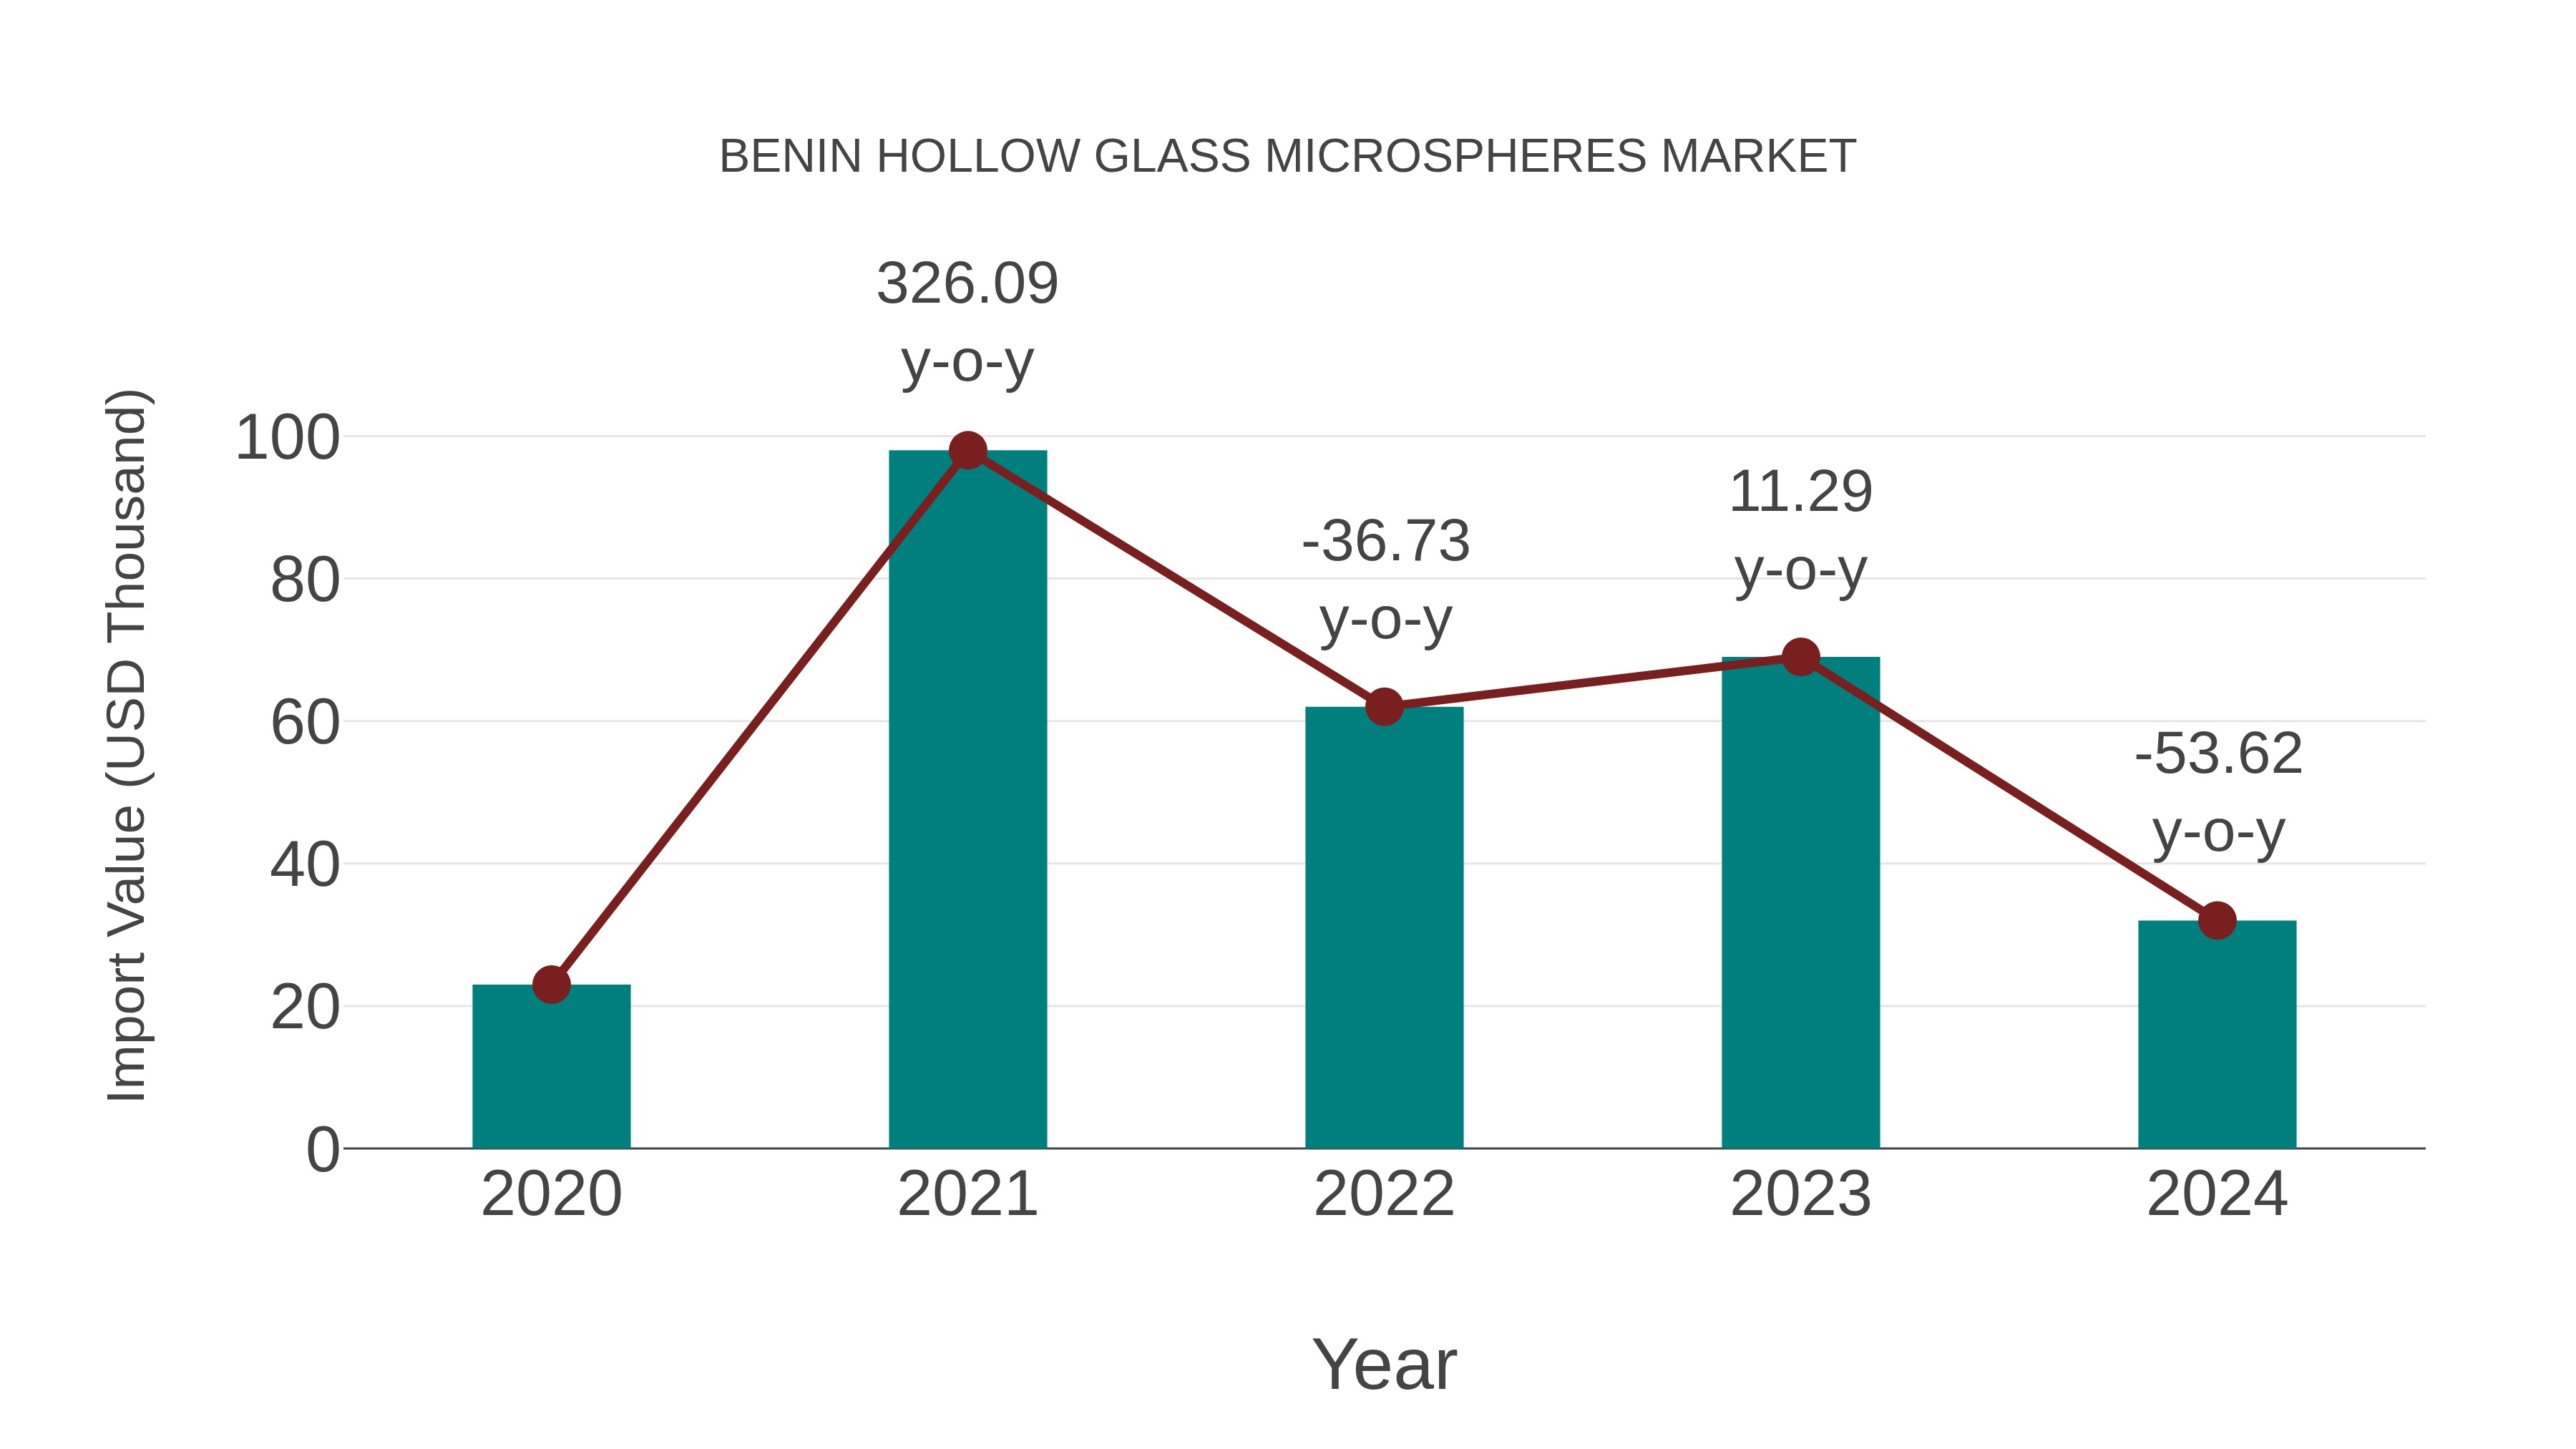
Benin Hollow Glass Microspheres Market: Import Trend Analysis
Benin`s import trend for Benin hollow glass microspheres market experienced a significant decline from 2023 to 2024, with a growth rate of -53.62%. However, the compound annual growth rate (CAGR) for the period of 2020-2024 stood at 8.61%. This fluctuation could be attributed to shifts in demand dynamics or changes in trade policies affecting the market`s performance.
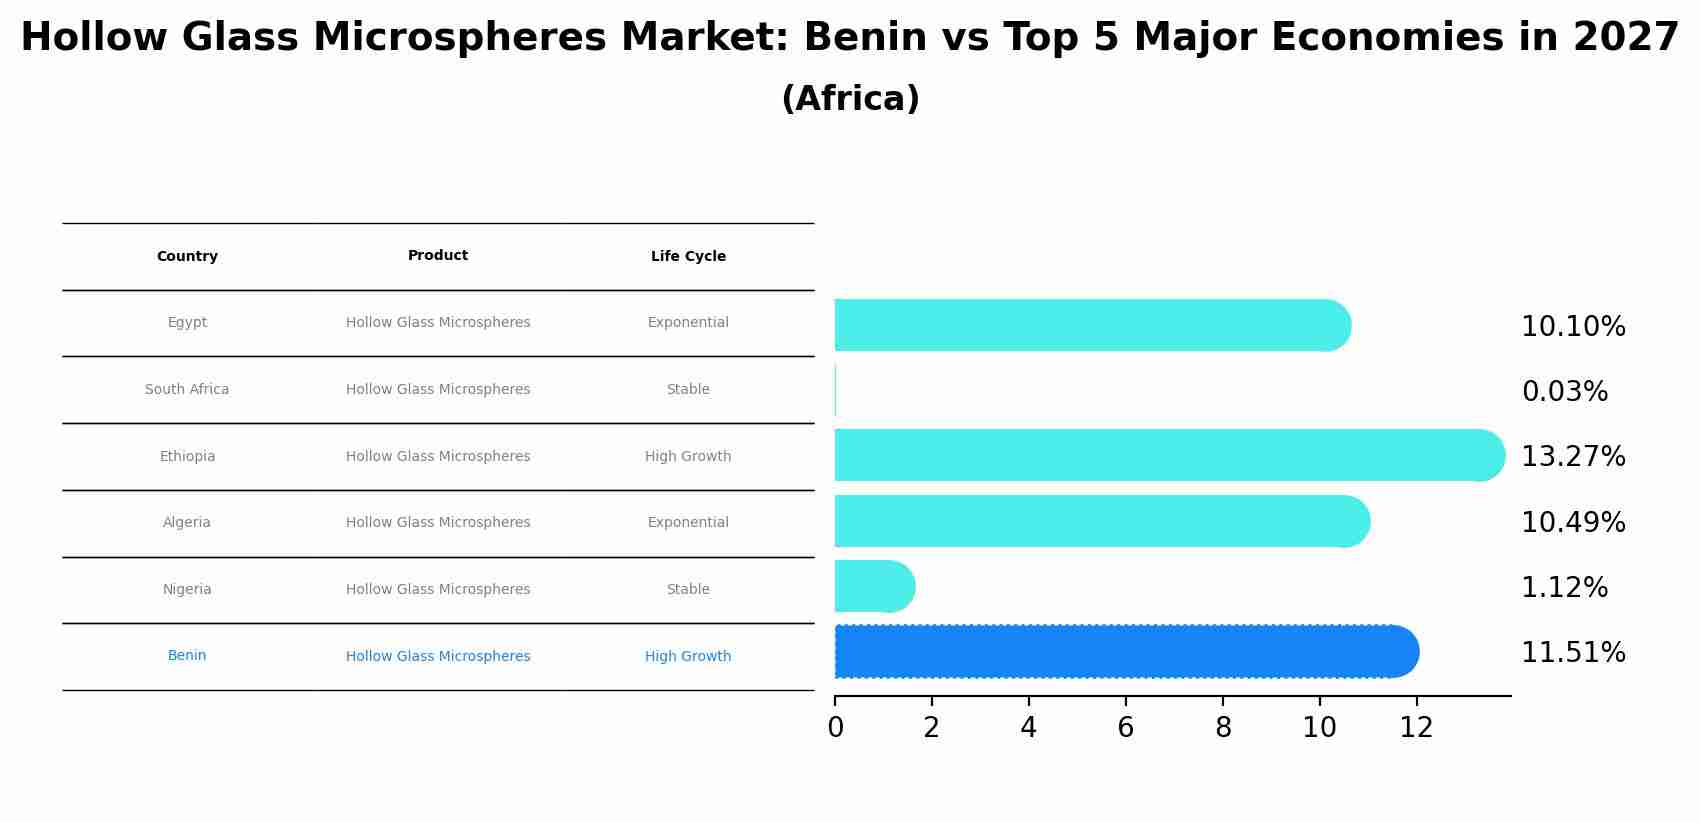
Hollow Glass Microspheres Market: Benin vs Top 5 Major Economies in 2027 (Africa)
By 2027, the Hollow Glass Microspheres market in Benin is anticipated to reach a growth rate of 11.51%, as part of an increasingly competitive Africa region, where Egypt remains at the forefront, supported by South Africa, Ethiopia, Algeria and Nigeria, driving innovations and market adoption across sectors.
Benin Hollow Glass Microspheres Market Overview
The hollow glass microspheres market in Benin is gaining traction, driven by their wide range of applications in industries such as construction, automotive, and aerospace. Hollow glass microspheres offer benefits such as lightweight, thermal insulation, and improved mechanical properties, making them valuable for various industrial uses. The market is influenced by technological advancements, increasing demand for energy-efficient materials, and the growing adoption of composite materials in different sectors. Additionally, the focus on sustainability and reducing environmental impact is promoting the use of hollow glass microspheres.
Drivers of the market
The hollow glass microspheres market in Benin is driven by their increasing use in various applications, including automotive, aerospace, and construction. Their lightweight and insulating properties make them ideal for reducing the weight of composite materials and enhancing thermal insulation, driving their demand in these industries.
Challenges of the market
The hollow glass microspheres market in Benin struggles with limited local production capabilities, reliance on imports, and high costs associated with these materials. The lack of awareness and technical expertise to utilize hollow glass microspheres in various applications further hampers market growth.
Government Policy of the market
To foster industrial diversification, the Benin government supports the production and application of hollow glass microspheres. Policies include subsidies for local manufacturers, import tax reductions on raw materials, and partnerships with foreign firms to transfer technology and expertise.
Key Highlights of the Report:
- Benin Hollow Glass Microspheres Market Outlook
- Market Size of Benin Hollow Glass Microspheres Market, 2025
- Forecast of Benin Hollow Glass Microspheres Market, 2032
- Historical Data and Forecast of Benin Hollow Glass Microspheres Revenues & Volume for the Period 2022-2032F
- Benin Hollow Glass Microspheres Market Trend Evolution
- Benin Hollow Glass Microspheres Market Drivers and Challenges
- Benin Hollow Glass Microspheres Price Trends
- Benin Hollow Glass Microspheres Porter`s Five Forces
- Benin Hollow Glass Microspheres Industry Life Cycle
- Historical Data and Forecast of Benin Hollow Glass Microspheres Market Revenues & Volume By Type for the Period 2022-2032F
- Historical Data and Forecast of Benin Hollow Glass Microspheres Market Revenues & Volume By Glass for the Period 2022-2032F
- Historical Data and Forecast of Benin Hollow Glass Microspheres Market Revenues & Volume By Others for the Period 2022-2032F
- Historical Data and Forecast of Benin Hollow Glass Microspheres Market Revenues & Volume By Application for the Period 2022-2032F
- Historical Data and Forecast of Benin Hollow Glass Microspheres Market Revenues & Volume By Automotive for the Period 2022-2032F
- Historical Data and Forecast of Benin Hollow Glass Microspheres Market Revenues & Volume By Aerospace & Defense for the Period 2022-2032F
- Historical Data and Forecast of Benin Hollow Glass Microspheres Market Revenues & Volume By Building & Construction for the Period 2022-2032F
- Historical Data and Forecast of Benin Hollow Glass Microspheres Market Revenues & Volume By Paints & Coatings for the Period 2022-2032F
- Historical Data and Forecast of Benin Hollow Glass Microspheres Market Revenues & Volume By Electrical & Electronics for the Period 2022-2032F
- Historical Data and Forecast of Benin Hollow Glass Microspheres Market Revenues & Volume By Cosmetics & Personal Care for the Period 2022-2032F
- Historical Data and Forecast of Benin Hollow Glass Microspheres Market Revenues & Volume By Healthcare for the Period 2022-2032F
- Benin Hollow Glass Microspheres Import Export Trade Statistics
- Market Opportunity Assessment By Type
- Market Opportunity Assessment By Application
- Benin Hollow Glass Microspheres Top Companies Market Share
- Benin Hollow Glass Microspheres Competitive Benchmarking By Technical and Operational Parameters
- Benin Hollow Glass Microspheres Company Profiles
- Benin Hollow Glass Microspheres Key Strategic Recommendations
Benin Hollow Glass Microspheres Market (2026-2032): FAQs
6Wresearch actively monitors the Benin Hollow Glass Microspheres Market and publishes its comprehensive annual report, highlighting emerging trends, growth drivers, revenue analysis, and forecast outlook. Our insights help businesses to make data-backed strategic decisions with ongoing market dynamics. Our analysts track relevent industries related to the Benin Hollow Glass Microspheres Market, allowing our clients with actionable intelligence and reliable forecasts tailored to emerging regional needs.
Yes, we provide customisation as per your requirements. To learn more, feel free to contact us on sales@6wresearch.com
1 Executive Summary |
2 Introduction |
2.1 Key Highlights of the Report |
2.2 Report Description |
2.3 Market Scope & Segmentation |
2.4 Research Methodology |
2.5 Assumptions |
3 Benin Hollow Glass Microspheres Market Overview |
3.1 Benin Country Macro Economic Indicators |
3.2 Benin Hollow Glass Microspheres Market Revenues & Volume, 2022 & 2032F |
3.3 Benin Hollow Glass Microspheres Market - Industry Life Cycle |
3.4 Benin Hollow Glass Microspheres Market - Porter's Five Forces |
3.5 Benin Hollow Glass Microspheres Market Revenues & Volume Share, By Type, 2022 & 2032F |
3.6 Benin Hollow Glass Microspheres Market Revenues & Volume Share, By Application, 2022 & 2032F |
4 Benin Hollow Glass Microspheres Market Dynamics |
4.1 Impact Analysis |
4.2 Market Drivers |
4.2.1 Increasing demand for lightweight materials in industries such as automotive and aerospace |
4.2.2 Growing focus on energy efficiency and sustainable construction practices |
4.2.3 Advancements in technology leading to improved product quality and performance |
4.3 Market Restraints |
4.3.1 High manufacturing costs associated with hollow glass microspheres |
4.3.2 Limited awareness and adoption of the product in certain industries |
4.3.3 Lack of standardized testing methods and quality control measures |
5 Benin Hollow Glass Microspheres Market Trends |
6 Benin Hollow Glass Microspheres Market Segmentations |
6.1 Benin Hollow Glass Microspheres Market, By Type |
6.1.1 Overview and Analysis |
6.1.2 Benin Hollow Glass Microspheres Market Revenues & Volume, By Glass, 2022-2032F |
6.1.3 Benin Hollow Glass Microspheres Market Revenues & Volume, By Others, 2022-2032F |
6.2 Benin Hollow Glass Microspheres Market, By Application |
6.2.1 Overview and Analysis |
6.2.2 Benin Hollow Glass Microspheres Market Revenues & Volume, By Automotive, 2022-2032F |
6.2.3 Benin Hollow Glass Microspheres Market Revenues & Volume, By Aerospace & Defense, 2022-2032F |
6.2.4 Benin Hollow Glass Microspheres Market Revenues & Volume, By Building & Construction, 2022-2032F |
6.2.5 Benin Hollow Glass Microspheres Market Revenues & Volume, By Paints & Coatings, 2022-2032F |
6.2.6 Benin Hollow Glass Microspheres Market Revenues & Volume, By Electrical & Electronics, 2022-2032F |
6.2.7 Benin Hollow Glass Microspheres Market Revenues & Volume, By Cosmetics & Personal Care, 2022-2032F |
7 Benin Hollow Glass Microspheres Market Import-Export Trade Statistics |
7.1 Benin Hollow Glass Microspheres Market Export to Major Countries |
7.2 Benin Hollow Glass Microspheres Market Imports from Major Countries |
8 Benin Hollow Glass Microspheres Market Key Performance Indicators |
8.1 Research and development investment in new product innovations and applications |
8.2 Number of patents filed or granted related to hollow glass microspheres technology |
8.3 Percentage of companies incorporating hollow glass microspheres in their product offerings |
8.4 Environmental impact assessments and certifications for products containing hollow glass microspheres |
9 Benin Hollow Glass Microspheres Market - Opportunity Assessment |
9.1 Benin Hollow Glass Microspheres Market Opportunity Assessment, By Type, 2022 & 2032F |
9.2 Benin Hollow Glass Microspheres Market Opportunity Assessment, By Application, 2022 & 2032F |
10 Benin Hollow Glass Microspheres Market - Competitive Landscape |
10.1 Benin Hollow Glass Microspheres Market Revenue Share, By Companies, 2025 |
10.2 Benin Hollow Glass Microspheres Market Competitive Benchmarking, By Operating and Technical Parameters |
11 Company Profiles |
12 Recommendations | 13 Disclaimer |
Export potential assessment - trade Analytics for 2030
Export potential enables firms to identify high-growth global markets with greater confidence by combining advanced trade intelligence with a structured quantitative methodology. The framework analyzes emerging demand trends and country-level import patterns while integrating macroeconomic and trade datasets such as GDP and population forecasts, bilateral import–export flows, tariff structures, elasticity differentials between developed and developing economies, geographic distance, and import demand projections. Using weighted trade values from 2020–2024 as the base period to project country-to-country export potential for 2030, these inputs are operationalized through calculated drivers such as gravity model parameters, tariff impact factors, and projected GDP per-capita growth. Through an analysis of hidden potentials, demand hotspots, and market conditions that are most favorable to success, this method enables firms to focus on target countries, maximize returns, and global expansion with data, backed by accuracy.
By factoring in the projected importer demand gap that is currently unmet and could be potential opportunity, it identifies the potential for the Exporter (Country) among 190 countries, against the general trade analysis, which identifies the biggest importer or exporter.
To discover high-growth global markets and optimize your business strategy:
Click Here
Pricing
- Single User License$ 1,995
- Department License$ 2,400
- Site License$ 3,120
- Global License$ 3,795

Search
Thought Leadership and Analyst Meet


Our Clients
Latest Reports
- United Kingdom (UK) Long-term Care Insurance Market (2026-2032) | Growth, Share, Consumer Insights, Drivers, Opportunities, Competition, Pricing Analysis, Segments, Restraints, Companies, Competitive, Value, Outlook, Size, Demand, Analysis, Challenges, Strategic Insights, Investment Trends, Revenue, Trends, Supply, Forecast
- United Kingdom (UK) Long Term Care Market (2026-2032) | Companies, Outlook, Analysis, Trends, Value, Revenue, Segmentation, Share, Forecast, Competitive Landscape, Growth, Size & Forecast
- Iraq Insulation and Waterproofing Market (2026-2032) | Outlook, Drivers, Growth, Size, Share, Industry, Revenue, Trends, Demand, Competitive, Strategic Insights, Opportunities, Segments, Companies, Challenges, Strategy, Consumer Insights, Analysis, Investment Trends, Value, Segmentation, Forecast, Restraints
- India Switchgear Market Outlook (2026 - 2032) | Size, Share, Trends, Growth, Revenue, Forecast, Analysis, Value, Outlook
- Pakistan Contraceptive Implants Market (2025-2031) | Demand, Growth, Size, Share, Industry, Pricing Analysis, Competitive, Strategic Insights, Strategy, Consumer Insights, Analysis, Investment Trends, Opportunities, Revenue, Segments, Value, Segmentation, Supply, Forecast, Restraints, Outlook, Competition, Drivers, Trends, Companies, Challenges
- Sri Lanka Packaging Market (2026-2032) | Outlook, Competition, Drivers, Trends, Demand, Pricing Analysis, Competitive, Strategic Insights, Companies, Challenges, Strategy, Consumer Insights, Analysis, Investment Trends, Opportunities, Growth, Size, Share, Industry, Revenue, Segments, Value, Segmentation, Supply, Forecast, Restraints
- India Kids Watches Market (2026-2032) | Strategy, Consumer Insights, Analysis, Investment Trends, Opportunities, Growth, Size, Share, Industry, Revenue, Segments, Value, Segmentation, Supply, Forecast, Restraints, Outlook, Competition, Drivers, Trends, Demand, Pricing Analysis, Competitive, Strategic Insights, Companies, Challenges
- Saudi Arabia Core Assurance Service Market (2025-2031) | Strategy, Consumer Insights, Analysis, Investment Trends, Opportunities, Growth, Size, Share, Industry, Revenue, Segments, Value, Segmentation, Supply, Forecast, Restraints, Outlook, Competition, Drivers, Trends, Demand, Pricing Analysis, Competitive, Strategic Insights, Companies, Challenges
- Romania Uninterruptible Power Supply (UPS) Market (2026-2032) | Industry, Analysis, Revenue, Size, Forecast, Outlook, Value, Trends, Share, Growth & Companies
- Saudi Arabia Car Window Tinting Film, Paint Protection Film (PPF), and Ceramic Coating Market (2025-2031) | Strategy, Consumer Insights, Analysis, Investment Trends, Opportunities, Growth, Size, Share, Industry, Revenue, Segments, Value, Segmentation, Supply, Forecast, Restraints, Outlook, Competition, Drivers, Trends, Demand, Pricing Analysis, Competitive, Strategic Insights, Companies, Challenges
Industry Events and Analyst Meet

India EV Show 2026

EV tech India Expo 2026

Auto Tech Asia 2026

Battery Tech India 2026

Smart Production Solutions Guangzhou 2026
Whitepaper
- Middle East & Africa Commercial Security Market Click here to view more.
- Middle East & Africa Fire Safety Systems & Equipment Market Click here to view more.
- GCC Drone Market Click here to view more.
- Middle East Lighting Fixture Market Click here to view more.
- GCC Physical & Perimeter Security Market Click here to view more.
6WResearch In News
- Doha a strategic location for EV manufacturing hub: IPA Qatar
- Demand for luxury TVs surging in the GCC, says Samsung
- Empowering Growth: The Thriving Journey of Bangladesh’s Cable Industry
- Demand for luxury TVs surging in the GCC, says Samsung
- Video call with a traditional healer? Once unthinkable, it’s now common in South Africa
- Intelligent Buildings To Smooth GCC’s Path To Net Zero