Brazil Anthranilic Acid Market (2025-2031) Outlook | Companies, Revenue, Industry, Forecast, Value, Trends, Analysis, Share, Growth & Size
Market Forecast By Product (Pharmaceutical Grade, Industrial Grade), By Applications (Dye, Pharmaceutical, Others) And Competitive Landscape
| Product Code: ETC312542 | Publication Date: Aug 2022 | Updated Date: Oct 2025 | Product Type: Market Research Report | |
| Publisher: 6Wresearch | Author: Shubham Padhi | No. of Pages: 75 | No. of Figures: 35 | No. of Tables: 20 |
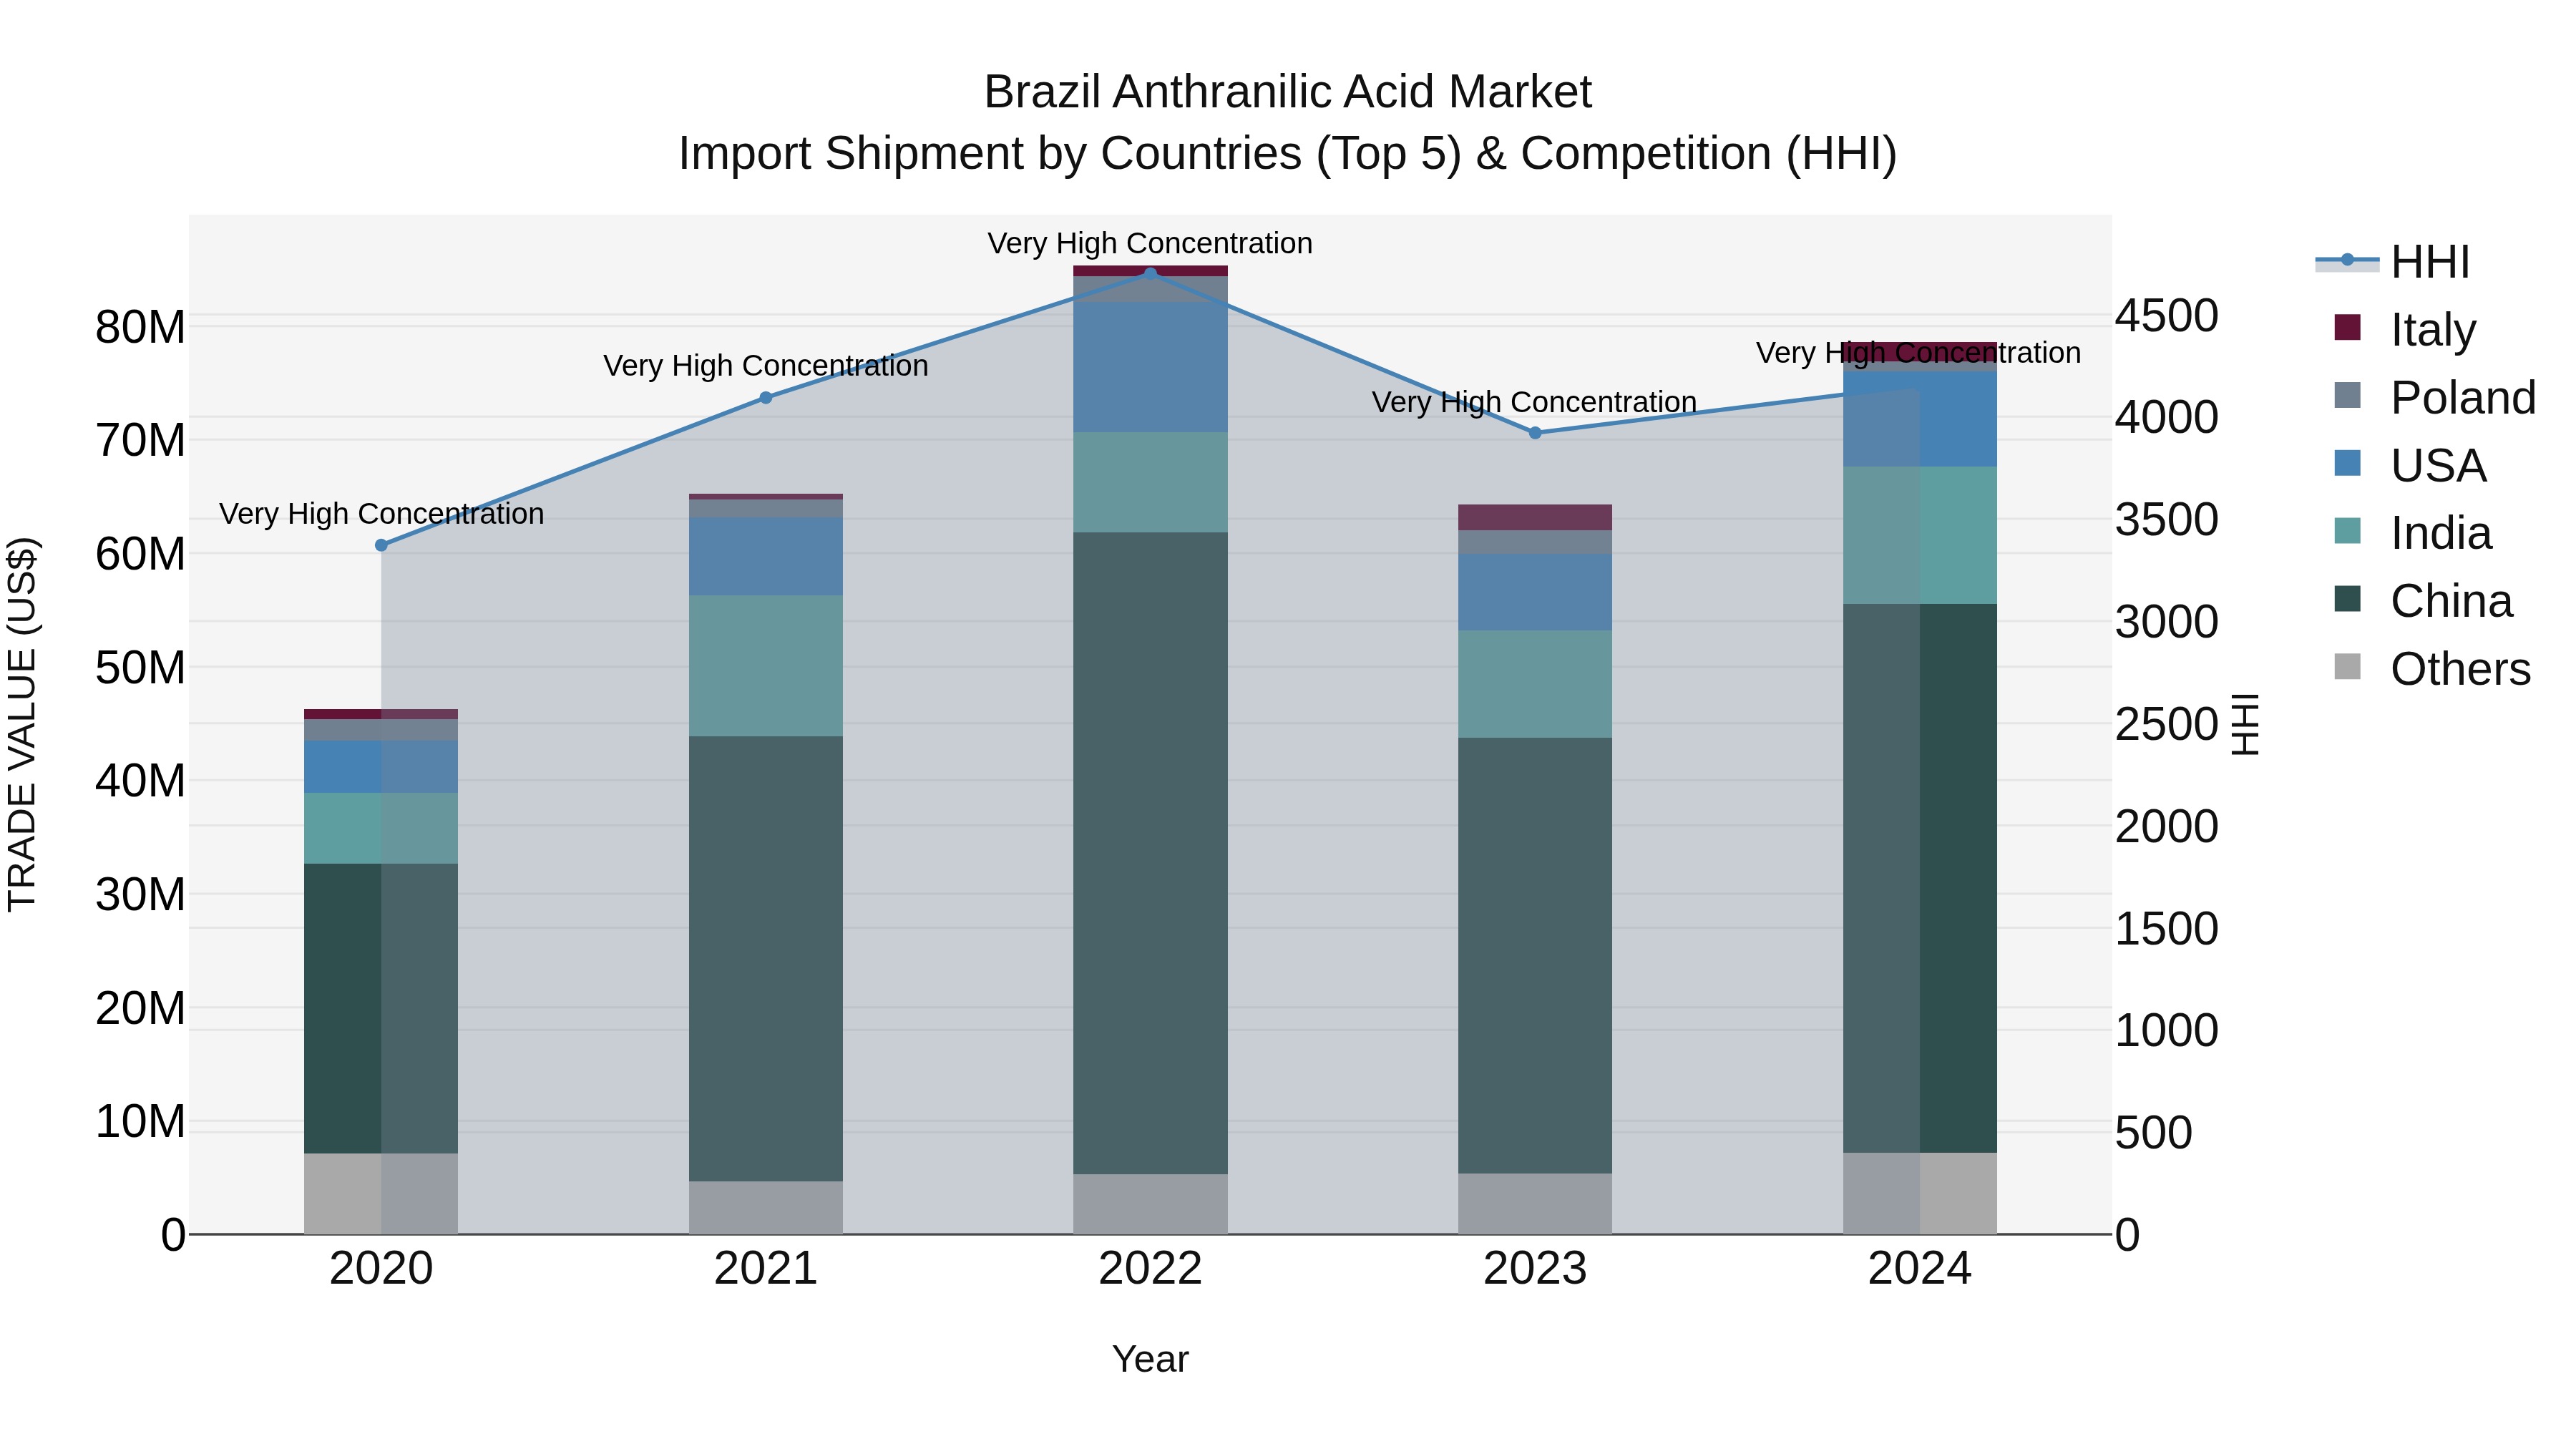
Brazil Anthranilic Acid Market Top 5 Importing Countries and Market Competition (HHI) Analysis
In 2024, Brazil continued to be a key importer of anthranilic acid, with top suppliers being China, India, USA, Germany, and Italy. The market concentration, as measured by HHI, remained significantly high, indicating limited supplier diversity. The compound annual growth rate (CAGR) for anthranilic acid imports from 2020 to 2024 was a robust 14.16%, with an impressive growth rate of 22.25% from 2023 to 2024. This data suggests a strong demand for anthranilic acid in Brazil, potentially driven by various industries such as pharmaceuticals, agriculture, and chemical manufacturing.
Brazil Anthranilic Acid Market Overview
Anthranilic acid is a chemical compound used as an intermediate in the synthesis of pharmaceuticals, dyes, and perfumes. In Brazil, the anthranilic acid market serves industries such as pharmaceuticals, agrochemicals, and cosmetics, providing raw materials for manufacturing active ingredients, colorants, and fragrance compounds.
Drivers of the market
The Brazil Anthranilic Acid market is influenced by factors such as chemical synthesis, pharmaceutical intermediates, and demand for aromatic compounds. Anthranilic acid, an aromatic carboxylic acid, serves as a precursor for producing dyes, pharmaceuticals, and agrochemicals. With the expansion of chemical manufacturing, increasing demand for specialty chemicals, and growth of pharmaceutical formulations in Brazil, the market witnesses steady growth, supported by the versatility and reactivity of anthranilic acid for synthesizing valuable intermediates and active ingredients in various industrial sectors.
Challenges of the market
The anthranilic acid market in Brazil faces challenges related to environmental regulations, raw material availability, and competition from alternative chemical intermediates. Economic uncertainties and fluctuating demand from end-user industries further impact market dynamics. To navigate these challenges, companies should focus on process optimization, sustainable sourcing practices, and product diversification.
Government Policy of the market
The Brazil government regulates the anthranilic acid market to ensure chemical safety, environmental protection, and industrial development. Regulatory frameworks may include standards for chemical production, handling practices, and waste management protocols to minimize environmental pollution and worker exposure to hazardous substances. Additionally, government policies may address issues such as chemical registration, import/export regulations, and industry collaboration to support responsible and sustainable practices in the Brazil anthranilic acid market.
Key Highlights of the Report:
- Brazil Anthranilic Acid Market Outlook
- Market Size of Brazil Anthranilic Acid Market, 2024
- Forecast of Brazil Anthranilic Acid Market, 2031
- Historical Data and Forecast of Brazil Anthranilic Acid Revenues & Volume for the Period 2021-2031
- Brazil Anthranilic Acid Market Trend Evolution
- Brazil Anthranilic Acid Market Drivers and Challenges
- Brazil Anthranilic Acid Price Trends
- Brazil Anthranilic Acid Porter's Five Forces
- Brazil Anthranilic Acid Industry Life Cycle
- Historical Data and Forecast of Brazil Anthranilic Acid Market Revenues & Volume By Product for the Period 2021-2031
- Historical Data and Forecast of Brazil Anthranilic Acid Market Revenues & Volume By Pharmaceutical Grade for the Period 2021-2031
- Historical Data and Forecast of Brazil Anthranilic Acid Market Revenues & Volume By Industrial Grade for the Period 2021-2031
- Historical Data and Forecast of Brazil Anthranilic Acid Market Revenues & Volume By Applications for the Period 2021-2031
- Historical Data and Forecast of Brazil Anthranilic Acid Market Revenues & Volume By Dye for the Period 2021-2031
- Historical Data and Forecast of Brazil Anthranilic Acid Market Revenues & Volume By Pharmaceutical for the Period 2021-2031
- Historical Data and Forecast of Brazil Anthranilic Acid Market Revenues & Volume By Others for the Period 2021-2031
- Brazil Anthranilic Acid Import Export Trade Statistics
- Market Opportunity Assessment By Product
- Market Opportunity Assessment By Applications
- Brazil Anthranilic Acid Top Companies Market Share
- Brazil Anthranilic Acid Competitive Benchmarking By Technical and Operational Parameters
- Brazil Anthranilic Acid Company Profiles
- Brazil Anthranilic Acid Key Strategic Recommendations
Frequently Asked Questions About the Market Study (FAQs):
6Wresearch actively monitors the Brazil Anthranilic Acid Market and publishes its comprehensive annual report, highlighting emerging trends, growth drivers, revenue analysis, and forecast outlook. Our insights help businesses to make data-backed strategic decisions with ongoing market dynamics. Our analysts track relevent industries related to the Brazil Anthranilic Acid Market, allowing our clients with actionable intelligence and reliable forecasts tailored to emerging regional needs.
Yes, we provide customisation as per your requirements. To learn more, feel free to contact us on sales@6wresearch.com
1 Executive Summary |
2 Introduction |
2.1 Key Highlights of the Report |
2.2 Report Description |
2.3 Market Scope & Segmentation |
2.4 Research Methodology |
2.5 Assumptions |
3 Brazil Anthranilic Acid Market Overview |
3.1 Brazil Country Macro Economic Indicators |
3.2 Brazil Anthranilic Acid Market Revenues & Volume, 2021 & 2031F |
3.3 Brazil Anthranilic Acid Market - Industry Life Cycle |
3.4 Brazil Anthranilic Acid Market - Porter's Five Forces |
3.5 Brazil Anthranilic Acid Market Revenues & Volume Share, By Product, 2021 & 2031F |
3.6 Brazil Anthranilic Acid Market Revenues & Volume Share, By Applications, 2021 & 2031F |
4 Brazil Anthranilic Acid Market Dynamics |
4.1 Impact Analysis |
4.2 Market Drivers |
4.2.1 Increasing demand for anthranilic acid in the pharmaceutical industry for the production of various drugs. |
4.2.2 Growth in the agriculture sector leading to higher demand for anthranilic acid-based pesticides. |
4.2.3 Rising investments in research and development activities for innovative applications of anthranilic acid. |
4.3 Market Restraints |
4.3.1 Fluctuations in raw material prices affecting the production cost of anthranilic acid. |
4.3.2 Stringent regulations and compliance requirements in the chemical industry. |
4.3.3 Competition from substitute products impacting the market growth. |
5 Brazil Anthranilic Acid Market Trends |
6 Brazil Anthranilic Acid Market, By Types |
6.1 Brazil Anthranilic Acid Market, By Product |
6.1.1 Overview and Analysis |
6.1.2 Brazil Anthranilic Acid Market Revenues & Volume, By Product, 2021-2031F |
6.1.3 Brazil Anthranilic Acid Market Revenues & Volume, By Pharmaceutical Grade, 2021-2031F |
6.1.4 Brazil Anthranilic Acid Market Revenues & Volume, By Industrial Grade, 2021-2031F |
6.2 Brazil Anthranilic Acid Market, By Applications |
6.2.1 Overview and Analysis |
6.2.2 Brazil Anthranilic Acid Market Revenues & Volume, By Dye, 2021-2031F |
6.2.3 Brazil Anthranilic Acid Market Revenues & Volume, By Pharmaceutical, 2021-2031F |
6.2.4 Brazil Anthranilic Acid Market Revenues & Volume, By Others, 2021-2031F |
7 Brazil Anthranilic Acid Market Import-Export Trade Statistics |
7.1 Brazil Anthranilic Acid Market Export to Major Countries |
7.2 Brazil Anthranilic Acid Market Imports from Major Countries |
8 Brazil Anthranilic Acid Market Key Performance Indicators |
8.1 Research and development investment in anthranilic acid-based products. |
8.2 Number of patents filed for new applications of anthranilic acid. |
8.3 Growth in the pharmaceutical and agriculture industries, indicating potential demand for anthranilic acid. |
9 Brazil Anthranilic Acid Market - Opportunity Assessment |
9.1 Brazil Anthranilic Acid Market Opportunity Assessment, By Product, 2021 & 2031F |
9.2 Brazil Anthranilic Acid Market Opportunity Assessment, By Applications, 2021 & 2031F |
10 Brazil Anthranilic Acid Market - Competitive Landscape |
10.1 Brazil Anthranilic Acid Market Revenue Share, By Companies, 2024 |
10.2 Brazil Anthranilic Acid Market Competitive Benchmarking, By Operating and Technical Parameters |
11 Company Profiles |
12 Recommendations |
13 Disclaimer |
Export potential assessment - trade Analytics for 2030
Export potential enables firms to identify high-growth global markets with greater confidence by combining advanced trade intelligence with a structured quantitative methodology. The framework analyzes emerging demand trends and country-level import patterns while integrating macroeconomic and trade datasets such as GDP and population forecasts, bilateral import–export flows, tariff structures, elasticity differentials between developed and developing economies, geographic distance, and import demand projections. Using weighted trade values from 2020–2024 as the base period to project country-to-country export potential for 2030, these inputs are operationalized through calculated drivers such as gravity model parameters, tariff impact factors, and projected GDP per-capita growth. Through an analysis of hidden potentials, demand hotspots, and market conditions that are most favorable to success, this method enables firms to focus on target countries, maximize returns, and global expansion with data, backed by accuracy.
By factoring in the projected importer demand gap that is currently unmet and could be potential opportunity, it identifies the potential for the Exporter (Country) among 190 countries, against the general trade analysis, which identifies the biggest importer or exporter.
To discover high-growth global markets and optimize your business strategy:
Click Here
Pricing
- Single User License$ 1,995
- Department License$ 2,400
- Site License$ 3,120
- Global License$ 3,795

Search
Thought Leadership and Analyst Meet


Our Clients
Latest Reports
- United Kingdom (UK) Long-term Care Insurance Market (2026-2032) | Growth, Share, Consumer Insights, Drivers, Opportunities, Competition, Pricing Analysis, Segments, Restraints, Companies, Competitive, Value, Outlook, Size, Demand, Analysis, Challenges, Strategic Insights, Investment Trends, Revenue, Trends, Supply, Forecast
- United Kingdom (UK) Long Term Care Market (2026-2032) | Companies, Outlook, Analysis, Trends, Value, Revenue, Segmentation, Share, Forecast, Competitive Landscape, Growth, Size & Forecast
- Iraq Insulation and Waterproofing Market (2026-2032) | Outlook, Drivers, Growth, Size, Share, Industry, Revenue, Trends, Demand, Competitive, Strategic Insights, Opportunities, Segments, Companies, Challenges, Strategy, Consumer Insights, Analysis, Investment Trends, Value, Segmentation, Forecast, Restraints
- India Switchgear Market Outlook (2026 - 2032) | Size, Share, Trends, Growth, Revenue, Forecast, Analysis, Value, Outlook
- Pakistan Contraceptive Implants Market (2025-2031) | Demand, Growth, Size, Share, Industry, Pricing Analysis, Competitive, Strategic Insights, Strategy, Consumer Insights, Analysis, Investment Trends, Opportunities, Revenue, Segments, Value, Segmentation, Supply, Forecast, Restraints, Outlook, Competition, Drivers, Trends, Companies, Challenges
- Sri Lanka Packaging Market (2026-2032) | Outlook, Competition, Drivers, Trends, Demand, Pricing Analysis, Competitive, Strategic Insights, Companies, Challenges, Strategy, Consumer Insights, Analysis, Investment Trends, Opportunities, Growth, Size, Share, Industry, Revenue, Segments, Value, Segmentation, Supply, Forecast, Restraints
- India Kids Watches Market (2026-2032) | Strategy, Consumer Insights, Analysis, Investment Trends, Opportunities, Growth, Size, Share, Industry, Revenue, Segments, Value, Segmentation, Supply, Forecast, Restraints, Outlook, Competition, Drivers, Trends, Demand, Pricing Analysis, Competitive, Strategic Insights, Companies, Challenges
- Saudi Arabia Core Assurance Service Market (2025-2031) | Strategy, Consumer Insights, Analysis, Investment Trends, Opportunities, Growth, Size, Share, Industry, Revenue, Segments, Value, Segmentation, Supply, Forecast, Restraints, Outlook, Competition, Drivers, Trends, Demand, Pricing Analysis, Competitive, Strategic Insights, Companies, Challenges
- Romania Uninterruptible Power Supply (UPS) Market (2026-2032) | Industry, Analysis, Revenue, Size, Forecast, Outlook, Value, Trends, Share, Growth & Companies
- Saudi Arabia Car Window Tinting Film, Paint Protection Film (PPF), and Ceramic Coating Market (2025-2031) | Strategy, Consumer Insights, Analysis, Investment Trends, Opportunities, Growth, Size, Share, Industry, Revenue, Segments, Value, Segmentation, Supply, Forecast, Restraints, Outlook, Competition, Drivers, Trends, Demand, Pricing Analysis, Competitive, Strategic Insights, Companies, Challenges
Industry Events and Analyst Meet

India EV Show 2026

EV tech India Expo 2026

Auto Tech Asia 2026

Battery Tech India 2026

Smart Production Solutions Guangzhou 2026
Whitepaper
- Middle East & Africa Commercial Security Market Click here to view more.
- Middle East & Africa Fire Safety Systems & Equipment Market Click here to view more.
- GCC Drone Market Click here to view more.
- Middle East Lighting Fixture Market Click here to view more.
- GCC Physical & Perimeter Security Market Click here to view more.
6WResearch In News
- Doha a strategic location for EV manufacturing hub: IPA Qatar
- Demand for luxury TVs surging in the GCC, says Samsung
- Empowering Growth: The Thriving Journey of Bangladesh’s Cable Industry
- Demand for luxury TVs surging in the GCC, says Samsung
- Video call with a traditional healer? Once unthinkable, it’s now common in South Africa
- Intelligent Buildings To Smooth GCC’s Path To Net Zero