Brazil Graphing Calculator Market (2025-2031) Outlook | Value, Share, Industry, Size, Analysis, Trends, Companies, Revenue, Growth & Forecast
Market Forecast By Display (Colored, Black & White), By Application (Education, Gaming, Others) And Competitive Landscape
| Product Code: ETC364622 | Publication Date: Aug 2022 | Updated Date: Oct 2025 | Product Type: Market Research Report | |
| Publisher: 6Wresearch | Author: Shubham Padhi | No. of Pages: 75 | No. of Figures: 35 | No. of Tables: 20 |
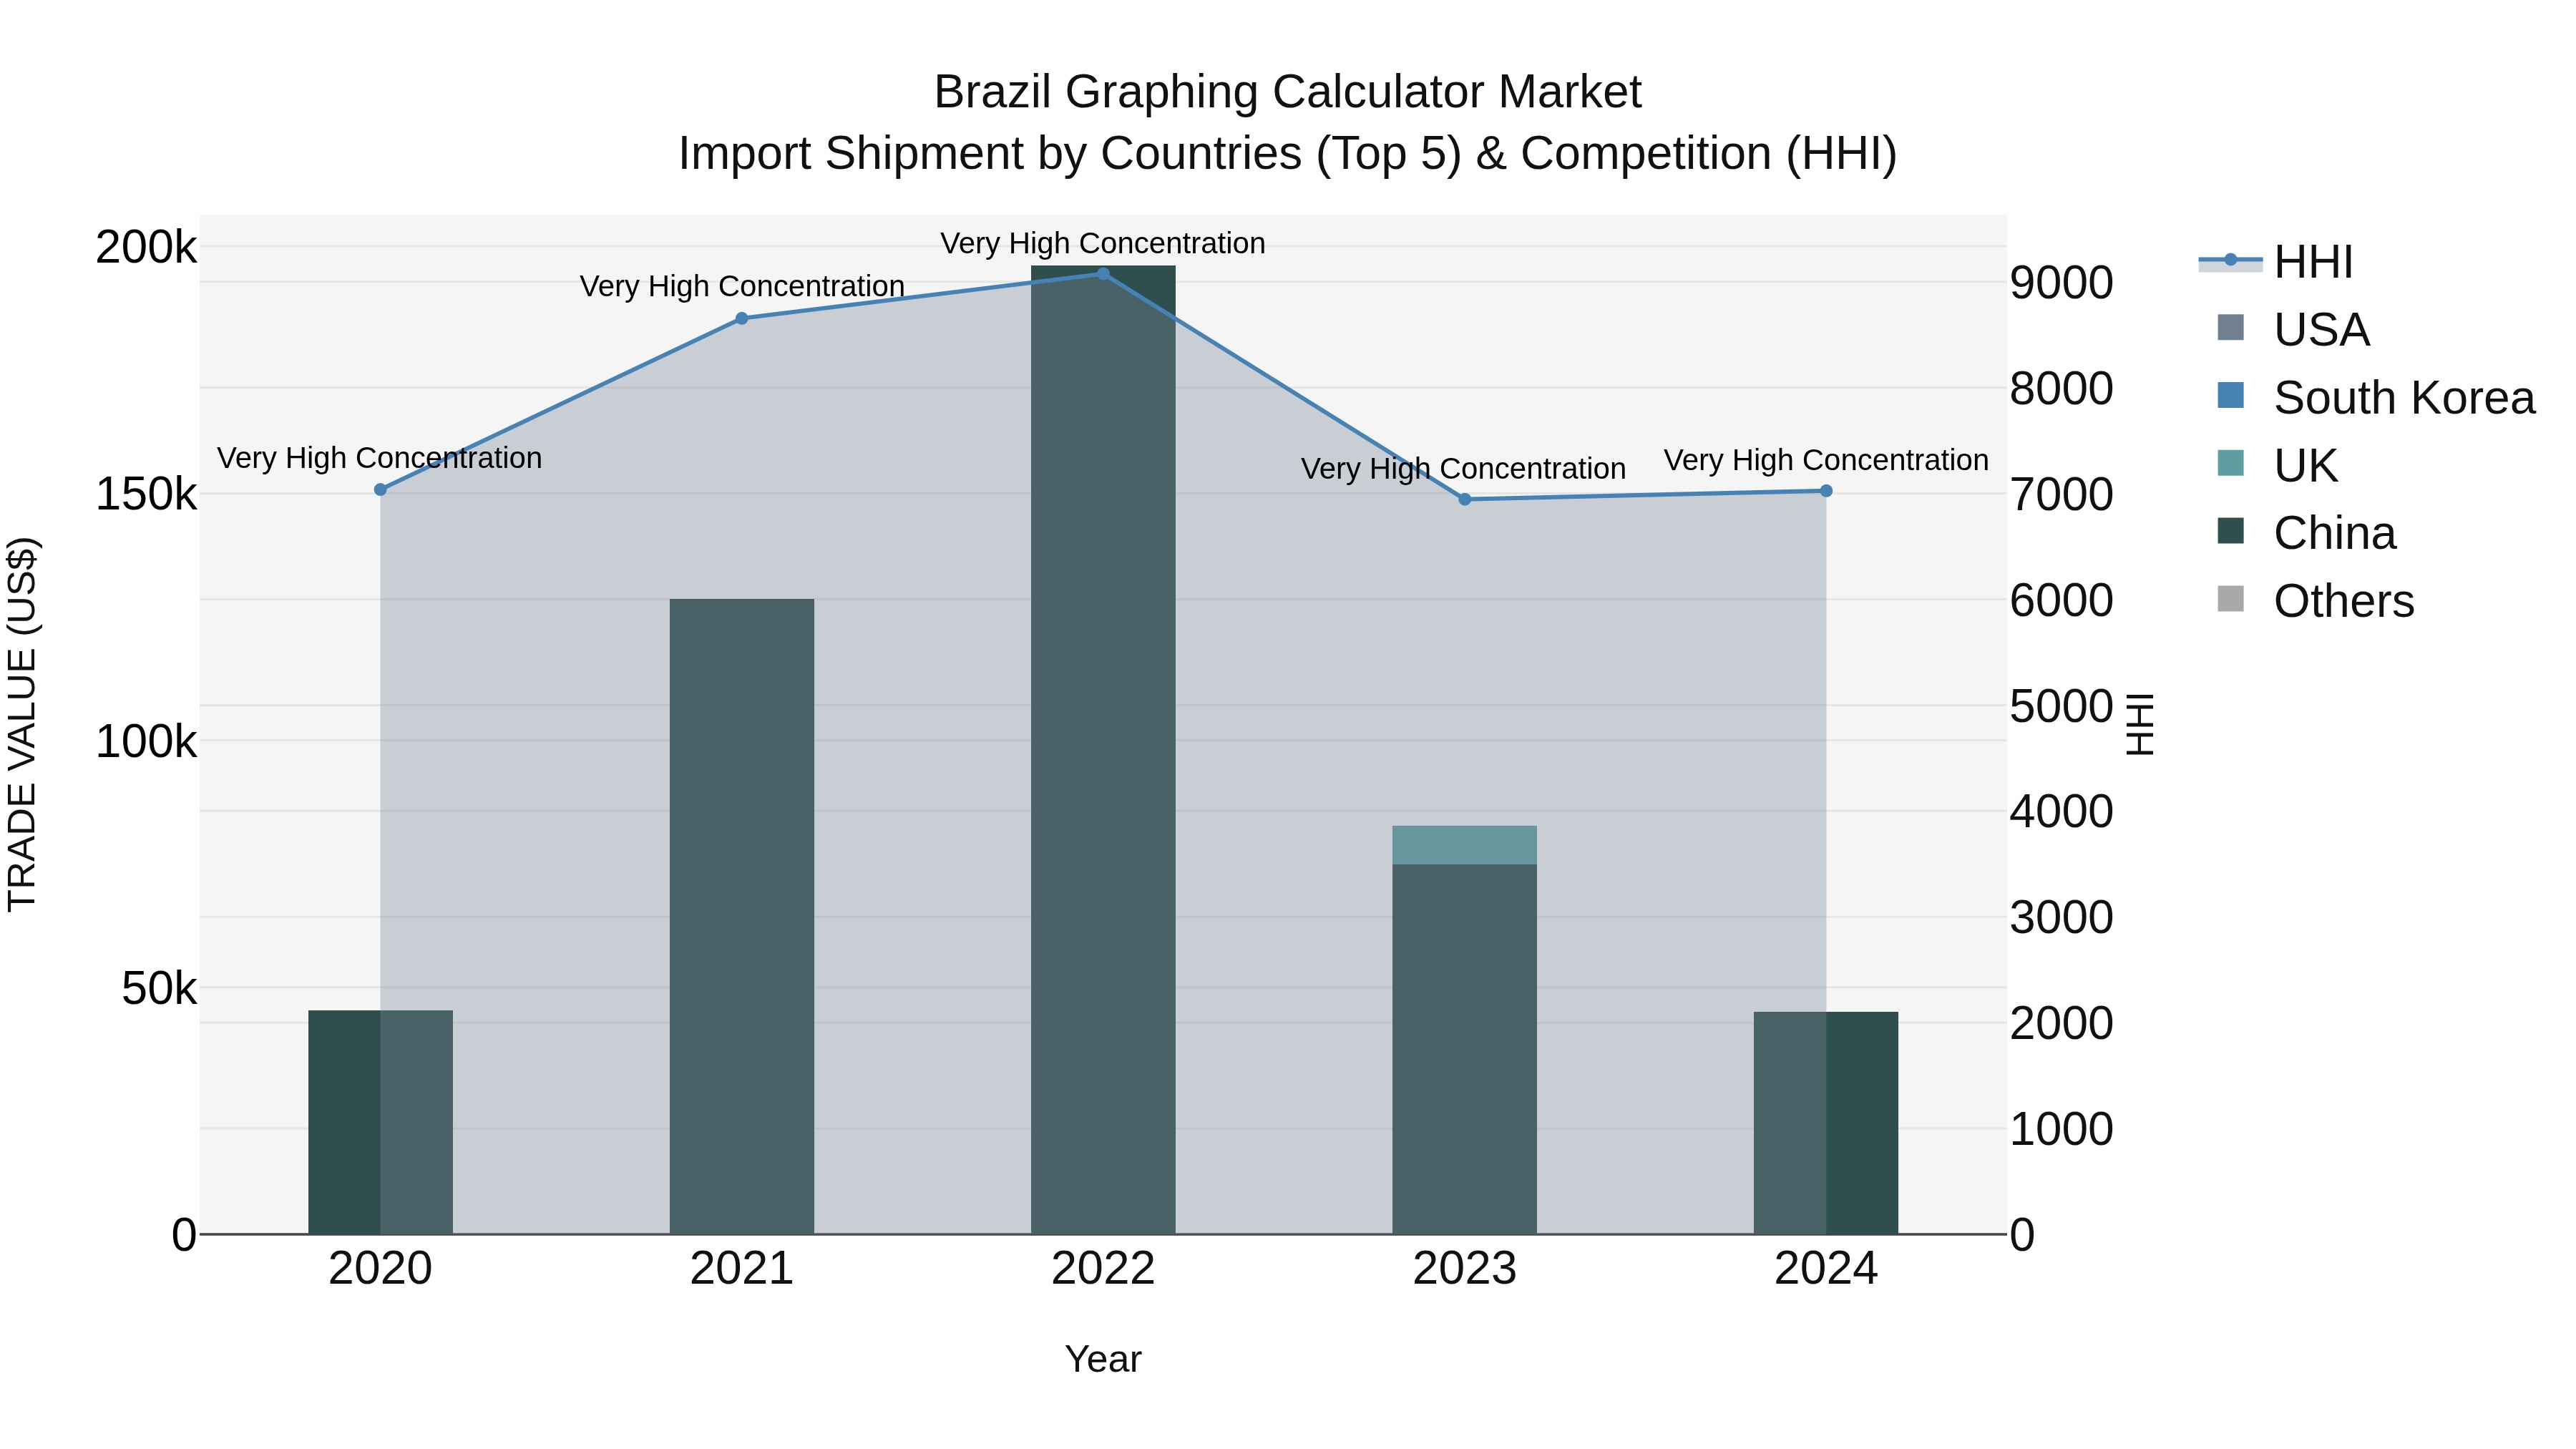
Brazil Graphing Calculator Market Top 5 Importing Countries and Market Competition (HHI) Analysis
Brazil`s graphing calculator import shipments in 2024 continued to be dominated by top exporting countries such as China, South Korea, UK, and USA. Despite a negative Compound Annual Growth Rate (CAGR) of -0.15% from 2020 to 2024, the market experienced a significant decline with a growth rate of -45.51% in 2024 compared to the previous year. The Herfindahl-Hirschman Index (HHI) indicated a very high concentration within the market, suggesting limited competition and potential challenges for new entrants.
Brazil Graphing Calculator Market Overview
Graphing calculators are essential tools in education, engineering, and scientific research in Brazil. The market for graphing calculators is influenced by educational reforms, technological advancements, and the adoption of digital learning platforms.
Drivers of the market
The graphing calculator market in Brazil experiences growth due to several driving factors. Firstly, the increasing adoption of graphing calculators in education, particularly in mathematics and science disciplines, fuels market expansion. Graphing calculators offer advanced mathematical functions and graphical capabilities, facilitating complex calculations and data analysis tasks for students and professionals alike. Additionally, government initiatives promoting STEM (science, technology, engineering, and mathematics) education emphasize the importance of technology-enabled learning tools, further stimulating market demand. Moreover, technological advancements, such as the integration of touchscreen interfaces and wireless connectivity, enhance calculator functionality and user experience, driving further market growth.
Challenges of the market
The graphing calculator market in Brazil faces challenges in adapting to the changing landscape of education technology. Integrating advanced features and maintaining affordability for students are ongoing concerns for market players.
Government Policy of the market
Recognizing the importance of mathematics education and technological literacy, the Brazil government is implementing policies to enhance access to graphing calculators for students and educators. This includes initiatives to subsidize the cost of graphing calculators, distribute them to schools in underserved areas, and integrate calculator-based learning resources into the curriculum. Additionally, the government is promoting public-private partnerships to develop affordable and user-friendly calculator solutions tailored to the needs of the Brazil education system.
Key Highlights of the Report:
- Brazil Graphing Calculator Market Outlook
- Market Size of Brazil Graphing Calculator Market, 2024
- Forecast of Brazil Graphing Calculator Market, 2031
- Historical Data and Forecast of Brazil Graphing Calculator Revenues & Volume for the Period 2021-2031
- Brazil Graphing Calculator Market Trend Evolution
- Brazil Graphing Calculator Market Drivers and Challenges
- Brazil Graphing Calculator Price Trends
- Brazil Graphing Calculator Porter's Five Forces
- Brazil Graphing Calculator Industry Life Cycle
- Historical Data and Forecast of Brazil Graphing Calculator Market Revenues & Volume By Display for the Period 2021-2031
- Historical Data and Forecast of Brazil Graphing Calculator Market Revenues & Volume By Colored for the Period 2021-2031
- Historical Data and Forecast of Brazil Graphing Calculator Market Revenues & Volume By Black & White for the Period 2021-2031
- Historical Data and Forecast of Brazil Graphing Calculator Market Revenues & Volume By Application for the Period 2021-2031
- Historical Data and Forecast of Brazil Graphing Calculator Market Revenues & Volume By Education for the Period 2021-2031
- Historical Data and Forecast of Brazil Graphing Calculator Market Revenues & Volume By Gaming for the Period 2021-2031
- Historical Data and Forecast of Brazil Graphing Calculator Market Revenues & Volume By Others for the Period 2021-2031
- Brazil Graphing Calculator Import Export Trade Statistics
- Market Opportunity Assessment By Display
- Market Opportunity Assessment By Application
- Brazil Graphing Calculator Top Companies Market Share
- Brazil Graphing Calculator Competitive Benchmarking By Technical and Operational Parameters
- Brazil Graphing Calculator Company Profiles
- Brazil Graphing Calculator Key Strategic Recommendations
Frequently Asked Questions About the Market Study (FAQs):
6Wresearch actively monitors the Brazil Graphing Calculator Market and publishes its comprehensive annual report, highlighting emerging trends, growth drivers, revenue analysis, and forecast outlook. Our insights help businesses to make data-backed strategic decisions with ongoing market dynamics. Our analysts track relevent industries related to the Brazil Graphing Calculator Market, allowing our clients with actionable intelligence and reliable forecasts tailored to emerging regional needs.
Yes, we provide customisation as per your requirements. To learn more, feel free to contact us on sales@6wresearch.com
Export potential assessment - trade Analytics for 2030
Export potential enables firms to identify high-growth global markets with greater confidence by combining advanced trade intelligence with a structured quantitative methodology. The framework analyzes emerging demand trends and country-level import patterns while integrating macroeconomic and trade datasets such as GDP and population forecasts, bilateral import–export flows, tariff structures, elasticity differentials between developed and developing economies, geographic distance, and import demand projections. Using weighted trade values from 2020–2024 as the base period to project country-to-country export potential for 2030, these inputs are operationalized through calculated drivers such as gravity model parameters, tariff impact factors, and projected GDP per-capita growth. Through an analysis of hidden potentials, demand hotspots, and market conditions that are most favorable to success, this method enables firms to focus on target countries, maximize returns, and global expansion with data, backed by accuracy.
By factoring in the projected importer demand gap that is currently unmet and could be potential opportunity, it identifies the potential for the Exporter (Country) among 190 countries, against the general trade analysis, which identifies the biggest importer or exporter.
To discover high-growth global markets and optimize your business strategy:
Click Here
Pricing
- Single User License$ 1,995
- Department License$ 2,400
- Site License$ 3,120
- Global License$ 3,795

Search
Thought Leadership and Analyst Meet


Our Clients
Related Reports
- India Switchgear Market Outlook (2026 - 2032) | Size, Share, Trends, Growth, Revenue, Forecast, Analysis, Value, Outlook
- Pakistan Contraceptive Implants Market (2025-2031) | Demand, Growth, Size, Share, Industry, Pricing Analysis, Competitive, Strategic Insights, Strategy, Consumer Insights, Analysis, Investment Trends, Opportunities, Revenue, Segments, Value, Segmentation, Supply, Forecast, Restraints, Outlook, Competition, Drivers, Trends, Companies, Challenges
- Sri Lanka Packaging Market (2026-2032) | Outlook, Competition, Drivers, Trends, Demand, Pricing Analysis, Competitive, Strategic Insights, Companies, Challenges, Strategy, Consumer Insights, Analysis, Investment Trends, Opportunities, Growth, Size, Share, Industry, Revenue, Segments, Value, Segmentation, Supply, Forecast, Restraints
- India Kids Watches Market (2026-2032) | Strategy, Consumer Insights, Analysis, Investment Trends, Opportunities, Growth, Size, Share, Industry, Revenue, Segments, Value, Segmentation, Supply, Forecast, Restraints, Outlook, Competition, Drivers, Trends, Demand, Pricing Analysis, Competitive, Strategic Insights, Companies, Challenges
- Saudi Arabia Core Assurance Service Market (2025-2031) | Strategy, Consumer Insights, Analysis, Investment Trends, Opportunities, Growth, Size, Share, Industry, Revenue, Segments, Value, Segmentation, Supply, Forecast, Restraints, Outlook, Competition, Drivers, Trends, Demand, Pricing Analysis, Competitive, Strategic Insights, Companies, Challenges
- Romania Uninterruptible Power Supply (UPS) Market (2026-2032) | Industry, Analysis, Revenue, Size, Forecast, Outlook, Value, Trends, Share, Growth & Companies
- Saudi Arabia Car Window Tinting Film, Paint Protection Film (PPF), and Ceramic Coating Market (2025-2031) | Strategy, Consumer Insights, Analysis, Investment Trends, Opportunities, Growth, Size, Share, Industry, Revenue, Segments, Value, Segmentation, Supply, Forecast, Restraints, Outlook, Competition, Drivers, Trends, Demand, Pricing Analysis, Competitive, Strategic Insights, Companies, Challenges
- South Africa Stationery Market (2025-2031) | Share, Size, Industry, Value, Growth, Revenue, Analysis, Trends, Segmentation & Outlook
- Afghanistan Rocking Chairs And Adirondack Chairs Market (2026-2032) | Size & Revenue, Competitive Landscape, Share, Segmentation, Industry, Value, Outlook, Analysis, Trends, Growth, Forecast, Companies
- Afghanistan Apparel Market (2026-2032) | Growth, Outlook, Industry, Segmentation, Forecast, Size, Companies, Trends, Value, Share, Analysis & Revenue
Industry Events and Analyst Meet

India EV Show 2026

EV tech India Expo 2026

Auto Tech Asia 2026

Battery Tech India 2026

Smart Production Solutions Guangzhou 2026
Whitepaper
- Middle East & Africa Commercial Security Market Click here to view more.
- Middle East & Africa Fire Safety Systems & Equipment Market Click here to view more.
- GCC Drone Market Click here to view more.
- Middle East Lighting Fixture Market Click here to view more.
- GCC Physical & Perimeter Security Market Click here to view more.
6WResearch In News
- Doha a strategic location for EV manufacturing hub: IPA Qatar
- Demand for luxury TVs surging in the GCC, says Samsung
- Empowering Growth: The Thriving Journey of Bangladesh’s Cable Industry
- Demand for luxury TVs surging in the GCC, says Samsung
- Video call with a traditional healer? Once unthinkable, it’s now common in South Africa
- Intelligent Buildings To Smooth GCC’s Path To Net Zero