Brazil Rosin Market Outlook | Companies, Growth, COVID-19 IMPACT, Analysis, Value, Revenue, Trends, Share, Industry, Forecast & Size
Market Forecast By Rosin Type (Gum, Wood, Tall Oil), By Application (Adhesives, Paints and Varnishes, Rubbers, Paper Sizing and Fillers, Printing Inks, Other Applications) And Competitive Landscape
| Product Code: ETC107061 | Publication Date: Jun 2021 | Updated Date: Oct 2025 | Product Type: Report | |
| Publisher: 6Wresearch | Author: Ravi Bhandari | No. of Pages: 70 | No. of Figures: 35 | No. of Tables: 5 |
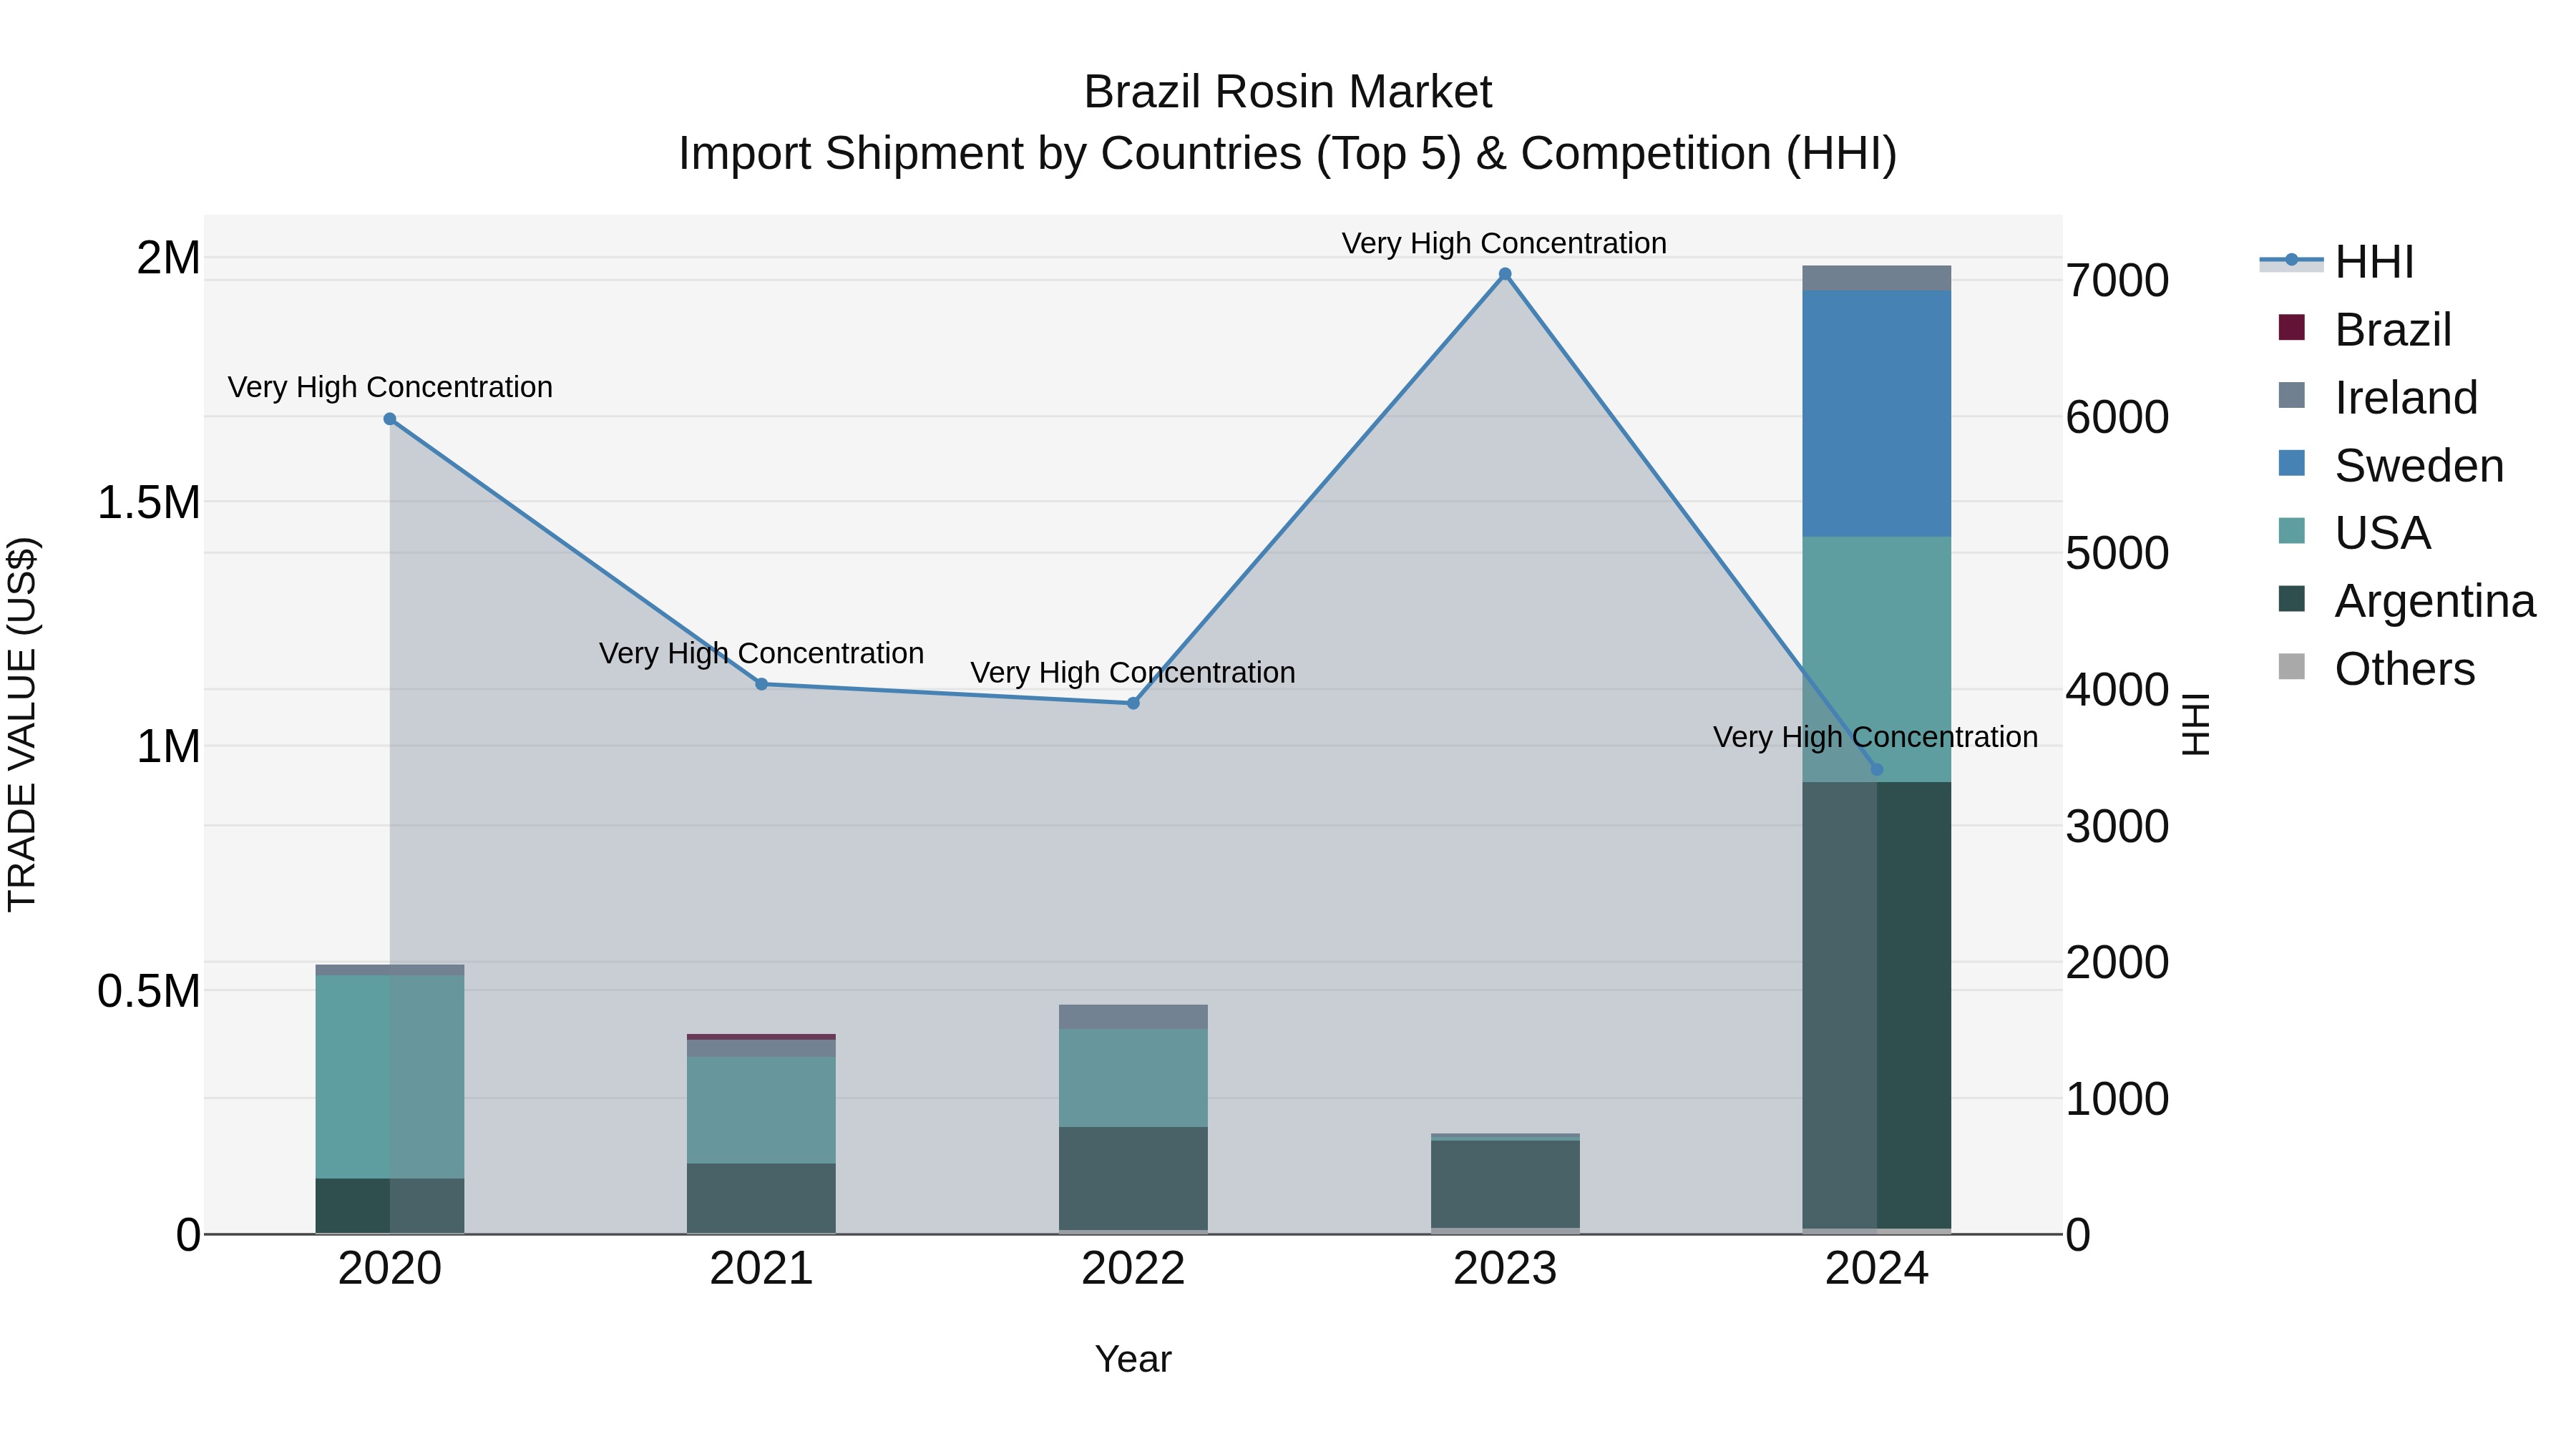
Brazil Rosin Market Top 5 Importing Countries and Market Competition (HHI) Analysis
Brazil`s rosin import market continues to show significant growth, with a remarkable CAGR of 37.68% from 2020 to 2024. In 2024, the top countries exporting rosin to Brazil are Argentina, Sweden, USA, Ireland, and Germany, indicating a diverse range of sources. Despite this diversity, the market remains highly concentrated, as reflected by the high HHI. The exceptional growth rate of 861.69% from 2023 to 2024 highlights the increasing demand for rosin in Brazil, making it an attractive market for exporters.
Brazil Rosin Market Overview
The Brazil Rosin market, driven by applications in adhesives, inks, and the food industry, faces challenges such as fluctuating resin prices, environmental regulations, and the need for product innovation. Navigating these challenges while meeting the demands of various end-use industries is essential for the sustained growth of the rosin market.
Drivers of the market
The Brazil Rosin market has experienced growth, driven by its diverse applications in industries such as adhesives, coatings, and inks. The construction and manufacturing sectors have contributed to the demand for rosin as a key ingredient in various formulations. The market is influenced by the ongoing industrial activities and the need for high-performance materials, positioning rosin as a valuable component in many industrial processes.
Challenges of the market
The Brazil Rosin market, used in various industries such as adhesives and inks, faces challenges related to raw material availability and pricing volatility. Sustainable forestry practices and responsible sourcing are critical challenges in this market. Market players need to balance economic considerations with environmental responsibility to ensure long-term sustainability.
Government Policy of the market
In the Brazil Rosin market, government policies related to forestry management and resin extraction have a significant impact. Sustainable forestry practices, adherence to logging regulations, and conservation policies influence the sourcing of Rosin. Industry participants need to comply with these policies to ensure a responsible and sustainable supply chain.
Key Highlights of the Report:
- Brazil Rosin Market Outlook
- Market Size of Brazil Rosin Market, 2020
- Forecast of Brazil Rosin Market, 2027
- Historical Data and Forecast of Brazil Rosin Revenues & Volume for the Period 2018 - 2027
- Brazil Rosin Market Trend Evolution
- Brazil Rosin Market Drivers and Challenges
- Brazil Rosin Price Trends
- Brazil Rosin Porter's Five Forces
- Brazil Rosin Industry Life Cycle
- Historical Data and Forecast of Brazil Rosin Market Revenues & Volume By Rosin Type for the Period 2018 - 2027
- Historical Data and Forecast of Brazil Rosin Market Revenues & Volume By Gum for the Period 2018 - 2027
- Historical Data and Forecast of Brazil Rosin Market Revenues & Volume By Wood for the Period 2018 - 2027
- Historical Data and Forecast of Brazil Rosin Market Revenues & Volume By Tall Oil for the Period 2018 - 2027
- Historical Data and Forecast of Brazil Rosin Market Revenues & Volume By Application for the Period 2018 - 2027
- Historical Data and Forecast of Brazil Rosin Market Revenues & Volume By Adhesives for the Period 2018 - 2027
- Historical Data and Forecast of Brazil Rosin Market Revenues & Volume By Paints and Varnishes for the Period 2018 - 2027
- Historical Data and Forecast of Brazil Rosin Market Revenues & Volume By Rubbers for the Period 2018 - 2027
- Historical Data and Forecast of Brazil Rosin Market Revenues & Volume By Paper Sizing and Fillers for the Period 2018 - 2027
- Historical Data and Forecast of Brazil Rosin Market Revenues & Volume By Printing Inks for the Period 2018 - 2027
- Historical Data and Forecast of Brazil Rosin Market Revenues & Volume By Other Applications for the Period 2018 - 2027
- Brazil Rosin Import Export Trade Statistics
- Market Opportunity Assessment By Rosin Type
- Market Opportunity Assessment By Application
- Brazil Rosin Top Companies Market Share
- Brazil Rosin Competitive Benchmarking By Technical and Operational Parameters
- Brazil Rosin Company Profiles
- Brazil Rosin Key Strategic Recommendations
Frequently Asked Questions About the Market Study (FAQs):
6Wresearch actively monitors the Brazil Rosin Market and publishes its comprehensive annual report, highlighting emerging trends, growth drivers, revenue analysis, and forecast outlook. Our insights help businesses to make data-backed strategic decisions with ongoing market dynamics. Our analysts track relevent industries related to the Brazil Rosin Market, allowing our clients with actionable intelligence and reliable forecasts tailored to emerging regional needs.
Yes, we provide customisation as per your requirements. To learn more, feel free to contact us on sales@6wresearch.com
1 Executive Summary |
2 Introduction |
2.1 Key Highlights of the Report |
2.2 Report Description |
2.3 Market Scope & Segmentation |
2.4 Research Methodology |
2.5 Assumptions |
3 Brazil Rosin Market Overview |
3.1 Brazil Country Macro Economic Indicators |
3.2 Brazil Rosin Market Revenues & Volume, 2020 & 2027F |
3.3 Brazil Rosin Market - Industry Life Cycle |
3.4 Brazil Rosin Market - Porter's Five Forces |
3.5 Brazil Rosin Market Revenues & Volume Share, By Rosin Type, 2020 & 2027F |
3.6 Brazil Rosin Market Revenues & Volume Share, By Application, 2020 & 2027F |
4 Brazil Rosin Market Dynamics |
4.1 Impact Analysis |
4.2 Market Drivers |
4.2.1 Increasing demand for natural and sustainable products in various industries |
4.2.2 Growing applications of rosin in adhesives, coatings, rubber, and paper industries |
4.2.3 Favorable government regulations promoting the use of renewable and eco-friendly materials |
4.3 Market Restraints |
4.3.1 Fluctuations in raw material prices, such as pine resin, impacting the production cost of rosin |
4.3.2 Intense competition from synthetic substitutes in some end-use industries |
4.3.3 Challenges related to supply chain disruptions and logistics issues, affecting the distribution of rosin products |
5 Brazil Rosin Market Trends |
6 Brazil Rosin Market, By Types |
6.1 Brazil Rosin Market, By Rosin Type |
6.1.1 Overview and Analysis |
6.1.2 Brazil Rosin Market Revenues & Volume, By Rosin Type, 2018 - 2027F |
6.1.3 Brazil Rosin Market Revenues & Volume, By Gum, 2018 - 2027F |
6.1.4 Brazil Rosin Market Revenues & Volume, By Wood, 2018 - 2027F |
6.1.5 Brazil Rosin Market Revenues & Volume, By Tall Oil, 2018 - 2027F |
6.2 Brazil Rosin Market, By Application |
6.2.1 Overview and Analysis |
6.2.2 Brazil Rosin Market Revenues & Volume, By Adhesives, 2018 - 2027F |
6.2.3 Brazil Rosin Market Revenues & Volume, By Paints and Varnishes, 2018 - 2027F |
6.2.4 Brazil Rosin Market Revenues & Volume, By Rubbers, 2018 - 2027F |
6.2.5 Brazil Rosin Market Revenues & Volume, By Paper Sizing and Fillers, 2018 - 2027F |
6.2.6 Brazil Rosin Market Revenues & Volume, By Printing Inks, 2018 - 2027F |
6.2.7 Brazil Rosin Market Revenues & Volume, By Other Applications, 2018 - 2027F |
7 Brazil Rosin Market Import-Export Trade Statistics |
7.1 Brazil Rosin Market Export to Major Countries |
7.2 Brazil Rosin Market Imports from Major Countries |
8 Brazil Rosin Market Key Performance Indicators |
8.1 Sustainability metrics, such as percentage of rosin sourced from certified sustainable forestry practices |
8.2 Research and development investment in innovative rosin-based products and applications |
8.3 Percentage of market penetration in emerging industries utilizing rosin as a key ingredient |
9 Brazil Rosin Market - Opportunity Assessment |
9.1 Brazil Rosin Market Opportunity Assessment, By Rosin Type, 2020 & 2027F |
9.2 Brazil Rosin Market Opportunity Assessment, By Application, 2020 & 2027F |
10 Brazil Rosin Market - Competitive Landscape |
10.1 Brazil Rosin Market Revenue Share, By Companies, 2020 |
10.2 Brazil Rosin Market Competitive Benchmarking, By Operating and Technical Parameters |
11 Company Profiles |
12 Recommendations |
13 Disclaimer |
Export potential assessment - trade Analytics for 2030
Export potential enables firms to identify high-growth global markets with greater confidence by combining advanced trade intelligence with a structured quantitative methodology. The framework analyzes emerging demand trends and country-level import patterns while integrating macroeconomic and trade datasets such as GDP and population forecasts, bilateral import–export flows, tariff structures, elasticity differentials between developed and developing economies, geographic distance, and import demand projections. Using weighted trade values from 2020–2024 as the base period to project country-to-country export potential for 2030, these inputs are operationalized through calculated drivers such as gravity model parameters, tariff impact factors, and projected GDP per-capita growth. Through an analysis of hidden potentials, demand hotspots, and market conditions that are most favorable to success, this method enables firms to focus on target countries, maximize returns, and global expansion with data, backed by accuracy.
By factoring in the projected importer demand gap that is currently unmet and could be potential opportunity, it identifies the potential for the Exporter (Country) among 190 countries, against the general trade analysis, which identifies the biggest importer or exporter.
To discover high-growth global markets and optimize your business strategy:
Click Here
Pricing
- Single User License$ 1,995
- Department License$ 2,400
- Site License$ 3,120
- Global License$ 3,795

Search
Thought Leadership and Analyst Meet


Our Clients
Related Reports
- United Kingdom (UK) Long-term Care Insurance Market (2026-2032) | Growth, Share, Consumer Insights, Drivers, Opportunities, Competition, Pricing Analysis, Segments, Restraints, Companies, Competitive, Value, Outlook, Size, Demand, Analysis, Challenges, Strategic Insights, Investment Trends, Revenue, Trends, Supply, Forecast
- United Kingdom (UK) Long Term Care Market (2026-2032) | Companies, Outlook, Analysis, Trends, Value, Revenue, Segmentation, Share, Forecast, Competitive Landscape, Growth, Size & Forecast
- Iraq Insulation and Waterproofing Market (2026-2032) | Outlook, Drivers, Growth, Size, Share, Industry, Revenue, Trends, Demand, Competitive, Strategic Insights, Opportunities, Segments, Companies, Challenges, Strategy, Consumer Insights, Analysis, Investment Trends, Value, Segmentation, Forecast, Restraints
- India Switchgear Market Outlook (2026 - 2032) | Size, Share, Trends, Growth, Revenue, Forecast, Analysis, Value, Outlook
- Pakistan Contraceptive Implants Market (2025-2031) | Demand, Growth, Size, Share, Industry, Pricing Analysis, Competitive, Strategic Insights, Strategy, Consumer Insights, Analysis, Investment Trends, Opportunities, Revenue, Segments, Value, Segmentation, Supply, Forecast, Restraints, Outlook, Competition, Drivers, Trends, Companies, Challenges
- Sri Lanka Packaging Market (2026-2032) | Outlook, Competition, Drivers, Trends, Demand, Pricing Analysis, Competitive, Strategic Insights, Companies, Challenges, Strategy, Consumer Insights, Analysis, Investment Trends, Opportunities, Growth, Size, Share, Industry, Revenue, Segments, Value, Segmentation, Supply, Forecast, Restraints
- India Kids Watches Market (2026-2032) | Strategy, Consumer Insights, Analysis, Investment Trends, Opportunities, Growth, Size, Share, Industry, Revenue, Segments, Value, Segmentation, Supply, Forecast, Restraints, Outlook, Competition, Drivers, Trends, Demand, Pricing Analysis, Competitive, Strategic Insights, Companies, Challenges
- Saudi Arabia Core Assurance Service Market (2025-2031) | Strategy, Consumer Insights, Analysis, Investment Trends, Opportunities, Growth, Size, Share, Industry, Revenue, Segments, Value, Segmentation, Supply, Forecast, Restraints, Outlook, Competition, Drivers, Trends, Demand, Pricing Analysis, Competitive, Strategic Insights, Companies, Challenges
- Romania Uninterruptible Power Supply (UPS) Market (2026-2032) | Industry, Analysis, Revenue, Size, Forecast, Outlook, Value, Trends, Share, Growth & Companies
- Saudi Arabia Car Window Tinting Film, Paint Protection Film (PPF), and Ceramic Coating Market (2025-2031) | Strategy, Consumer Insights, Analysis, Investment Trends, Opportunities, Growth, Size, Share, Industry, Revenue, Segments, Value, Segmentation, Supply, Forecast, Restraints, Outlook, Competition, Drivers, Trends, Demand, Pricing Analysis, Competitive, Strategic Insights, Companies, Challenges
Industry Events and Analyst Meet

India EV Show 2026

EV tech India Expo 2026

Auto Tech Asia 2026

Battery Tech India 2026

Smart Production Solutions Guangzhou 2026
Whitepaper
- Middle East & Africa Commercial Security Market Click here to view more.
- Middle East & Africa Fire Safety Systems & Equipment Market Click here to view more.
- GCC Drone Market Click here to view more.
- Middle East Lighting Fixture Market Click here to view more.
- GCC Physical & Perimeter Security Market Click here to view more.
6WResearch In News
- Doha a strategic location for EV manufacturing hub: IPA Qatar
- Demand for luxury TVs surging in the GCC, says Samsung
- Empowering Growth: The Thriving Journey of Bangladesh’s Cable Industry
- Demand for luxury TVs surging in the GCC, says Samsung
- Video call with a traditional healer? Once unthinkable, it’s now common in South Africa
- Intelligent Buildings To Smooth GCC’s Path To Net Zero