Cape Verde Canned Vegetables Market (2025-2031) | Revenue, Analysis, Forecast, Industry, Companies, Size, Segmentation, Value, Growth, Trends, Outlook & Share
Market Forecast By Type (Tomatoes, Carrot, Peas, Corn, Spinach, Vegetable Blend, Others), By Category (Organic, Conventional), By Distribution Channel (Store-Based, Non-Store-Based) And Competitive Landscape
| Product Code: ETC4836428 | Publication Date: Nov 2023 | Updated Date: Nov 2025 | Product Type: Market Research Report | |
| Publisher: 6Wresearch | Author: Sachin Kumar Rai | No. of Pages: 60 | No. of Figures: 30 | No. of Tables: 5 |
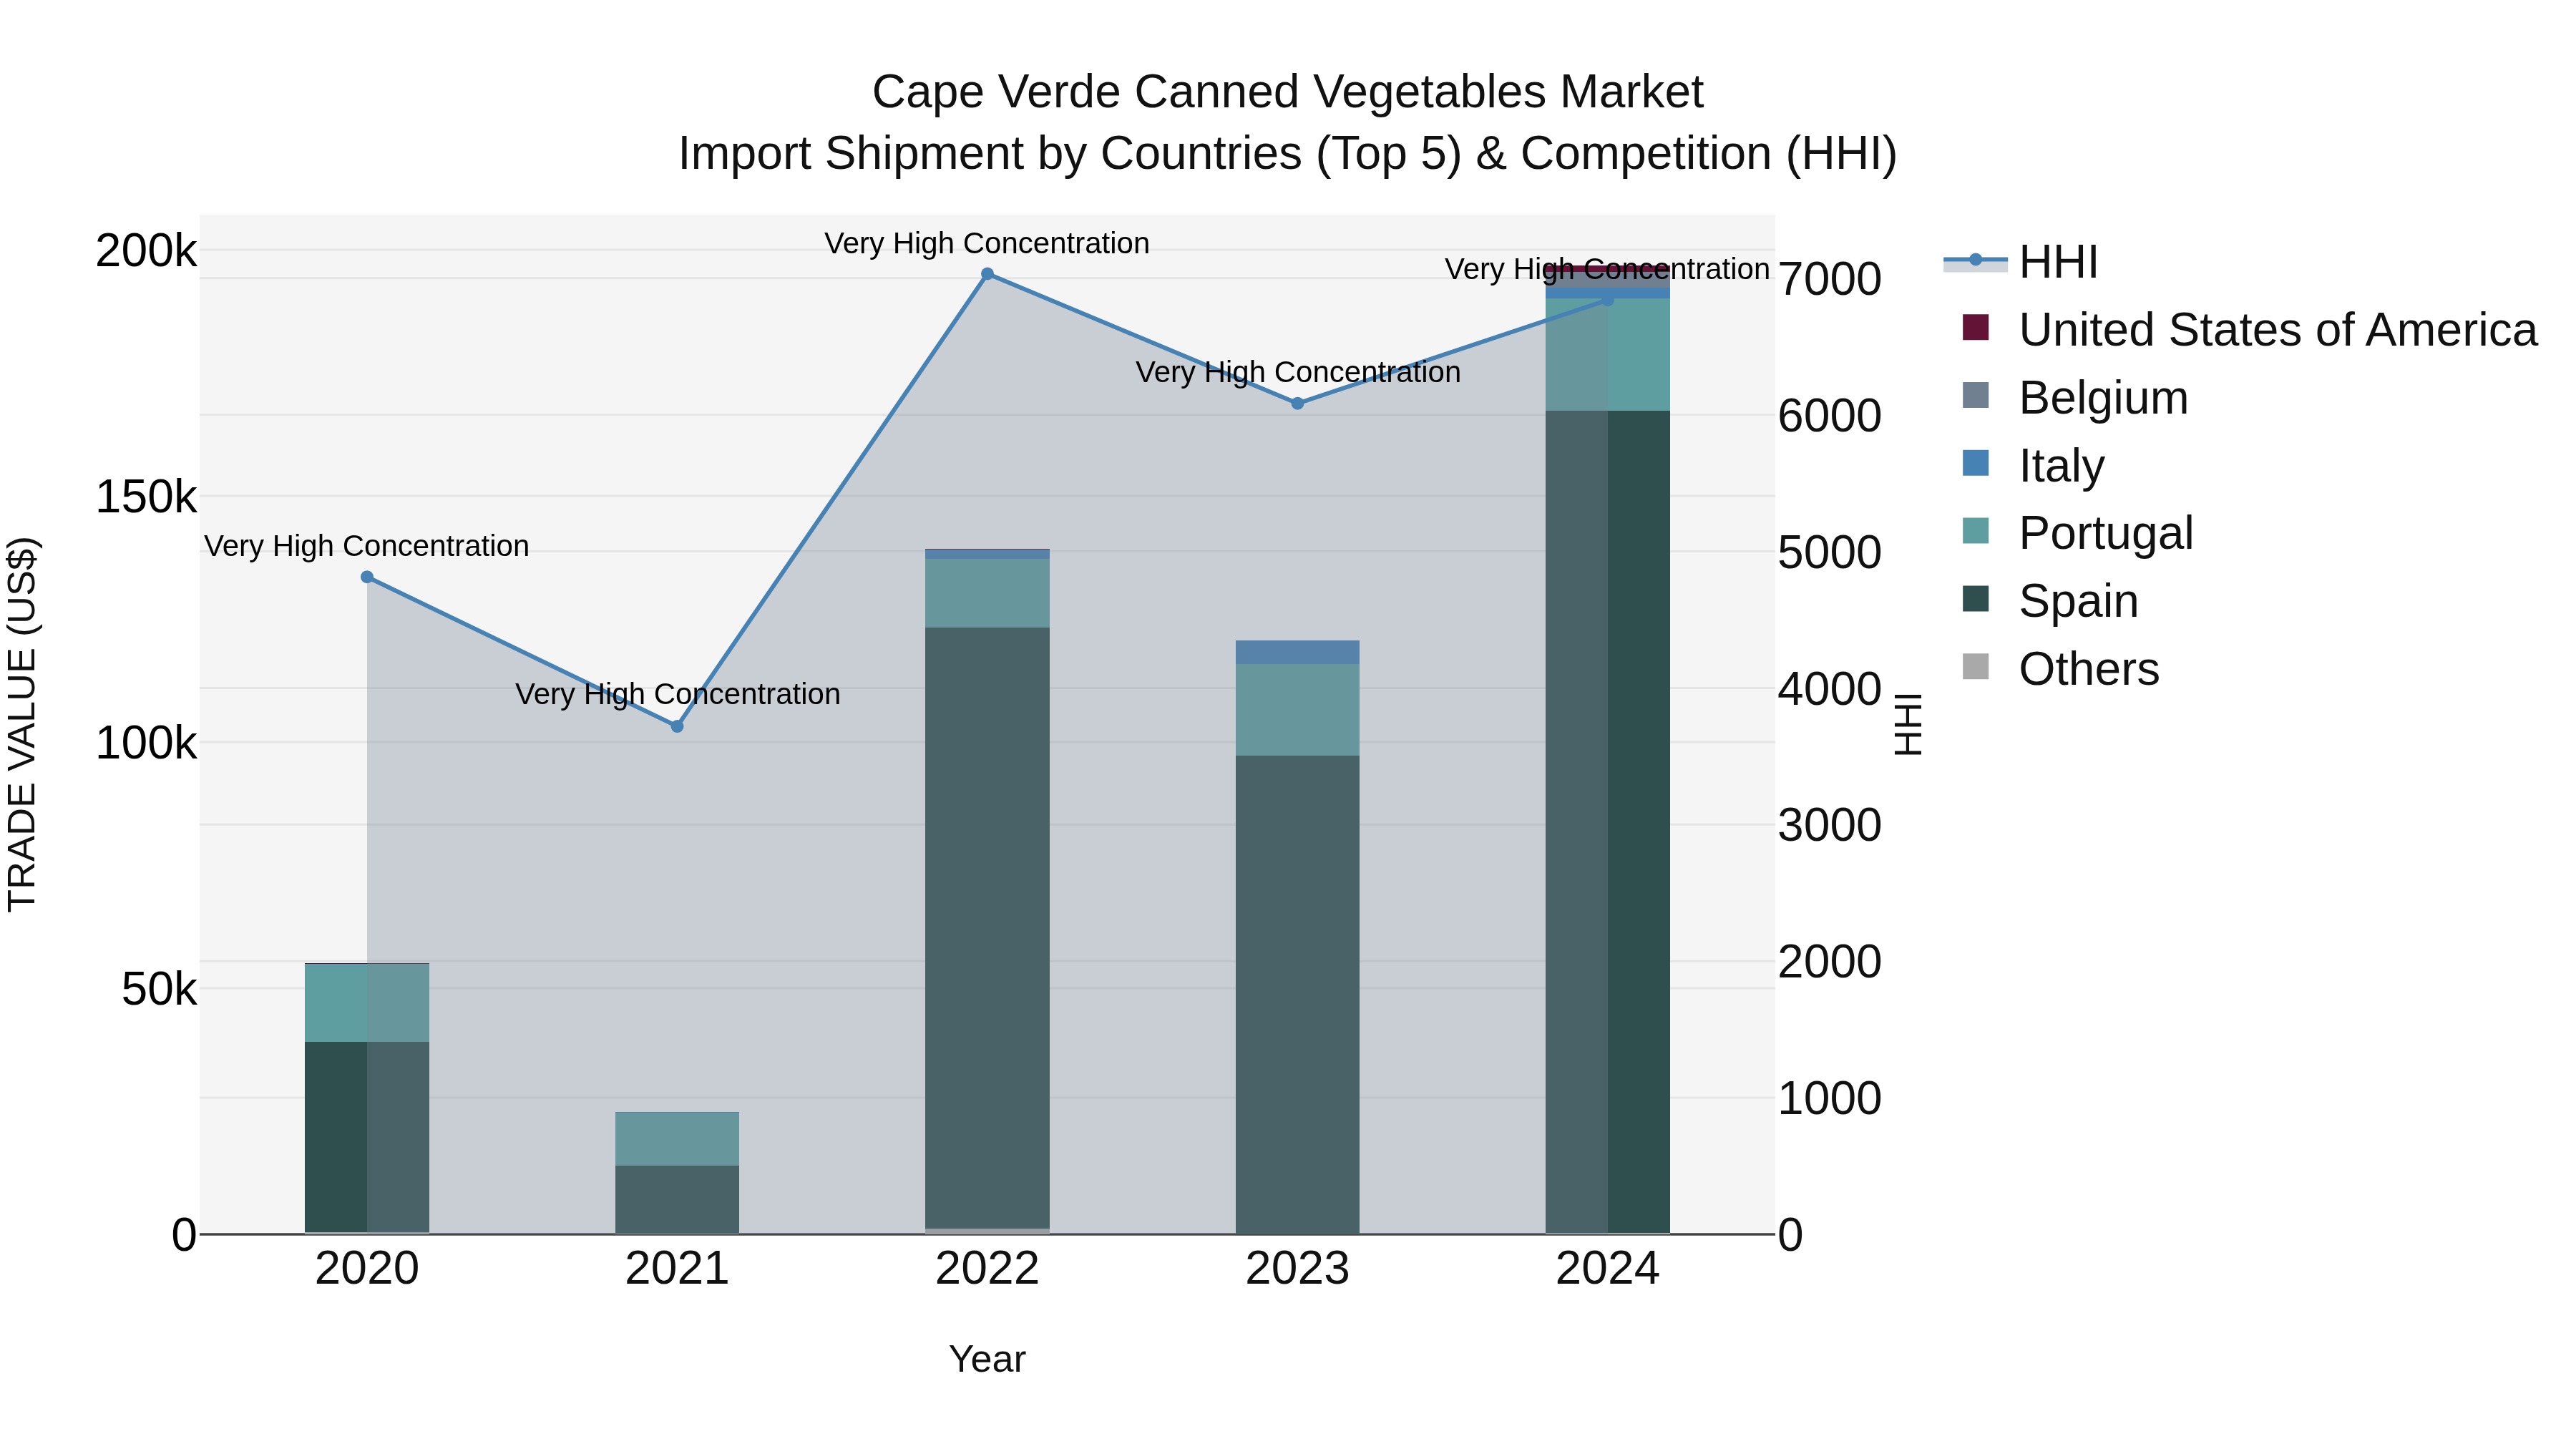
Cape Verde Canned Vegetables Market: Top 5 Importing Countries and Market Competition (HHI) Analysis
Cape Verde continues to rely on imported canned vegetables, with top suppliers in 2024 being Spain, Portugal, Belgium, Italy, and the United States. The market shows high concentration with a consistently high Herfindahl-Hirschman Index (HHI). The impressive compound annual growth rate (CAGR) of 37.51% from 2020 to 2024 indicates a thriving market. Furthermore, the remarkable growth rate of 63.09% from 2023 to 2024 suggests a rapid expansion in demand for canned vegetables in Cape Verde. This data highlights the opportunities for stakeholders in the canned vegetables import industry targeting the Cape Verde market.
Cape Verde Canned Vegetables Market Overview
The canned vegetables market in Cape Verde is driven by the need for convenient and long-lasting food options. Canned vegetables are popular for their extended shelf life and ease of use. The local market relies heavily on imports due to the limited domestic production. The growth of the retail sector and changing consumer preferences towards convenience foods contribute to the demand for canned vegetables. Import costs and global market trends impact the local market dynamics.
Drivers of the market
The Cape Verde canned vegetables market is influenced by the demand for convenient and long-lasting food products. The growing preference for ready-to-eat and easy-to-store vegetables boosts the demand for canned options. Additionally, advancements in canning technology and the expansion of retail distribution networks contribute to market growth. The increasing focus on healthy eating and convenience drives the markets development.
Challenges of the market
Challenges in the Cape Verde Canned Vegetables market include the high cost of importing vegetables and canning materials. Limited local production and processing facilities contribute to the market`s dependence on imports, affecting pricing and supply. Additionally, the market faces competition from both local and international brands and logistical issues related to transportation and distribution.
Government Policy of the market
Cape Verde`s policies on the canned vegetables market aim to ensure the safety and quality of processed vegetable products. The government enforces standards for the processing, packaging, and labeling of canned vegetables to prevent contamination and maintain product quality. Regulations cover import tariffs and quality control measures. Local producers are encouraged to adopt modern processing technologies and best practices to improve the safety and quality of canned vegetables.
Key Highlights of the Report:
- Cape Verde Canned Vegetables Market Outlook
- Market Size of Cape Verde Canned Vegetables Market, 2024
- Forecast of Cape Verde Canned Vegetables Market, 2031
- Historical Data and Forecast of Cape Verde Canned Vegetables Revenues & Volume for the Period 2021-2031
- Cape Verde Canned Vegetables Market Trend Evolution
- Cape Verde Canned Vegetables Market Drivers and Challenges
- Cape Verde Canned Vegetables Price Trends
- Cape Verde Canned Vegetables Porter`s Five Forces
- Cape Verde Canned Vegetables Industry Life Cycle
- Historical Data and Forecast of Cape Verde Canned Vegetables Market Revenues & Volume By Type for the Period 2021-2031
- Historical Data and Forecast of Cape Verde Canned Vegetables Market Revenues & Volume By Tomatoes for the Period 2021-2031
- Historical Data and Forecast of Cape Verde Canned Vegetables Market Revenues & Volume By Carrot for the Period 2021-2031
- Historical Data and Forecast of Cape Verde Canned Vegetables Market Revenues & Volume By Peas for the Period 2021-2031
- Historical Data and Forecast of Cape Verde Canned Vegetables Market Revenues & Volume By Corn for the Period 2021-2031
- Historical Data and Forecast of Cape Verde Canned Vegetables Market Revenues & Volume By Spinach for the Period 2021-2031
- Historical Data and Forecast of Cape Verde Canned Vegetables Market Revenues & Volume By Vegetable Blend for the Period 2021-2031
- Historical Data and Forecast of Cape Verde Canned Vegetables Market Revenues & Volume By Others for the Period 2021-2031
- Historical Data and Forecast of Cape Verde Canned Vegetables Market Revenues & Volume By Category for the Period 2021-2031
- Historical Data and Forecast of Cape Verde Canned Vegetables Market Revenues & Volume By Organic for the Period 2021-2031
- Historical Data and Forecast of Cape Verde Canned Vegetables Market Revenues & Volume By Conventional for the Period 2021-2031
- Historical Data and Forecast of Cape Verde Canned Vegetables Market Revenues & Volume By Distribution Channel for the Period 2021-2031
- Historical Data and Forecast of Cape Verde Canned Vegetables Market Revenues & Volume By Store-Based for the Period 2021-2031
- Historical Data and Forecast of Cape Verde Canned Vegetables Market Revenues & Volume By Non-Store-Based for the Period 2021-2031
- Cape Verde Canned Vegetables Import Export Trade Statistics
- Market Opportunity Assessment By Type
- Market Opportunity Assessment By Category
- Market Opportunity Assessment By Distribution Channel
- Cape Verde Canned Vegetables Top Companies Market Share
- Cape Verde Canned Vegetables Competitive Benchmarking By Technical and Operational Parameters
- Cape Verde Canned Vegetables Company Profiles
- Cape Verde Canned Vegetables Key Strategic Recommendations
Frequently Asked Questions About the Market Study (FAQs):
6Wresearch actively monitors the Cape Verde Canned Vegetables Market and publishes its comprehensive annual report, highlighting emerging trends, growth drivers, revenue analysis, and forecast outlook. Our insights help businesses to make data-backed strategic decisions with ongoing market dynamics. Our analysts track relevent industries related to the Cape Verde Canned Vegetables Market, allowing our clients with actionable intelligence and reliable forecasts tailored to emerging regional needs.
Yes, we provide customisation as per your requirements. To learn more, feel free to contact us on sales@6wresearch.com
1 Executive Summary |
2 Introduction |
2.1 Key Highlights of the Report |
2.2 Report Description |
2.3 Market Scope & Segmentation |
2.4 Research Methodology |
2.5 Assumptions | 3 Cape Verde Canned Vegetables Market Overview |
3.1 Cape Verde Country Macro Economic Indicators | 3.2 Cape Verde Canned Vegetables Market Revenues & Volume, 2021 & 2031F | 3.3 Cape Verde Canned Vegetables Market - Industry Life Cycle | 3.4 Cape Verde Canned Vegetables Market - Porter's Five Forces | 3.5 Cape Verde Canned Vegetables Market Revenues & Volume Share, By Type, 2021 & 2031F | 3.6 Cape Verde Canned Vegetables Market Revenues & Volume Share, By Category, 2021 & 2031F | 3.7 Cape Verde Canned Vegetables Market Revenues & Volume Share, By Distribution Channel, 2021 & 2031F | 4 Cape Verde Canned Vegetables Market Dynamics |
4.1 Impact Analysis |
4.2 Market Drivers |
4.3 Market Restraints | 5 Cape Verde Canned Vegetables Market Trends | 6 Cape Verde Canned Vegetables Market, By Types | 6.1 Cape Verde Canned Vegetables Market, By Type |
6.1.1 Overview and Analysis | 6.1.2 Cape Verde Canned Vegetables Market Revenues & Volume, By Type, 2021-2031F | 6.1.3 Cape Verde Canned Vegetables Market Revenues & Volume, By Tomatoes, 2021-2031F | 6.1.4 Cape Verde Canned Vegetables Market Revenues & Volume, By Carrot, 2021-2031F | 6.1.5 Cape Verde Canned Vegetables Market Revenues & Volume, By Peas, 2021-2031F | 6.1.6 Cape Verde Canned Vegetables Market Revenues & Volume, By Corn, 2021-2031F | 6.1.7 Cape Verde Canned Vegetables Market Revenues & Volume, By Spinach, 2021-2031F | 6.1.8 Cape Verde Canned Vegetables Market Revenues & Volume, By Vegetable Blend, 2021-2031F | 6.2 Cape Verde Canned Vegetables Market, By Category |
6.2.1 Overview and Analysis | 6.2.2 Cape Verde Canned Vegetables Market Revenues & Volume, By Organic, 2021-2031F | 6.2.3 Cape Verde Canned Vegetables Market Revenues & Volume, By Conventional, 2021-2031F | 6.3 Cape Verde Canned Vegetables Market, By Distribution Channel |
6.3.1 Overview and Analysis | 6.3.2 Cape Verde Canned Vegetables Market Revenues & Volume, By Store-Based, 2021-2031F | 6.3.3 Cape Verde Canned Vegetables Market Revenues & Volume, By Non-Store-Based, 2021-2031F | 7 Cape Verde Canned Vegetables Market Import-Export Trade Statistics | 7.1 Cape Verde Canned Vegetables Market Export to Major Countries | 7.2 Cape Verde Canned Vegetables Market Imports from Major Countries | 8 Cape Verde Canned Vegetables Market Key Performance Indicators | 9 Cape Verde Canned Vegetables Market - Opportunity Assessment | 9.1 Cape Verde Canned Vegetables Market Opportunity Assessment, By Type, 2021 & 2031F | 9.2 Cape Verde Canned Vegetables Market Opportunity Assessment, By Category, 2021 & 2031F | 9.3 Cape Verde Canned Vegetables Market Opportunity Assessment, By Distribution Channel, 2021 & 2031F | 10 Cape Verde Canned Vegetables Market - Competitive Landscape | 10.1 Cape Verde Canned Vegetables Market Revenue Share, By Companies, 2024 | 10.2 Cape Verde Canned Vegetables Market Competitive Benchmarking, By Operating and Technical Parameters |
11 Company Profiles |
12 Recommendations | 13 Disclaimer |
Export potential assessment - trade Analytics for 2030
Export potential enables firms to identify high-growth global markets with greater confidence by combining advanced trade intelligence with a structured quantitative methodology. The framework analyzes emerging demand trends and country-level import patterns while integrating macroeconomic and trade datasets such as GDP and population forecasts, bilateral import–export flows, tariff structures, elasticity differentials between developed and developing economies, geographic distance, and import demand projections. Using weighted trade values from 2020–2024 as the base period to project country-to-country export potential for 2030, these inputs are operationalized through calculated drivers such as gravity model parameters, tariff impact factors, and projected GDP per-capita growth. Through an analysis of hidden potentials, demand hotspots, and market conditions that are most favorable to success, this method enables firms to focus on target countries, maximize returns, and global expansion with data, backed by accuracy.
By factoring in the projected importer demand gap that is currently unmet and could be potential opportunity, it identifies the potential for the Exporter (Country) among 190 countries, against the general trade analysis, which identifies the biggest importer or exporter.
To discover high-growth global markets and optimize your business strategy:
Click Here
Pricing
- Single User License$ 1,995
- Department License$ 2,400
- Site License$ 3,120
- Global License$ 3,795

Search
Thought Leadership and Analyst Meet


Our Clients
Related Reports
- India Switchgear Market Outlook (2026 - 2032) | Size, Share, Trends, Growth, Revenue, Forecast, Analysis, Value, Outlook
- Pakistan Contraceptive Implants Market (2025-2031) | Demand, Growth, Size, Share, Industry, Pricing Analysis, Competitive, Strategic Insights, Strategy, Consumer Insights, Analysis, Investment Trends, Opportunities, Revenue, Segments, Value, Segmentation, Supply, Forecast, Restraints, Outlook, Competition, Drivers, Trends, Companies, Challenges
- Sri Lanka Packaging Market (2026-2032) | Outlook, Competition, Drivers, Trends, Demand, Pricing Analysis, Competitive, Strategic Insights, Companies, Challenges, Strategy, Consumer Insights, Analysis, Investment Trends, Opportunities, Growth, Size, Share, Industry, Revenue, Segments, Value, Segmentation, Supply, Forecast, Restraints
- India Kids Watches Market (2026-2032) | Strategy, Consumer Insights, Analysis, Investment Trends, Opportunities, Growth, Size, Share, Industry, Revenue, Segments, Value, Segmentation, Supply, Forecast, Restraints, Outlook, Competition, Drivers, Trends, Demand, Pricing Analysis, Competitive, Strategic Insights, Companies, Challenges
- Saudi Arabia Core Assurance Service Market (2025-2031) | Strategy, Consumer Insights, Analysis, Investment Trends, Opportunities, Growth, Size, Share, Industry, Revenue, Segments, Value, Segmentation, Supply, Forecast, Restraints, Outlook, Competition, Drivers, Trends, Demand, Pricing Analysis, Competitive, Strategic Insights, Companies, Challenges
- Romania Uninterruptible Power Supply (UPS) Market (2026-2032) | Industry, Analysis, Revenue, Size, Forecast, Outlook, Value, Trends, Share, Growth & Companies
- Saudi Arabia Car Window Tinting Film, Paint Protection Film (PPF), and Ceramic Coating Market (2025-2031) | Strategy, Consumer Insights, Analysis, Investment Trends, Opportunities, Growth, Size, Share, Industry, Revenue, Segments, Value, Segmentation, Supply, Forecast, Restraints, Outlook, Competition, Drivers, Trends, Demand, Pricing Analysis, Competitive, Strategic Insights, Companies, Challenges
- South Africa Stationery Market (2025-2031) | Share, Size, Industry, Value, Growth, Revenue, Analysis, Trends, Segmentation & Outlook
- Afghanistan Rocking Chairs And Adirondack Chairs Market (2026-2032) | Size & Revenue, Competitive Landscape, Share, Segmentation, Industry, Value, Outlook, Analysis, Trends, Growth, Forecast, Companies
- Afghanistan Apparel Market (2026-2032) | Growth, Outlook, Industry, Segmentation, Forecast, Size, Companies, Trends, Value, Share, Analysis & Revenue
Industry Events and Analyst Meet

EV tech India Expo 2026

Auto Tech Asia 2026

Battery Tech India 2026

Smart Production Solutions Guangzhou 2026

Stationery & Paper Expo Saudi Arabia 2026
Whitepaper
- Middle East & Africa Commercial Security Market Click here to view more.
- Middle East & Africa Fire Safety Systems & Equipment Market Click here to view more.
- GCC Drone Market Click here to view more.
- Middle East Lighting Fixture Market Click here to view more.
- GCC Physical & Perimeter Security Market Click here to view more.
6WResearch In News
- Doha a strategic location for EV manufacturing hub: IPA Qatar
- Demand for luxury TVs surging in the GCC, says Samsung
- Empowering Growth: The Thriving Journey of Bangladesh’s Cable Industry
- Demand for luxury TVs surging in the GCC, says Samsung
- Video call with a traditional healer? Once unthinkable, it’s now common in South Africa
- Intelligent Buildings To Smooth GCC’s Path To Net Zero