Cape Verde Compound Feed Market (2025-2031) | Industry, Trends, Value, Growth, Segmentation, Forecast, Share, Outlook, Revenue, Companies, Size & Analysis
Market Forecast By Ingredients (Cereals, Cakes & Meals), By Source (Plant-based, Animal-based), By Form (Mash, Pellet, Crumble, Other Forms), By Livestock (Poultry, Ruminants, Swine, Aquaculture, Other Livestock) And Competitive Landscape
| Product Code: ETC5012387 | Publication Date: Nov 2023 | Updated Date: Nov 2025 | Product Type: Market Research Report | |
| Publisher: 6Wresearch | Author: Sachin Kumar Rai | No. of Pages: 60 | No. of Figures: 30 | No. of Tables: 5 |
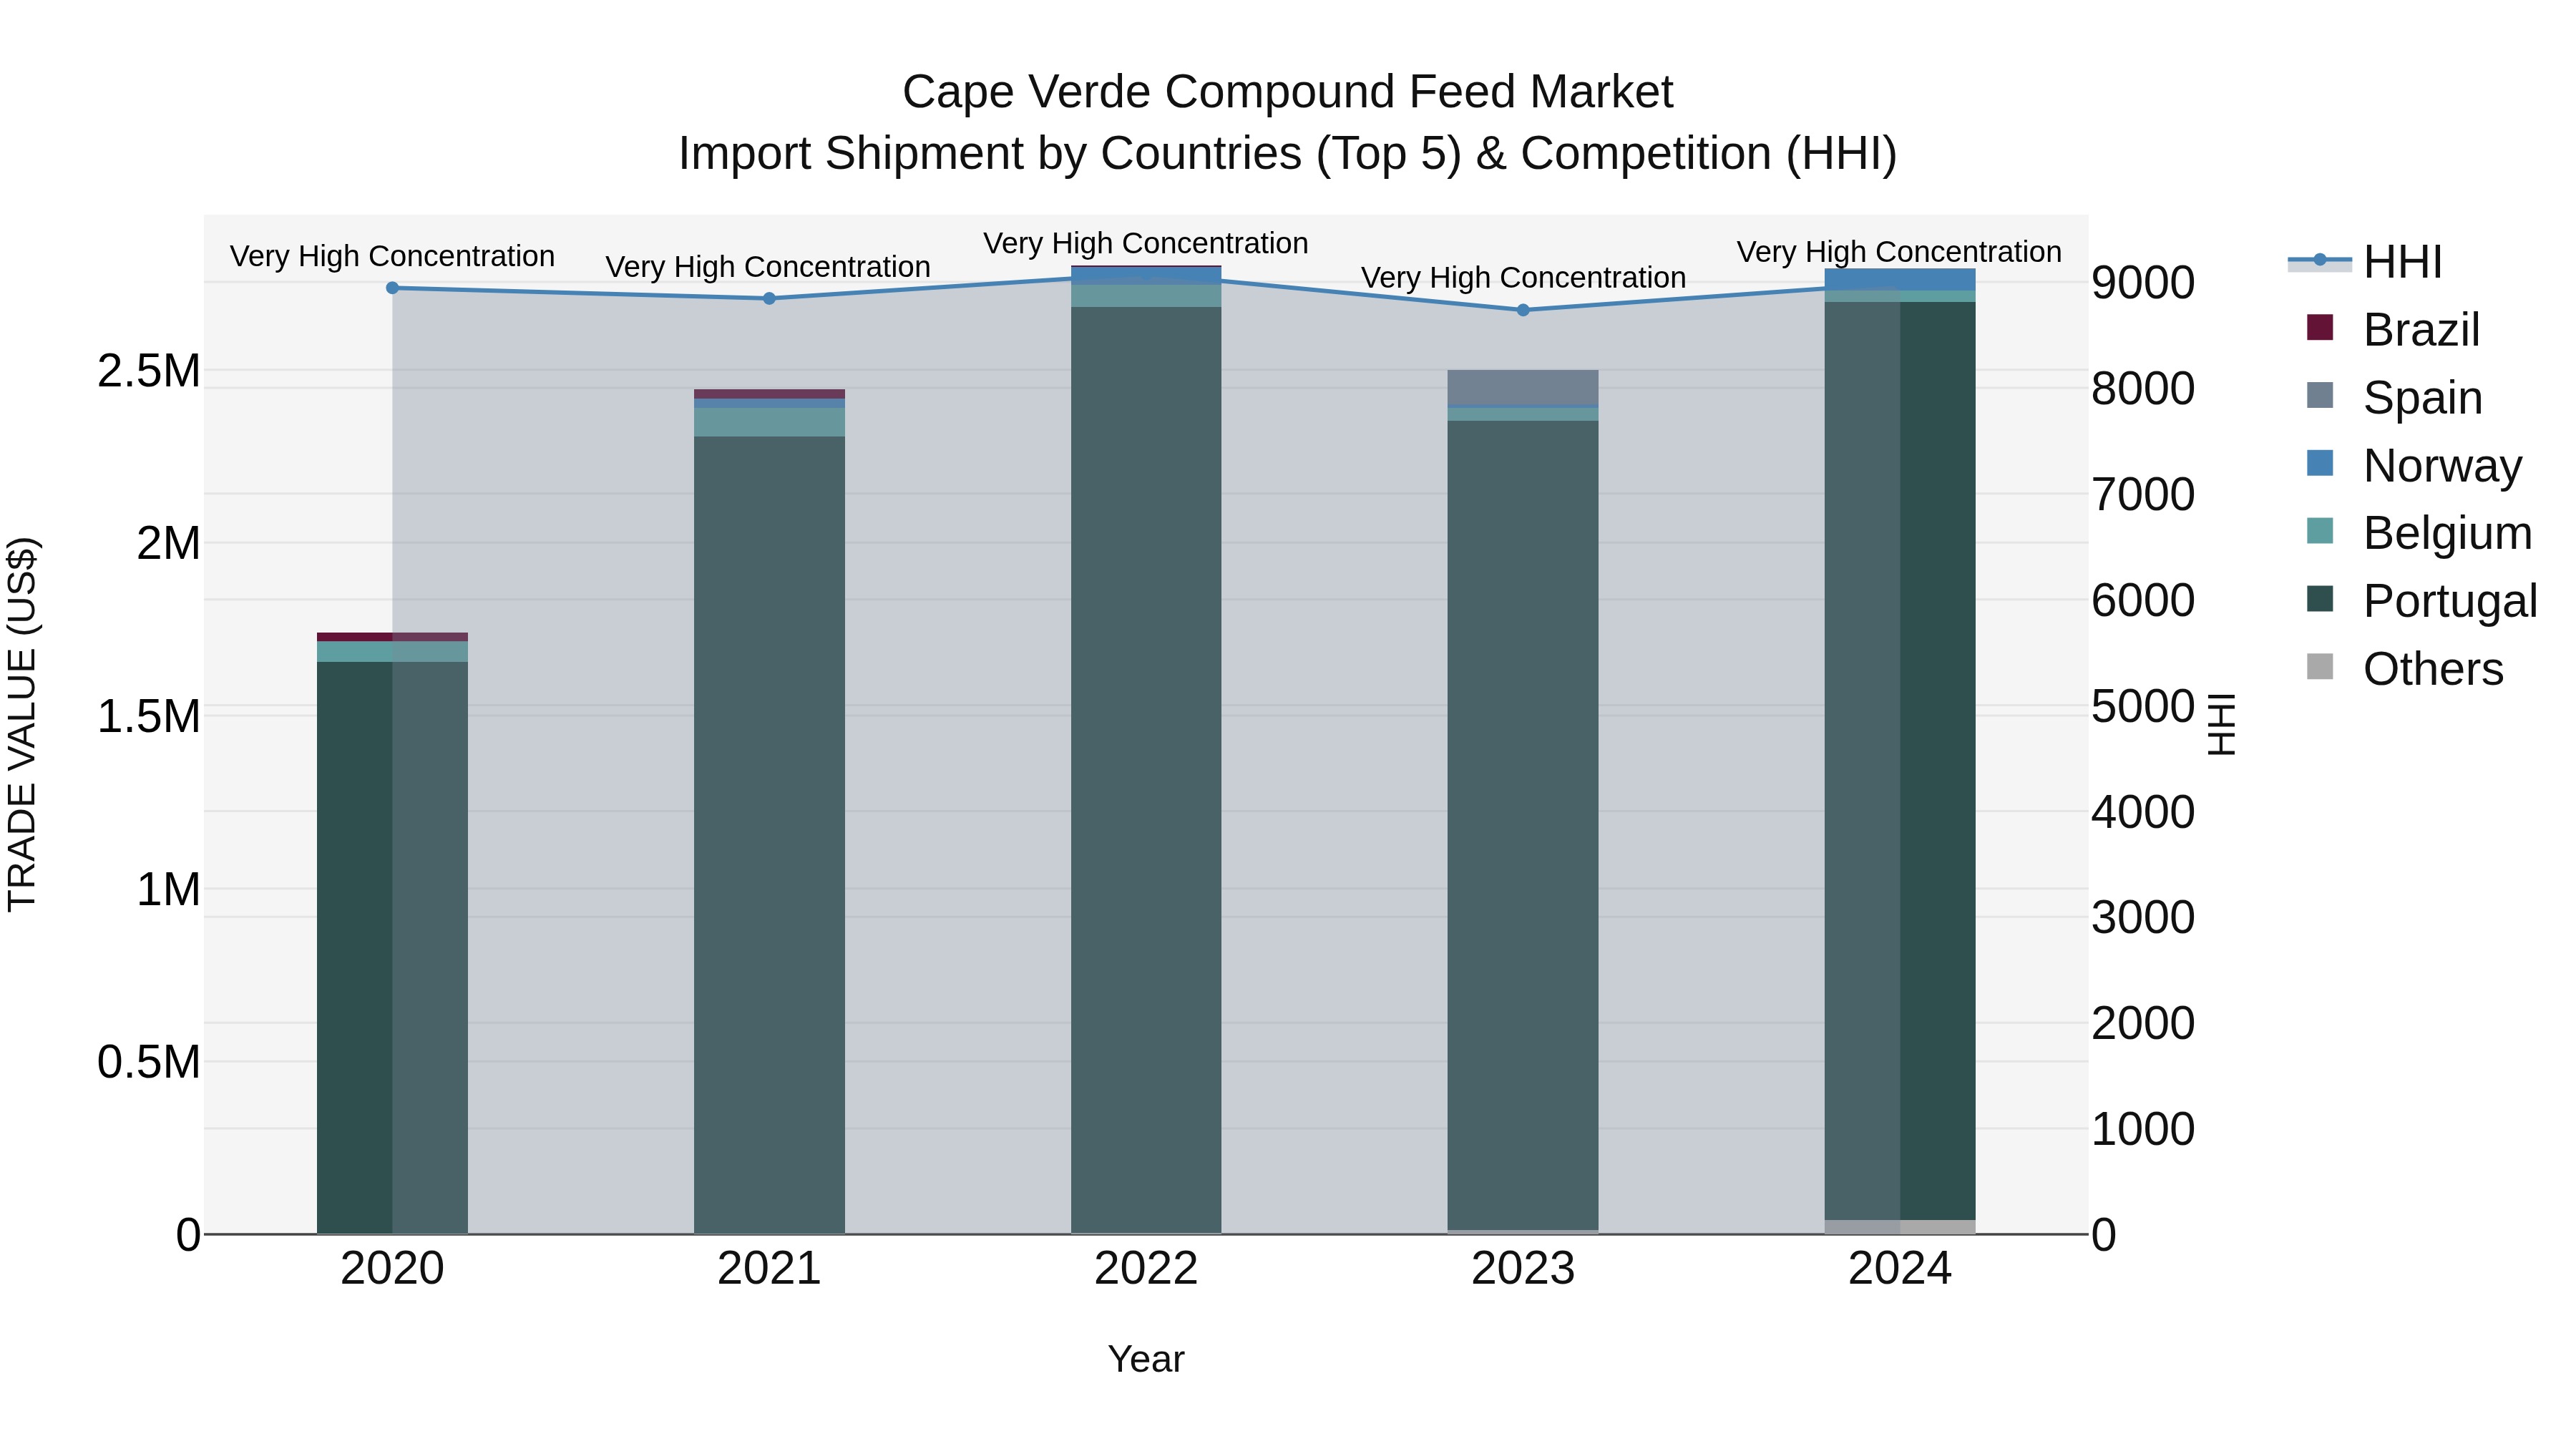
Cape Verde Compound Feed Market: Top 5 Importing Countries and Market Competition (HHI) Analysis
Cape Verde`s compound feed import market in 2024 continued to be dominated by key suppliers such as Portugal, Norway, Belgium, Japan, and France. The high Herfindahl-Hirschman Index (HHI) indicates a concentrated market structure. With a remarkable compound annual growth rate (CAGR) of 12.55% from 2020 to 2024 and a growth rate of 11.76% in 2024 alone, the country`s demand for compound feed imports shows a strong and sustained upward trajectory, reflecting a promising market for international suppliers.
Cape Verde Compound Feed Market Overview
The compound feed market in Cape Verde is expanding due to the increasing demand for high-quality animal nutrition products. The market is driven by the growth of the livestock industry and the need for nutritionally balanced feed that supports optimal animal health and productivity. The development of innovative feed formulations and the adoption of modern farming practices are also contributing to market growth.
Drivers of the market
The Cape Verde Compound Feed Market is driven by the rising demand for high-quality feed to improve livestock productivity and health. Increasing awareness among farmers about the benefits of compound feed in enhancing growth rates and reducing disease incidence in animals is contributing to market growth.
Challenges of the market
The Cape Verde compound feed market faces challenges related to supply chain issues and the cost of raw materials. The availability and quality of ingredients can fluctuate, affecting the consistency and cost of compound feed products. Additionally, there are concerns about the regulatory environment and the need for compliance with local and international standards. Market growth is also limited by competition from alternative feed solutions and changing consumer preferences.
Government Policy of the market
In the compound feed market, Cape Verde`s government focuses on ensuring the quality and safety of animal feeds. Policies include regulations to control the production and distribution of compound feeds, with an emphasis on nutritional value and safety standards. The government provides support for local feed manufacturers and promotes research into more efficient and sustainable feed formulations.
Key Highlights of the Report:
- Cape Verde Compound Feed Market Outlook
- Market Size of Cape Verde Compound Feed Market, 2024
- Forecast of Cape Verde Compound Feed Market, 2031
- Historical Data and Forecast of Cape Verde Compound Feed Revenues & Volume for the Period 2021-2031
- Cape Verde Compound Feed Market Trend Evolution
- Cape Verde Compound Feed Market Drivers and Challenges
- Cape Verde Compound Feed Price Trends
- Cape Verde Compound Feed Porter`s Five Forces
- Cape Verde Compound Feed Industry Life Cycle
- Historical Data and Forecast of Cape Verde Compound Feed Market Revenues & Volume By Ingredients for the Period 2021-2031
- Historical Data and Forecast of Cape Verde Compound Feed Market Revenues & Volume By Cereals for the Period 2021-2031
- Historical Data and Forecast of Cape Verde Compound Feed Market Revenues & Volume By Cakes & Meals for the Period 2021-2031
- Historical Data and Forecast of Cape Verde Compound Feed Market Revenues & Volume By Source for the Period 2021-2031
- Historical Data and Forecast of Cape Verde Compound Feed Market Revenues & Volume By Plant-based for the Period 2021-2031
- Historical Data and Forecast of Cape Verde Compound Feed Market Revenues & Volume By Animal-based for the Period 2021-2031
- Historical Data and Forecast of Cape Verde Compound Feed Market Revenues & Volume By Form for the Period 2021-2031
- Historical Data and Forecast of Cape Verde Compound Feed Market Revenues & Volume By Mash for the Period 2021-2031
- Historical Data and Forecast of Cape Verde Compound Feed Market Revenues & Volume By Pellet for the Period 2021-2031
- Historical Data and Forecast of Cape Verde Compound Feed Market Revenues & Volume By Crumble for the Period 2021-2031
- Historical Data and Forecast of Cape Verde Compound Feed Market Revenues & Volume By Other Forms for the Period 2021-2031
- Historical Data and Forecast of Cape Verde Compound Feed Market Revenues & Volume By Livestock for the Period 2021-2031
- Historical Data and Forecast of Cape Verde Compound Feed Market Revenues & Volume By Poultry for the Period 2021-2031
- Historical Data and Forecast of Cape Verde Compound Feed Market Revenues & Volume By Ruminants for the Period 2021-2031
- Historical Data and Forecast of Cape Verde Compound Feed Market Revenues & Volume By Swine for the Period 2021-2031
- Historical Data and Forecast of Cape Verde Compound Feed Market Revenues & Volume By Aquaculture for the Period 2021-2031
- Historical Data and Forecast of Cape Verde Compound Feed Market Revenues & Volume By Other Livestock for the Period 2021-2031
- Cape Verde Compound Feed Import Export Trade Statistics
- Market Opportunity Assessment By Ingredients
- Market Opportunity Assessment By Source
- Market Opportunity Assessment By Form
- Market Opportunity Assessment By Livestock
- Cape Verde Compound Feed Top Companies Market Share
- Cape Verde Compound Feed Competitive Benchmarking By Technical and Operational Parameters
- Cape Verde Compound Feed Company Profiles
- Cape Verde Compound Feed Key Strategic Recommendations
Frequently Asked Questions About the Market Study (FAQs):
6Wresearch actively monitors the Cape Verde Compound Feed Market and publishes its comprehensive annual report, highlighting emerging trends, growth drivers, revenue analysis, and forecast outlook. Our insights help businesses to make data-backed strategic decisions with ongoing market dynamics. Our analysts track relevent industries related to the Cape Verde Compound Feed Market, allowing our clients with actionable intelligence and reliable forecasts tailored to emerging regional needs.
Yes, we provide customisation as per your requirements. To learn more, feel free to contact us on sales@6wresearch.com
1 Executive Summary |
2 Introduction |
2.1 Key Highlights of the Report |
2.2 Report Description |
2.3 Market Scope & Segmentation |
2.4 Research Methodology |
2.5 Assumptions |
3 Cape Verde Compound Feed Market Overview |
3.1 Cape Verde Country Macro Economic Indicators |
3.2 Cape Verde Compound Feed Market Revenues & Volume, 2021 & 2031F |
3.3 Cape Verde Compound Feed Market - Industry Life Cycle |
3.4 Cape Verde Compound Feed Market - Porter's Five Forces |
3.5 Cape Verde Compound Feed Market Revenues & Volume Share, By Ingredients, 2021 & 2031F |
3.6 Cape Verde Compound Feed Market Revenues & Volume Share, By Source, 2021 & 2031F |
3.7 Cape Verde Compound Feed Market Revenues & Volume Share, By Form, 2021 & 2031F |
3.8 Cape Verde Compound Feed Market Revenues & Volume Share, By Livestock, 2021 & 2031F |
4 Cape Verde Compound Feed Market Dynamics |
4.1 Impact Analysis |
4.2 Market Drivers |
4.3 Market Restraints |
5 Cape Verde Compound Feed Market Trends |
6 Cape Verde Compound Feed Market Segmentations |
6.1 Cape Verde Compound Feed Market, By Ingredients |
6.1.1 Overview and Analysis |
6.1.2 Cape Verde Compound Feed Market Revenues & Volume, By Cereals, 2021-2031F |
6.1.3 Cape Verde Compound Feed Market Revenues & Volume, By Cakes & Meals, 2021-2031F |
6.2 Cape Verde Compound Feed Market, By Source |
6.2.1 Overview and Analysis |
6.2.2 Cape Verde Compound Feed Market Revenues & Volume, By Plant-based, 2021-2031F |
6.2.3 Cape Verde Compound Feed Market Revenues & Volume, By Animal-based, 2021-2031F |
6.3 Cape Verde Compound Feed Market, By Form |
6.3.1 Overview and Analysis |
6.3.2 Cape Verde Compound Feed Market Revenues & Volume, By Mash, 2021-2031F |
6.3.3 Cape Verde Compound Feed Market Revenues & Volume, By Pellet, 2021-2031F |
6.3.4 Cape Verde Compound Feed Market Revenues & Volume, By Crumble, 2021-2031F |
6.3.5 Cape Verde Compound Feed Market Revenues & Volume, By Other Forms, 2021-2031F |
6.4 Cape Verde Compound Feed Market, By Livestock |
6.4.1 Overview and Analysis |
6.4.2 Cape Verde Compound Feed Market Revenues & Volume, By Poultry, 2021-2031F |
6.4.3 Cape Verde Compound Feed Market Revenues & Volume, By Ruminants, 2021-2031F |
6.4.4 Cape Verde Compound Feed Market Revenues & Volume, By Swine, 2021-2031F |
6.4.5 Cape Verde Compound Feed Market Revenues & Volume, By Aquaculture, 2021-2031F |
6.4.6 Cape Verde Compound Feed Market Revenues & Volume, By Other Livestock, 2021-2031F |
7 Cape Verde Compound Feed Market Import-Export Trade Statistics |
7.1 Cape Verde Compound Feed Market Export to Major Countries |
7.2 Cape Verde Compound Feed Market Imports from Major Countries |
8 Cape Verde Compound Feed Market Key Performance Indicators |
9 Cape Verde Compound Feed Market - Opportunity Assessment |
9.1 Cape Verde Compound Feed Market Opportunity Assessment, By Ingredients, 2021 & 2031F |
9.2 Cape Verde Compound Feed Market Opportunity Assessment, By Source, 2021 & 2031F |
9.3 Cape Verde Compound Feed Market Opportunity Assessment, By Form, 2021 & 2031F |
9.4 Cape Verde Compound Feed Market Opportunity Assessment, By Livestock, 2021 & 2031F |
10 Cape Verde Compound Feed Market - Competitive Landscape |
10.1 Cape Verde Compound Feed Market Revenue Share, By Companies, 2024 |
10.2 Cape Verde Compound Feed Market Competitive Benchmarking, By Operating and Technical Parameters |
11 Company Profiles |
12 Recommendations | 13 Disclaimer |
Export potential assessment - trade Analytics for 2030
Export potential enables firms to identify high-growth global markets with greater confidence by combining advanced trade intelligence with a structured quantitative methodology. The framework analyzes emerging demand trends and country-level import patterns while integrating macroeconomic and trade datasets such as GDP and population forecasts, bilateral import–export flows, tariff structures, elasticity differentials between developed and developing economies, geographic distance, and import demand projections. Using weighted trade values from 2020–2024 as the base period to project country-to-country export potential for 2030, these inputs are operationalized through calculated drivers such as gravity model parameters, tariff impact factors, and projected GDP per-capita growth. Through an analysis of hidden potentials, demand hotspots, and market conditions that are most favorable to success, this method enables firms to focus on target countries, maximize returns, and global expansion with data, backed by accuracy.
By factoring in the projected importer demand gap that is currently unmet and could be potential opportunity, it identifies the potential for the Exporter (Country) among 190 countries, against the general trade analysis, which identifies the biggest importer or exporter.
To discover high-growth global markets and optimize your business strategy:
Click Here
Pricing
- Single User License$ 1,995
- Department License$ 2,400
- Site License$ 3,120
- Global License$ 3,795

Search
Thought Leadership and Analyst Meet


Our Clients
Related Reports
- Saudi Arabia Core Assurance Service Market (2025-2031) | Strategy, Consumer Insights, Analysis, Investment Trends, Opportunities, Growth, Size, Share, Industry, Revenue, Segments, Value, Segmentation, Supply, Forecast, Restraints, Outlook, Competition, Drivers, Trends, Demand, Pricing Analysis, Competitive, Strategic Insights, Companies, Challenges
- Romania Uninterruptible Power Supply (UPS) Market (2026-2032) | Industry, Analysis, Revenue, Size, Forecast, Outlook, Value, Trends, Share, Growth & Companies
- Saudi Arabia Car Window Tinting Film, Paint Protection Film (PPF), and Ceramic Coating Market (2025-2031) | Strategy, Consumer Insights, Analysis, Investment Trends, Opportunities, Growth, Size, Share, Industry, Revenue, Segments, Value, Segmentation, Supply, Forecast, Restraints, Outlook, Competition, Drivers, Trends, Demand, Pricing Analysis, Competitive, Strategic Insights, Companies, Challenges
- South Africa Stationery Market (2025-2031) | Share, Size, Industry, Value, Growth, Revenue, Analysis, Trends, Segmentation & Outlook
- Afghanistan Rocking Chairs And Adirondack Chairs Market (2026-2032) | Size & Revenue, Competitive Landscape, Share, Segmentation, Industry, Value, Outlook, Analysis, Trends, Growth, Forecast, Companies
- Afghanistan Apparel Market (2026-2032) | Growth, Outlook, Industry, Segmentation, Forecast, Size, Companies, Trends, Value, Share, Analysis & Revenue
- Canada Oil and Gas Market (2026-2032) | Share, Segmentation, Value, Industry, Trends, Forecast, Analysis, Size & Revenue, Growth, Competitive Landscape, Outlook, Companies
- Germany Breakfast Food Market (2026-2032) | Industry, Share, Growth, Size, Companies, Value, Analysis, Revenue, Trends, Forecast & Outlook
- Australia Briquette Market (2025-2031) | Growth, Size, Revenue, Forecast, Analysis, Trends, Value, Share, Industry & Companies
- Vietnam System Integrator Market (2026-2032) | Size, Companies, Analysis, Industry, Value, Forecast, Growth, Trends, Revenue & Share
Industry Events and Analyst Meet

Stationery & Paper Expo Saudi Arabia 2026

Kids & Toys Expo Saudi Arabia 2026

Gifts & Homeware Expo Saudi Arabia 2026

Smart Home Expo 2026

Industrial Facilities Management Expo 2025
Whitepaper
- Middle East & Africa Commercial Security Market Click here to view more.
- Middle East & Africa Fire Safety Systems & Equipment Market Click here to view more.
- GCC Drone Market Click here to view more.
- Middle East Lighting Fixture Market Click here to view more.
- GCC Physical & Perimeter Security Market Click here to view more.
6WResearch In News
- Doha a strategic location for EV manufacturing hub: IPA Qatar
- Demand for luxury TVs surging in the GCC, says Samsung
- Empowering Growth: The Thriving Journey of Bangladesh’s Cable Industry
- Demand for luxury TVs surging in the GCC, says Samsung
- Video call with a traditional healer? Once unthinkable, it’s now common in South Africa
- Intelligent Buildings To Smooth GCC’s Path To Net Zero