China Reverse Osmosis (RO) Membrane Market (2025-2031) Outlook | Companies, Size, Trends, Growth, Industry, Analysis, Share, Value, Revenue & Forecast
Market Forecast By Type (Thin-film composite membranes, Cellulose based membranes), By End Use Industry (Water & Wastewater treatment, Industrial Processing), By Application (Desalination, Utility water treatment, Wastewater treatment & reuse, Process water), By Filter Module (Spiral Wound, Hollow Fiber, Tubular, Plate and Frame) And Competitive Landscape
| Product Code: ETC4518562 | Publication Date: Jul 2023 | Updated Date: Oct 2025 | Product Type: Report | |
| Publisher: 6Wresearch | Author: Ravi Bhandari | No. of Pages: 85 | No. of Figures: 45 | No. of Tables: 25 |
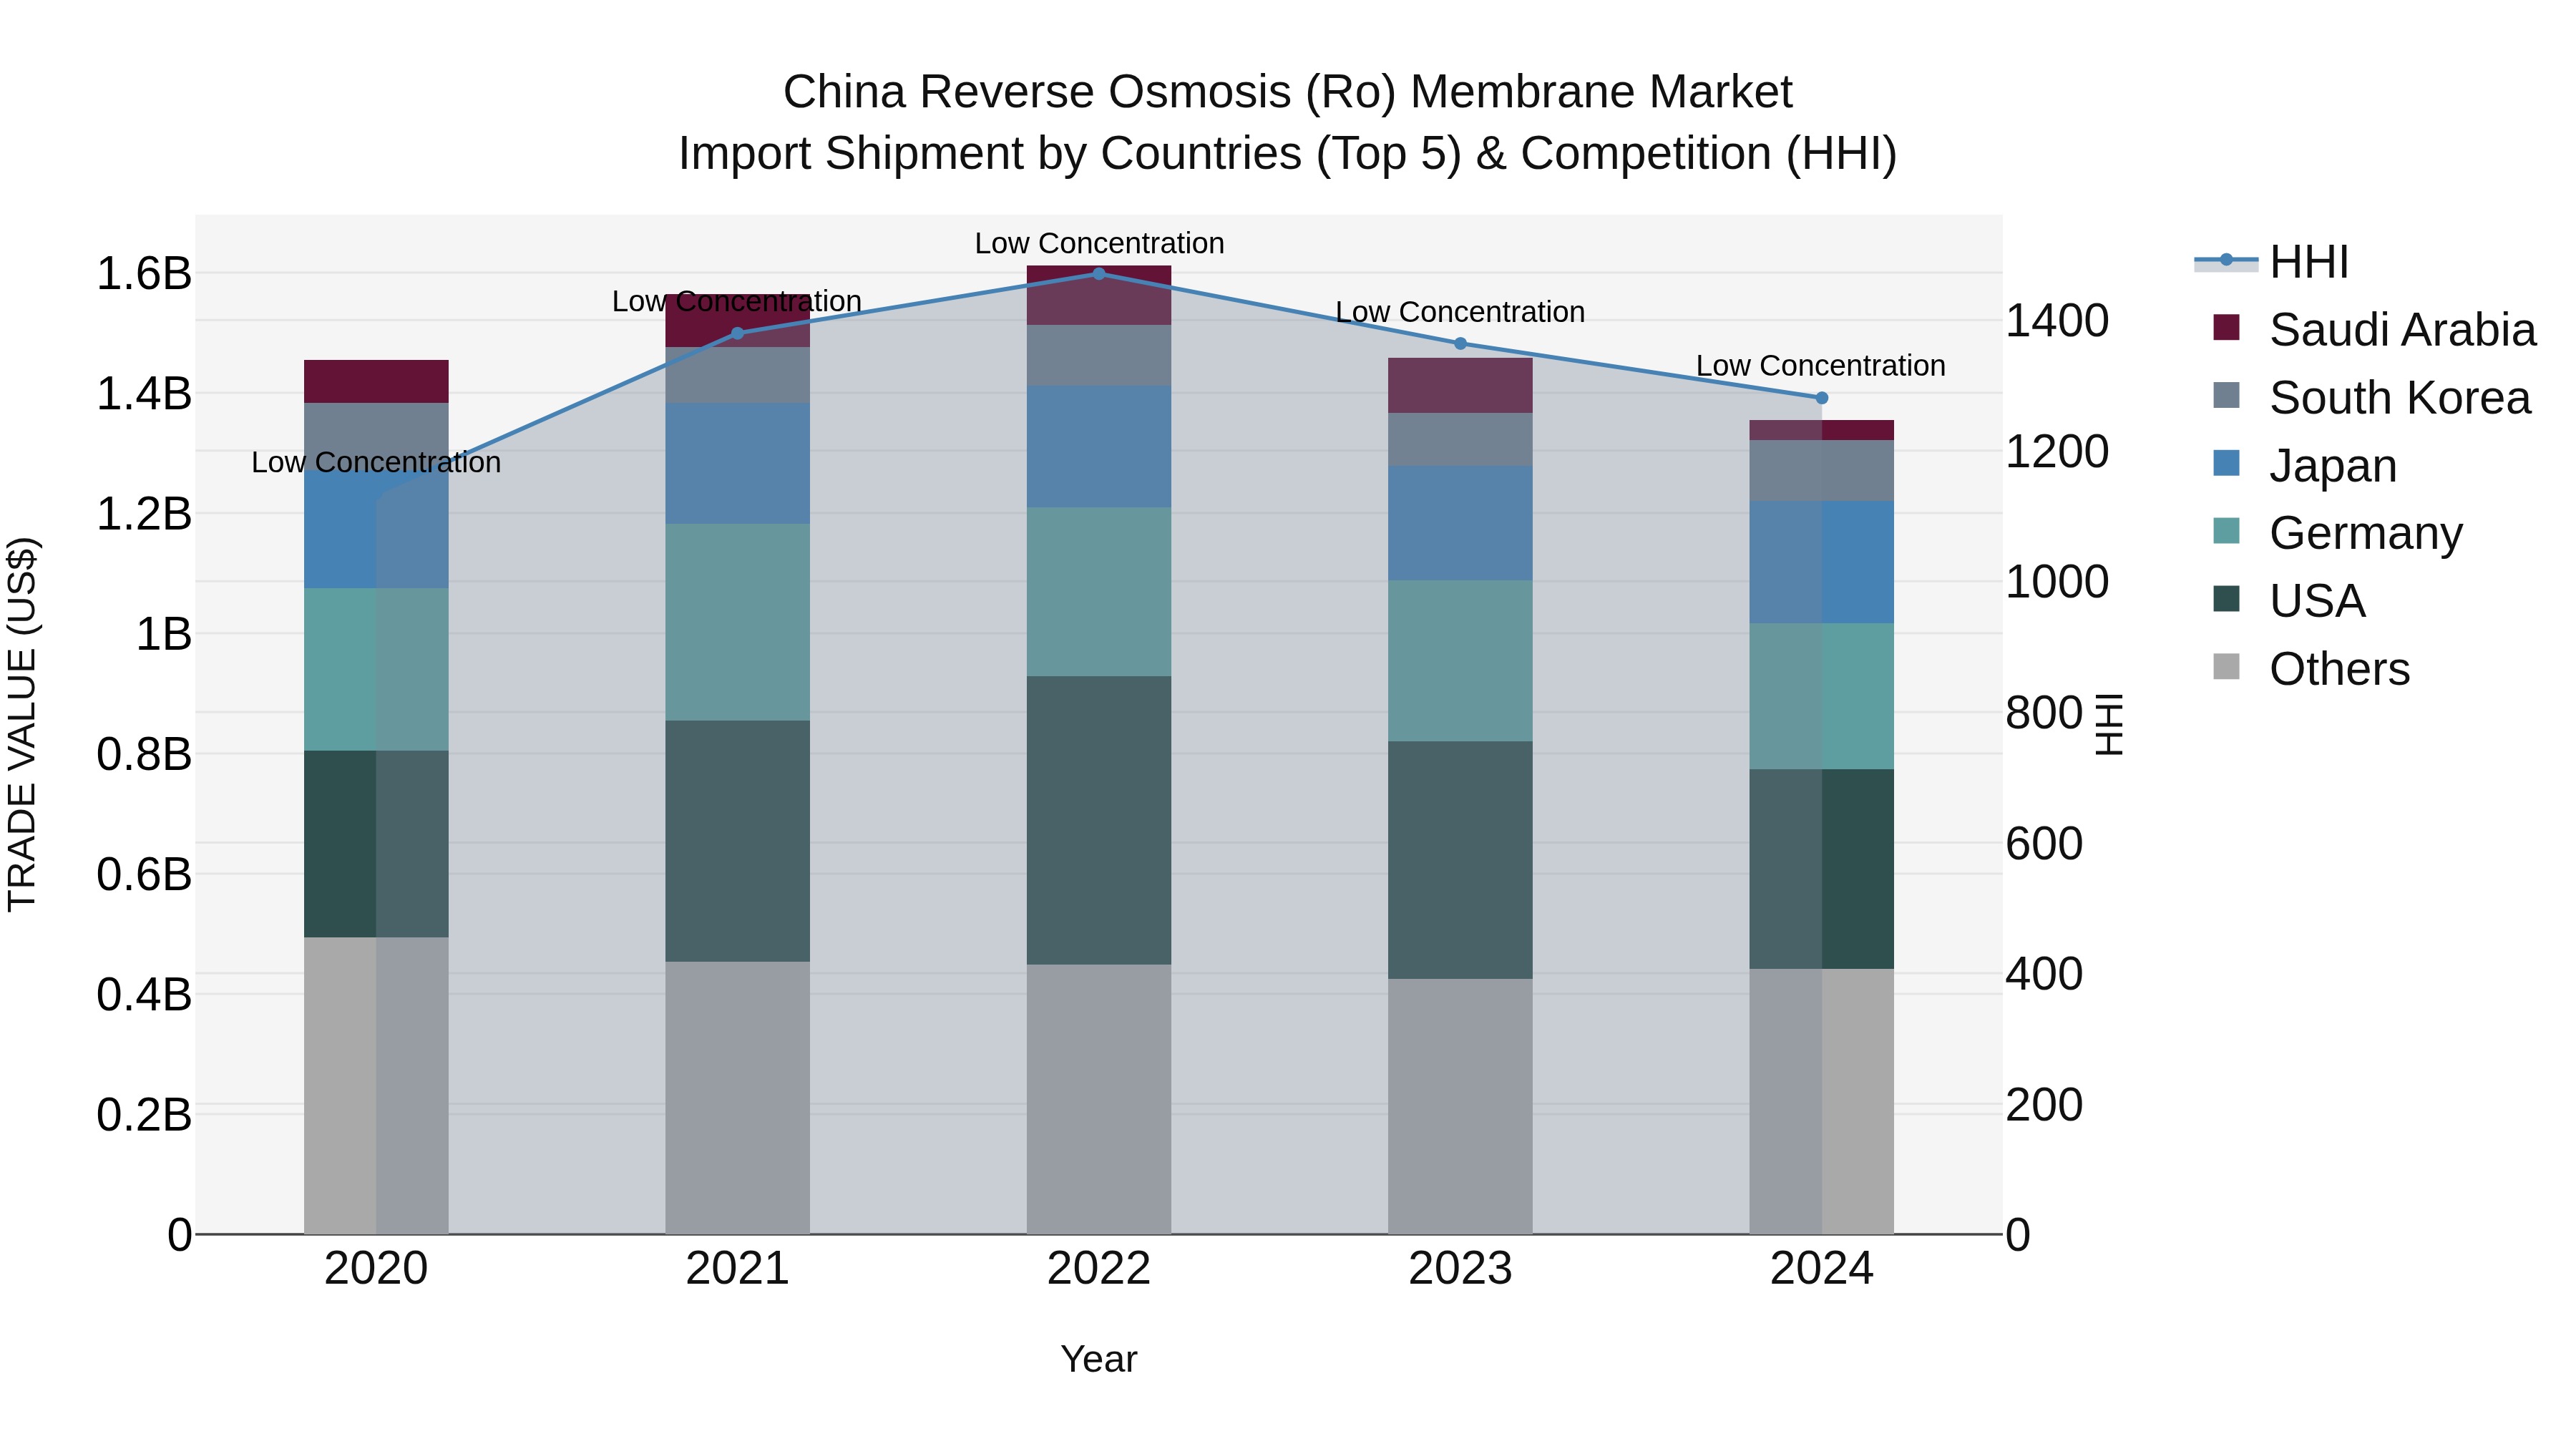
China Reverse Osmosis (Ro) Membrane Market Top 5 Importing Countries and Market Competition (HHI) Analysis
In 2024, China reverse osmosis (RO) membrane import shipments continued to be dominated by top exporters including the USA, Germany, Japan, South Korea, and the UK. Despite a decline in the Compound Annual Growth Rate (CAGR) from 2020-24 at -1.76%, the market remained relatively stable with low concentration according to the Herfindahl-Hirschman Index (HHI). However, the negative growth rate of -7.06% from 2023-24 indicates a recent slowdown in import activity, suggesting a need for further analysis and potential strategies to stimulate growth in the coming years.
Key Highlights of the Report:
- China Reverse Osmosis (RO) Membrane Market Outlook
- Market Size of China Reverse Osmosis (RO) Membrane Market, 2024
- Forecast of China Reverse Osmosis (RO) Membrane Market, 2031
- Historical Data and Forecast of China Reverse Osmosis (RO) Membrane Revenues & Volume for the Period 2021 - 2031
- China Reverse Osmosis (RO) Membrane Market Trend Evolution
- China Reverse Osmosis (RO) Membrane Market Drivers and Challenges
- China Reverse Osmosis (RO) Membrane Price Trends
- China Reverse Osmosis (RO) Membrane Porter's Five Forces
- China Reverse Osmosis (RO) Membrane Industry Life Cycle
- Historical Data and Forecast of China Reverse Osmosis (RO) Membrane Market Revenues & Volume By Type for the Period 2021 - 2031
- Historical Data and Forecast of China Reverse Osmosis (RO) Membrane Market Revenues & Volume By Thin-film composite membranes for the Period 2021 - 2031
- Historical Data and Forecast of China Reverse Osmosis (RO) Membrane Market Revenues & Volume By Cellulose based membranes for the Period 2021 - 2031
- Historical Data and Forecast of China Reverse Osmosis (RO) Membrane Market Revenues & Volume By End Use Industry for the Period 2021 - 2031
- Historical Data and Forecast of China Reverse Osmosis (RO) Membrane Market Revenues & Volume By Water & Wastewater treatment for the Period 2021 - 2031
- Historical Data and Forecast of China Reverse Osmosis (RO) Membrane Market Revenues & Volume By Industrial Processing for the Period 2021 - 2031
- Historical Data and Forecast of China Reverse Osmosis (RO) Membrane Market Revenues & Volume By Application for the Period 2021 - 2031
- Historical Data and Forecast of China Reverse Osmosis (RO) Membrane Market Revenues & Volume By Desalination for the Period 2021 - 2031
- Historical Data and Forecast of China Reverse Osmosis (RO) Membrane Market Revenues & Volume By Utility water treatment for the Period 2021 - 2031
- Historical Data and Forecast of China Reverse Osmosis (RO) Membrane Market Revenues & Volume By Wastewater treatment & reuse for the Period 2021 - 2031
- Historical Data and Forecast of China Reverse Osmosis (RO) Membrane Market Revenues & Volume By Process water for the Period 2021 - 2031
- Historical Data and Forecast of China Reverse Osmosis (RO) Membrane Market Revenues & Volume By Filter Module for the Period 2021 - 2031
- Historical Data and Forecast of China Reverse Osmosis (RO) Membrane Market Revenues & Volume By Spiral Wound for the Period 2021 - 2031
- Historical Data and Forecast of China Reverse Osmosis (RO) Membrane Market Revenues & Volume By Hollow Fiber for the Period 2021 - 2031
- Historical Data and Forecast of China Reverse Osmosis (RO) Membrane Market Revenues & Volume By Tubular for the Period 2021 - 2031
- Historical Data and Forecast of China Reverse Osmosis (RO) Membrane Market Revenues & Volume By Plate and Frame for the Period 2021 - 2031
- China Reverse Osmosis (RO) Membrane Import Export Trade Statistics
- Market Opportunity Assessment By Type
- Market Opportunity Assessment By End Use Industry
- Market Opportunity Assessment By Application
- Market Opportunity Assessment By Filter Module
- China Reverse Osmosis (RO) Membrane Top Companies Market Share
- China Reverse Osmosis (RO) Membrane Competitive Benchmarking By Technical and Operational Parameters
- China Reverse Osmosis (RO) Membrane Company Profiles
- China Reverse Osmosis (RO) Membrane Key Strategic Recommendations
Frequently Asked Questions About the Market Study (FAQs):
6Wresearch actively monitors the China Reverse Osmosis (RO) Membrane Market and publishes its comprehensive annual report, highlighting emerging trends, growth drivers, revenue analysis, and forecast outlook. Our insights help businesses to make data-backed strategic decisions with ongoing market dynamics. Our analysts track relevent industries related to the China Reverse Osmosis (RO) Membrane Market, allowing our clients with actionable intelligence and reliable forecasts tailored to emerging regional needs.
Yes, we provide customisation as per your requirements. To learn more, feel free to contact us on sales@6wresearch.com
1 Executive Summary |
2 Introduction |
2.1 Key Highlights of the Report |
2.2 Report Description |
2.3 Market Scope & Segmentation |
2.4 Research Methodology |
2.5 Assumptions |
3 China Reverse Osmosis (RO) Membrane Market Overview |
3.1 China Country Macro Economic Indicators |
3.2 China Reverse Osmosis (RO) Membrane Market Revenues & Volume, 2021 & 2031F |
3.3 China Reverse Osmosis (RO) Membrane Market - Industry Life Cycle |
3.4 China Reverse Osmosis (RO) Membrane Market - Porter's Five Forces |
3.5 China Reverse Osmosis (RO) Membrane Market Revenues & Volume Share, By Type, 2021 & 2031F |
3.6 China Reverse Osmosis (RO) Membrane Market Revenues & Volume Share, By End Use Industry, 2021 & 2031F |
3.7 China Reverse Osmosis (RO) Membrane Market Revenues & Volume Share, By Application, 2021 & 2031F |
3.8 China Reverse Osmosis (RO) Membrane Market Revenues & Volume Share, By Filter Module, 2021 & 2031F |
4 China Reverse Osmosis (RO) Membrane Market Dynamics |
4.1 Impact Analysis |
4.2 Market Drivers |
4.2.1 Increasing water pollution levels in China driving the demand for efficient water treatment solutions like RO membranes. |
4.2.2 Growing awareness about the importance of clean water for both industrial and residential sectors. |
4.2.3 Government initiatives and regulations promoting the adoption of water treatment technologies like reverse osmosis membranes. |
4.3 Market Restraints |
4.3.1 High initial investment costs associated with setting up reverse osmosis membrane systems. |
4.3.2 Intense competition in the market leading to price wars and margin pressures. |
4.3.3 Challenges related to the disposal and management of RO membrane waste. |
5 China Reverse Osmosis (RO) Membrane Market Trends |
6 China Reverse Osmosis (RO) Membrane Market, By Types |
6.1 China Reverse Osmosis (RO) Membrane Market, By Type |
6.1.1 Overview and Analysis |
6.1.2 China Reverse Osmosis (RO) Membrane Market Revenues & Volume, By Type, 2021 - 2031F |
6.1.3 China Reverse Osmosis (RO) Membrane Market Revenues & Volume, By Thin-film composite membranes, 2021 - 2031F |
6.1.4 China Reverse Osmosis (RO) Membrane Market Revenues & Volume, By Cellulose based membranes, 2021 - 2031F |
6.2 China Reverse Osmosis (RO) Membrane Market, By End Use Industry |
6.2.1 Overview and Analysis |
6.2.2 China Reverse Osmosis (RO) Membrane Market Revenues & Volume, By Water & Wastewater treatment, 2021 - 2031F |
6.2.3 China Reverse Osmosis (RO) Membrane Market Revenues & Volume, By Industrial Processing, 2021 - 2031F |
6.3 China Reverse Osmosis (RO) Membrane Market, By Application |
6.3.1 Overview and Analysis |
6.3.2 China Reverse Osmosis (RO) Membrane Market Revenues & Volume, By Desalination, 2021 - 2031F |
6.3.3 China Reverse Osmosis (RO) Membrane Market Revenues & Volume, By Utility water treatment, 2021 - 2031F |
6.3.4 China Reverse Osmosis (RO) Membrane Market Revenues & Volume, By Wastewater treatment & reuse, 2021 - 2031F |
6.3.5 China Reverse Osmosis (RO) Membrane Market Revenues & Volume, By Process water, 2021 - 2031F |
6.4 China Reverse Osmosis (RO) Membrane Market, By Filter Module |
6.4.1 Overview and Analysis |
6.4.2 China Reverse Osmosis (RO) Membrane Market Revenues & Volume, By Spiral Wound, 2021 - 2031F |
6.4.3 China Reverse Osmosis (RO) Membrane Market Revenues & Volume, By Hollow Fiber, 2021 - 2031F |
6.4.4 China Reverse Osmosis (RO) Membrane Market Revenues & Volume, By Tubular, 2021 - 2031F |
6.4.5 China Reverse Osmosis (RO) Membrane Market Revenues & Volume, By Plate and Frame, 2021 - 2031F |
7 China Reverse Osmosis (RO) Membrane Market Import-Export Trade Statistics |
7.1 China Reverse Osmosis (RO) Membrane Market Export to Major Countries |
7.2 China Reverse Osmosis (RO) Membrane Market Imports from Major Countries |
8 China Reverse Osmosis (RO) Membrane Market Key Performance Indicators |
8.1 Water quality improvement index indicating the effectiveness of RO membranes in purifying water. |
8.2 Adoption rate of RO membrane systems in key industries such as pharmaceuticals, food beverage, and electronics. |
8.3 Innovation rate in RO membrane technology, measured by the number of patents filed or new product launches. |
9 China Reverse Osmosis (RO) Membrane Market - Opportunity Assessment |
9.1 China Reverse Osmosis (RO) Membrane Market Opportunity Assessment, By Type, 2021 & 2031F |
9.2 China Reverse Osmosis (RO) Membrane Market Opportunity Assessment, By End Use Industry, 2021 & 2031F |
9.3 China Reverse Osmosis (RO) Membrane Market Opportunity Assessment, By Application, 2021 & 2031F |
9.4 China Reverse Osmosis (RO) Membrane Market Opportunity Assessment, By Filter Module, 2021 & 2031F |
10 China Reverse Osmosis (RO) Membrane Market - Competitive Landscape |
10.1 China Reverse Osmosis (RO) Membrane Market Revenue Share, By Companies, 2024 |
10.2 China Reverse Osmosis (RO) Membrane Market Competitive Benchmarking, By Operating and Technical Parameters |
11 Company Profiles |
12 Recommendations |
13 Disclaimer |
Export potential assessment - trade Analytics for 2030
Export potential enables firms to identify high-growth global markets with greater confidence by combining advanced trade intelligence with a structured quantitative methodology. The framework analyzes emerging demand trends and country-level import patterns while integrating macroeconomic and trade datasets such as GDP and population forecasts, bilateral import–export flows, tariff structures, elasticity differentials between developed and developing economies, geographic distance, and import demand projections. Using weighted trade values from 2020–2024 as the base period to project country-to-country export potential for 2030, these inputs are operationalized through calculated drivers such as gravity model parameters, tariff impact factors, and projected GDP per-capita growth. Through an analysis of hidden potentials, demand hotspots, and market conditions that are most favorable to success, this method enables firms to focus on target countries, maximize returns, and global expansion with data, backed by accuracy.
By factoring in the projected importer demand gap that is currently unmet and could be potential opportunity, it identifies the potential for the Exporter (Country) among 190 countries, against the general trade analysis, which identifies the biggest importer or exporter.
To discover high-growth global markets and optimize your business strategy:
Click Here
Pricing
- Single User License$ 1,995
- Department License$ 2,400
- Site License$ 3,120
- Global License$ 3,795

Search
Thought Leadership and Analyst Meet


Our Clients
Related Reports
- Pakistan Contraceptive Implants Market (2025-2031) | Demand, Growth, Size, Share, Industry, Pricing Analysis, Competitive, Strategic Insights, Strategy, Consumer Insights, Analysis, Investment Trends, Opportunities, Revenue, Segments, Value, Segmentation, Supply, Forecast, Restraints, Outlook, Competition, Drivers, Trends, Companies, Challenges
- Sri Lanka Packaging Market (2026-2032) | Outlook, Competition, Drivers, Trends, Demand, Pricing Analysis, Competitive, Strategic Insights, Companies, Challenges, Strategy, Consumer Insights, Analysis, Investment Trends, Opportunities, Growth, Size, Share, Industry, Revenue, Segments, Value, Segmentation, Supply, Forecast, Restraints
- India Kids Watches Market (2026-2032) | Strategy, Consumer Insights, Analysis, Investment Trends, Opportunities, Growth, Size, Share, Industry, Revenue, Segments, Value, Segmentation, Supply, Forecast, Restraints, Outlook, Competition, Drivers, Trends, Demand, Pricing Analysis, Competitive, Strategic Insights, Companies, Challenges
- Saudi Arabia Core Assurance Service Market (2025-2031) | Strategy, Consumer Insights, Analysis, Investment Trends, Opportunities, Growth, Size, Share, Industry, Revenue, Segments, Value, Segmentation, Supply, Forecast, Restraints, Outlook, Competition, Drivers, Trends, Demand, Pricing Analysis, Competitive, Strategic Insights, Companies, Challenges
- Romania Uninterruptible Power Supply (UPS) Market (2026-2032) | Industry, Analysis, Revenue, Size, Forecast, Outlook, Value, Trends, Share, Growth & Companies
- Saudi Arabia Car Window Tinting Film, Paint Protection Film (PPF), and Ceramic Coating Market (2025-2031) | Strategy, Consumer Insights, Analysis, Investment Trends, Opportunities, Growth, Size, Share, Industry, Revenue, Segments, Value, Segmentation, Supply, Forecast, Restraints, Outlook, Competition, Drivers, Trends, Demand, Pricing Analysis, Competitive, Strategic Insights, Companies, Challenges
- South Africa Stationery Market (2025-2031) | Share, Size, Industry, Value, Growth, Revenue, Analysis, Trends, Segmentation & Outlook
- Afghanistan Rocking Chairs And Adirondack Chairs Market (2026-2032) | Size & Revenue, Competitive Landscape, Share, Segmentation, Industry, Value, Outlook, Analysis, Trends, Growth, Forecast, Companies
- Afghanistan Apparel Market (2026-2032) | Growth, Outlook, Industry, Segmentation, Forecast, Size, Companies, Trends, Value, Share, Analysis & Revenue
- Canada Oil and Gas Market (2026-2032) | Share, Segmentation, Value, Industry, Trends, Forecast, Analysis, Size & Revenue, Growth, Competitive Landscape, Outlook, Companies
Industry Events and Analyst Meet

EV tech India Expo 2026

Auto Tech Asia 2026

Battery Tech India 2026

Smart Production Solutions Guangzhou 2026

Stationery & Paper Expo Saudi Arabia 2026
Whitepaper
- Middle East & Africa Commercial Security Market Click here to view more.
- Middle East & Africa Fire Safety Systems & Equipment Market Click here to view more.
- GCC Drone Market Click here to view more.
- Middle East Lighting Fixture Market Click here to view more.
- GCC Physical & Perimeter Security Market Click here to view more.
6WResearch In News
- Doha a strategic location for EV manufacturing hub: IPA Qatar
- Demand for luxury TVs surging in the GCC, says Samsung
- Empowering Growth: The Thriving Journey of Bangladesh’s Cable Industry
- Demand for luxury TVs surging in the GCC, says Samsung
- Video call with a traditional healer? Once unthinkable, it’s now common in South Africa
- Intelligent Buildings To Smooth GCC’s Path To Net Zero