Congo Corrosion Inhibitors Market (2025-2031) | Analysis, Revenue, Forecast, Size, Industry, Growth, Segmentation, Share, Companies, Outlook, Trends & Value
Market Forecast By Product (Organic, Inorganic), By Type (Water Based, Oil Based), By End-use (Power Generation, Oil & Gas, Paper & Pulp, Metal Processing, Chemical Processing, Water Treatment, Others) And Competitive Landscape
| Product Code: ETC4665925 | Publication Date: Nov 2023 | Updated Date: Dec 2025 | Product Type: Market Research Report | |
| Publisher: 6Wresearch | Author: Shubham Deep | No. of Pages: 60 | No. of Figures: 30 | No. of Tables: 5 |
Congo Corrosion Inhibitors Market: Top 5 Importing Countries and Market Competition (HHI) Analysis
Congo corrosion inhibitors import market saw significant growth in 2023, with top exporters including United Arab Emirates, France, Belgium, China, and Netherlands. Despite high concentration levels indicated by the Herfindahl-Hirschman Index (HHI), the market experienced a remarkable compound annual growth rate (CAGR) of 93.75% and a growth rate of 204.51%. This suggests a strong demand for corrosion inhibitors in Congo and highlights the competitive landscape among major exporting countries vying for market share.

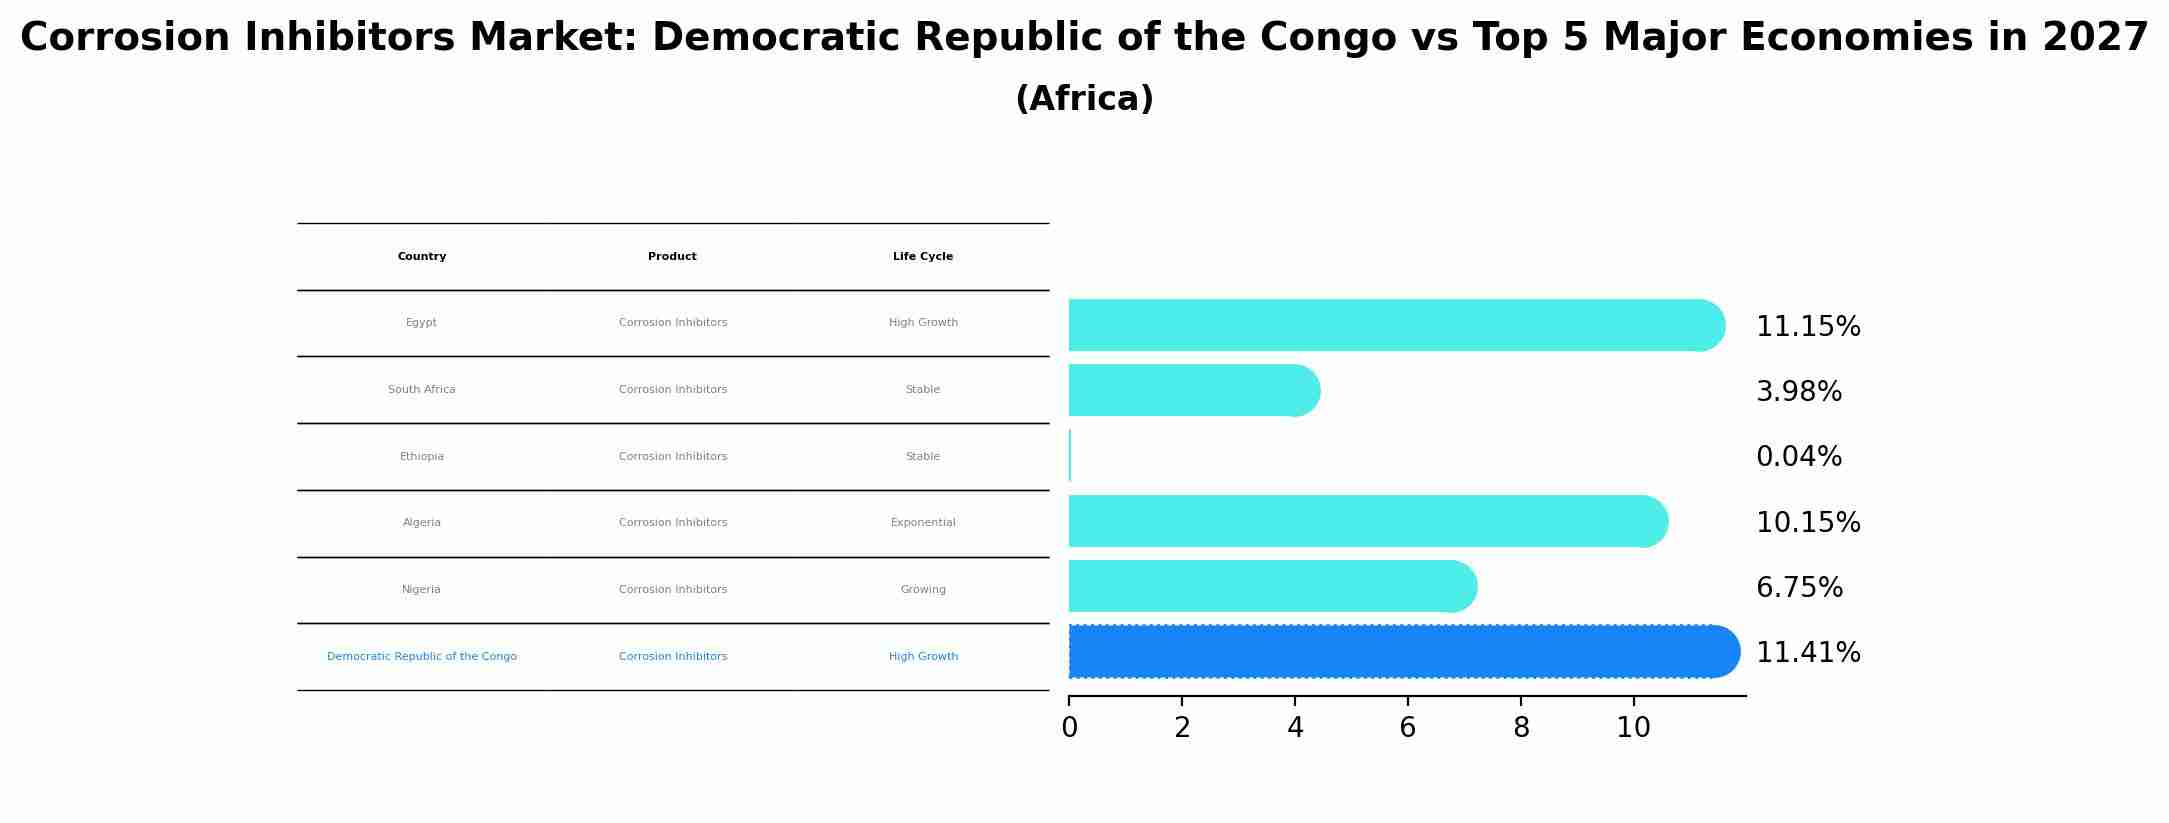
Corrosion Inhibitors Market: Democratic Republic of the Congo vs Top 5 Major Economies in 2027 (Africa)
In the Africa region, the Corrosion Inhibitors market in Democratic Republic of the Congo is projected to expand at a high growth rate of 11.41% by 2027. The largest economy is Egypt, followed by South Africa, Ethiopia, Algeria and Nigeria.
Congo Corrosion Inhibitors Market Overview
The Corrosion Inhibitors Market in Congo is driven by the need to protect metal surfaces in various industries, including oil and gas, water treatment, and manufacturing. These inhibitors help reduce maintenance costs and extend the life of equipment, making them essential in harsh environmental conditions. However, the market faces challenges such as environmental concerns related to chemical use, the high cost of advanced inhibitors, and the need for continuous innovation to develop more effective and sustainable solutions.
Drivers of the market
In Congo, the Corrosion Inhibitors market is primarily driven by the growing industrialization, especially in sectors like oil and gas, construction, and chemicals. The need to protect infrastructure and equipment from corrosion, particularly in harsh environmental conditions, drives demand for corrosion inhibitors.
Challenges of the market
The Corrosion Inhibitors market in Congo faces challenges from limited industrial activities and infrastructure development, reducing the overall demand for these products. Additionally, there is a lack of locally produced corrosion inhibitors, which leads to a reliance on imports that can be costly and subject to supply chain disruptions. Furthermore, the market is constrained by the absence of stringent regulations for industrial maintenance and protection against corrosion.
Government Policy of the market
The corrosion inhibitors market in Congo is shaped by government policies aimed at protecting industrial infrastructure, particularly in the oil and gas, mining, and construction sectors. Environmental regulations require companies to use approved corrosion inhibitors to minimize environmental impact. Additionally, policies promoting the development of local manufacturing capabilities and reducing dependency on imports are driving the growth of this market.
Key Highlights of the Report:
- Congo Corrosion Inhibitors Market Outlook
- Market Size of Congo Corrosion Inhibitors Market, 2024
- Forecast of Congo Corrosion Inhibitors Market, 2031
- Historical Data and Forecast of Congo Corrosion Inhibitors Revenues & Volume for the Period 2021-2031
- Congo Corrosion Inhibitors Market Trend Evolution
- Congo Corrosion Inhibitors Market Drivers and Challenges
- Congo Corrosion Inhibitors Price Trends
- Congo Corrosion Inhibitors Porter`s Five Forces
- Congo Corrosion Inhibitors Industry Life Cycle
- Historical Data and Forecast of Congo Corrosion Inhibitors Market Revenues & Volume By Product for the Period 2021-2031
- Historical Data and Forecast of Congo Corrosion Inhibitors Market Revenues & Volume By Organic for the Period 2021-2031
- Historical Data and Forecast of Congo Corrosion Inhibitors Market Revenues & Volume By Inorganic for the Period 2021-2031
- Historical Data and Forecast of Congo Corrosion Inhibitors Market Revenues & Volume By Type for the Period 2021-2031
- Historical Data and Forecast of Congo Corrosion Inhibitors Market Revenues & Volume By Water Based for the Period 2021-2031
- Historical Data and Forecast of Congo Corrosion Inhibitors Market Revenues & Volume By Oil Based for the Period 2021-2031
- Historical Data and Forecast of Congo Corrosion Inhibitors Market Revenues & Volume By End-use for the Period 2021-2031
- Historical Data and Forecast of Congo Corrosion Inhibitors Market Revenues & Volume By Power Generation for the Period 2021-2031
- Historical Data and Forecast of Congo Corrosion Inhibitors Market Revenues & Volume By Oil & Gas for the Period 2021-2031
- Historical Data and Forecast of Congo Corrosion Inhibitors Market Revenues & Volume By Paper & Pulp for the Period 2021-2031
- Historical Data and Forecast of Congo Corrosion Inhibitors Market Revenues & Volume By Metal Processing for the Period 2021-2031
- Historical Data and Forecast of Congo Corrosion Inhibitors Market Revenues & Volume By Chemical Processing for the Period 2021-2031
- Historical Data and Forecast of Congo Corrosion Inhibitors Market Revenues & Volume By Water Treatment for the Period 2021-2031
- Historical Data and Forecast of Congo Corrosion Inhibitors Market Revenues & Volume By Others for the Period 2021-2031
- Congo Corrosion Inhibitors Import Export Trade Statistics
- Market Opportunity Assessment By Product
- Market Opportunity Assessment By Type
- Market Opportunity Assessment By End-use
- Congo Corrosion Inhibitors Top Companies Market Share
- Congo Corrosion Inhibitors Competitive Benchmarking By Technical and Operational Parameters
- Congo Corrosion Inhibitors Company Profiles
- Congo Corrosion Inhibitors Key Strategic Recommendations
Frequently Asked Questions About the Market Study (FAQs):
6Wresearch actively monitors the Congo Corrosion Inhibitors Market and publishes its comprehensive annual report, highlighting emerging trends, growth drivers, revenue analysis, and forecast outlook. Our insights help businesses to make data-backed strategic decisions with ongoing market dynamics. Our analysts track relevent industries related to the Congo Corrosion Inhibitors Market, allowing our clients with actionable intelligence and reliable forecasts tailored to emerging regional needs.
Yes, we provide customisation as per your requirements. To learn more, feel free to contact us on sales@6wresearch.com
1 Executive Summary |
2 Introduction |
2.1 Key Highlights of the Report |
2.2 Report Description |
2.3 Market Scope & Segmentation |
2.4 Research Methodology |
2.5 Assumptions |
3 Congo Corrosion Inhibitors Market Overview |
3.1 Congo Country Macro Economic Indicators |
3.2 Congo Corrosion Inhibitors Market Revenues & Volume, 2021 & 2031F |
3.3 Congo Corrosion Inhibitors Market - Industry Life Cycle |
3.4 Congo Corrosion Inhibitors Market - Porter's Five Forces |
3.5 Congo Corrosion Inhibitors Market Revenues & Volume Share, By Product, 2021 & 2031F |
3.6 Congo Corrosion Inhibitors Market Revenues & Volume Share, By Type, 2021 & 2031F |
3.7 Congo Corrosion Inhibitors Market Revenues & Volume Share, By End-use, 2021 & 2031F |
4 Congo Corrosion Inhibitors Market Dynamics |
4.1 Impact Analysis |
4.2 Market Drivers |
4.3 Market Restraints |
5 Congo Corrosion Inhibitors Market Trends |
6 Congo Corrosion Inhibitors Market Segmentations |
6.1 Congo Corrosion Inhibitors Market, By Product |
6.1.1 Overview and Analysis |
6.1.2 Congo Corrosion Inhibitors Market Revenues & Volume, By Organic, 2021-2031F |
6.1.3 Congo Corrosion Inhibitors Market Revenues & Volume, By Inorganic, 2021-2031F |
6.2 Congo Corrosion Inhibitors Market, By Type |
6.2.1 Overview and Analysis |
6.2.2 Congo Corrosion Inhibitors Market Revenues & Volume, By Water Based, 2021-2031F |
6.2.3 Congo Corrosion Inhibitors Market Revenues & Volume, By Oil Based, 2021-2031F |
6.3 Congo Corrosion Inhibitors Market, By End-use |
6.3.1 Overview and Analysis |
6.3.2 Congo Corrosion Inhibitors Market Revenues & Volume, By Power Generation, 2021-2031F |
6.3.3 Congo Corrosion Inhibitors Market Revenues & Volume, By Oil & Gas, 2021-2031F |
6.3.4 Congo Corrosion Inhibitors Market Revenues & Volume, By Paper & Pulp, 2021-2031F |
6.3.5 Congo Corrosion Inhibitors Market Revenues & Volume, By Metal Processing, 2021-2031F |
6.3.6 Congo Corrosion Inhibitors Market Revenues & Volume, By Chemical Processing, 2021-2031F |
6.3.7 Congo Corrosion Inhibitors Market Revenues & Volume, By Water Treatment, 2021-2031F |
7 Congo Corrosion Inhibitors Market Import-Export Trade Statistics |
7.1 Congo Corrosion Inhibitors Market Export to Major Countries |
7.2 Congo Corrosion Inhibitors Market Imports from Major Countries |
8 Congo Corrosion Inhibitors Market Key Performance Indicators |
9 Congo Corrosion Inhibitors Market - Opportunity Assessment |
9.1 Congo Corrosion Inhibitors Market Opportunity Assessment, By Product, 2021 & 2031F |
9.2 Congo Corrosion Inhibitors Market Opportunity Assessment, By Type, 2021 & 2031F |
9.3 Congo Corrosion Inhibitors Market Opportunity Assessment, By End-use, 2021 & 2031F |
10 Congo Corrosion Inhibitors Market - Competitive Landscape |
10.1 Congo Corrosion Inhibitors Market Revenue Share, By Companies, 2024 |
10.2 Congo Corrosion Inhibitors Market Competitive Benchmarking, By Operating and Technical Parameters |
11 Company Profiles |
12 Recommendations | 13 Disclaimer |
Export potential assessment - trade Analytics for 2030
Export potential enables firms to identify high-growth global markets with greater confidence by combining advanced trade intelligence with a structured quantitative methodology. The framework analyzes emerging demand trends and country-level import patterns while integrating macroeconomic and trade datasets such as GDP and population forecasts, bilateral import–export flows, tariff structures, elasticity differentials between developed and developing economies, geographic distance, and import demand projections. Using weighted trade values from 2020–2024 as the base period to project country-to-country export potential for 2030, these inputs are operationalized through calculated drivers such as gravity model parameters, tariff impact factors, and projected GDP per-capita growth. Through an analysis of hidden potentials, demand hotspots, and market conditions that are most favorable to success, this method enables firms to focus on target countries, maximize returns, and global expansion with data, backed by accuracy.
By factoring in the projected importer demand gap that is currently unmet and could be potential opportunity, it identifies the potential for the Exporter (Country) among 190 countries, against the general trade analysis, which identifies the biggest importer or exporter.
To discover high-growth global markets and optimize your business strategy:
Click Here
Pricing
- Single User License$ 1,995
- Department License$ 2,400
- Site License$ 3,120
- Global License$ 3,795

Search
Thought Leadership and Analyst Meet


Our Clients
Related Reports
- India Switchgear Market Outlook (2026 - 2032) | Size, Share, Trends, Growth, Revenue, Forecast, Analysis, Value, Outlook
- Pakistan Contraceptive Implants Market (2025-2031) | Demand, Growth, Size, Share, Industry, Pricing Analysis, Competitive, Strategic Insights, Strategy, Consumer Insights, Analysis, Investment Trends, Opportunities, Revenue, Segments, Value, Segmentation, Supply, Forecast, Restraints, Outlook, Competition, Drivers, Trends, Companies, Challenges
- Sri Lanka Packaging Market (2026-2032) | Outlook, Competition, Drivers, Trends, Demand, Pricing Analysis, Competitive, Strategic Insights, Companies, Challenges, Strategy, Consumer Insights, Analysis, Investment Trends, Opportunities, Growth, Size, Share, Industry, Revenue, Segments, Value, Segmentation, Supply, Forecast, Restraints
- India Kids Watches Market (2026-2032) | Strategy, Consumer Insights, Analysis, Investment Trends, Opportunities, Growth, Size, Share, Industry, Revenue, Segments, Value, Segmentation, Supply, Forecast, Restraints, Outlook, Competition, Drivers, Trends, Demand, Pricing Analysis, Competitive, Strategic Insights, Companies, Challenges
- Saudi Arabia Core Assurance Service Market (2025-2031) | Strategy, Consumer Insights, Analysis, Investment Trends, Opportunities, Growth, Size, Share, Industry, Revenue, Segments, Value, Segmentation, Supply, Forecast, Restraints, Outlook, Competition, Drivers, Trends, Demand, Pricing Analysis, Competitive, Strategic Insights, Companies, Challenges
- Romania Uninterruptible Power Supply (UPS) Market (2026-2032) | Industry, Analysis, Revenue, Size, Forecast, Outlook, Value, Trends, Share, Growth & Companies
- Saudi Arabia Car Window Tinting Film, Paint Protection Film (PPF), and Ceramic Coating Market (2025-2031) | Strategy, Consumer Insights, Analysis, Investment Trends, Opportunities, Growth, Size, Share, Industry, Revenue, Segments, Value, Segmentation, Supply, Forecast, Restraints, Outlook, Competition, Drivers, Trends, Demand, Pricing Analysis, Competitive, Strategic Insights, Companies, Challenges
- South Africa Stationery Market (2025-2031) | Share, Size, Industry, Value, Growth, Revenue, Analysis, Trends, Segmentation & Outlook
- Afghanistan Rocking Chairs And Adirondack Chairs Market (2026-2032) | Size & Revenue, Competitive Landscape, Share, Segmentation, Industry, Value, Outlook, Analysis, Trends, Growth, Forecast, Companies
- Afghanistan Apparel Market (2026-2032) | Growth, Outlook, Industry, Segmentation, Forecast, Size, Companies, Trends, Value, Share, Analysis & Revenue
Industry Events and Analyst Meet

EV tech India Expo 2026

Auto Tech Asia 2026

Battery Tech India 2026

Smart Production Solutions Guangzhou 2026

Stationery & Paper Expo Saudi Arabia 2026
Whitepaper
- Middle East & Africa Commercial Security Market Click here to view more.
- Middle East & Africa Fire Safety Systems & Equipment Market Click here to view more.
- GCC Drone Market Click here to view more.
- Middle East Lighting Fixture Market Click here to view more.
- GCC Physical & Perimeter Security Market Click here to view more.
6WResearch In News
- Doha a strategic location for EV manufacturing hub: IPA Qatar
- Demand for luxury TVs surging in the GCC, says Samsung
- Empowering Growth: The Thriving Journey of Bangladesh’s Cable Industry
- Demand for luxury TVs surging in the GCC, says Samsung
- Video call with a traditional healer? Once unthinkable, it’s now common in South Africa
- Intelligent Buildings To Smooth GCC’s Path To Net Zero