Croatia Casino Gaming Equipment Market (2025-2031) | Industry, Segmentation, Revenue, Growth, Forecast, Value, Size, Trends, Analysis, Companies, Share & Outlook
Market Forecast By Product Type (Slot Machines, Video Lottery Terminal, Video Poker Machines, Others), By Installation (Installed Inside Casino, Installed Outside Casino), By Mode Of Operation (Floor Mounted, Portable) And Competitive Landscape
| Product Code: ETC5031811 | Publication Date: Nov 2023 | Updated Date: Apr 2026 | Product Type: Market Research Report | |
| Publisher: 6Wresearch | Author: Sachin Kumar Rai | No. of Pages: 60 | No. of Figures: 30 | No. of Tables: 5 |
Croatia Casino Gaming Equipment Market Size (2020-2030)
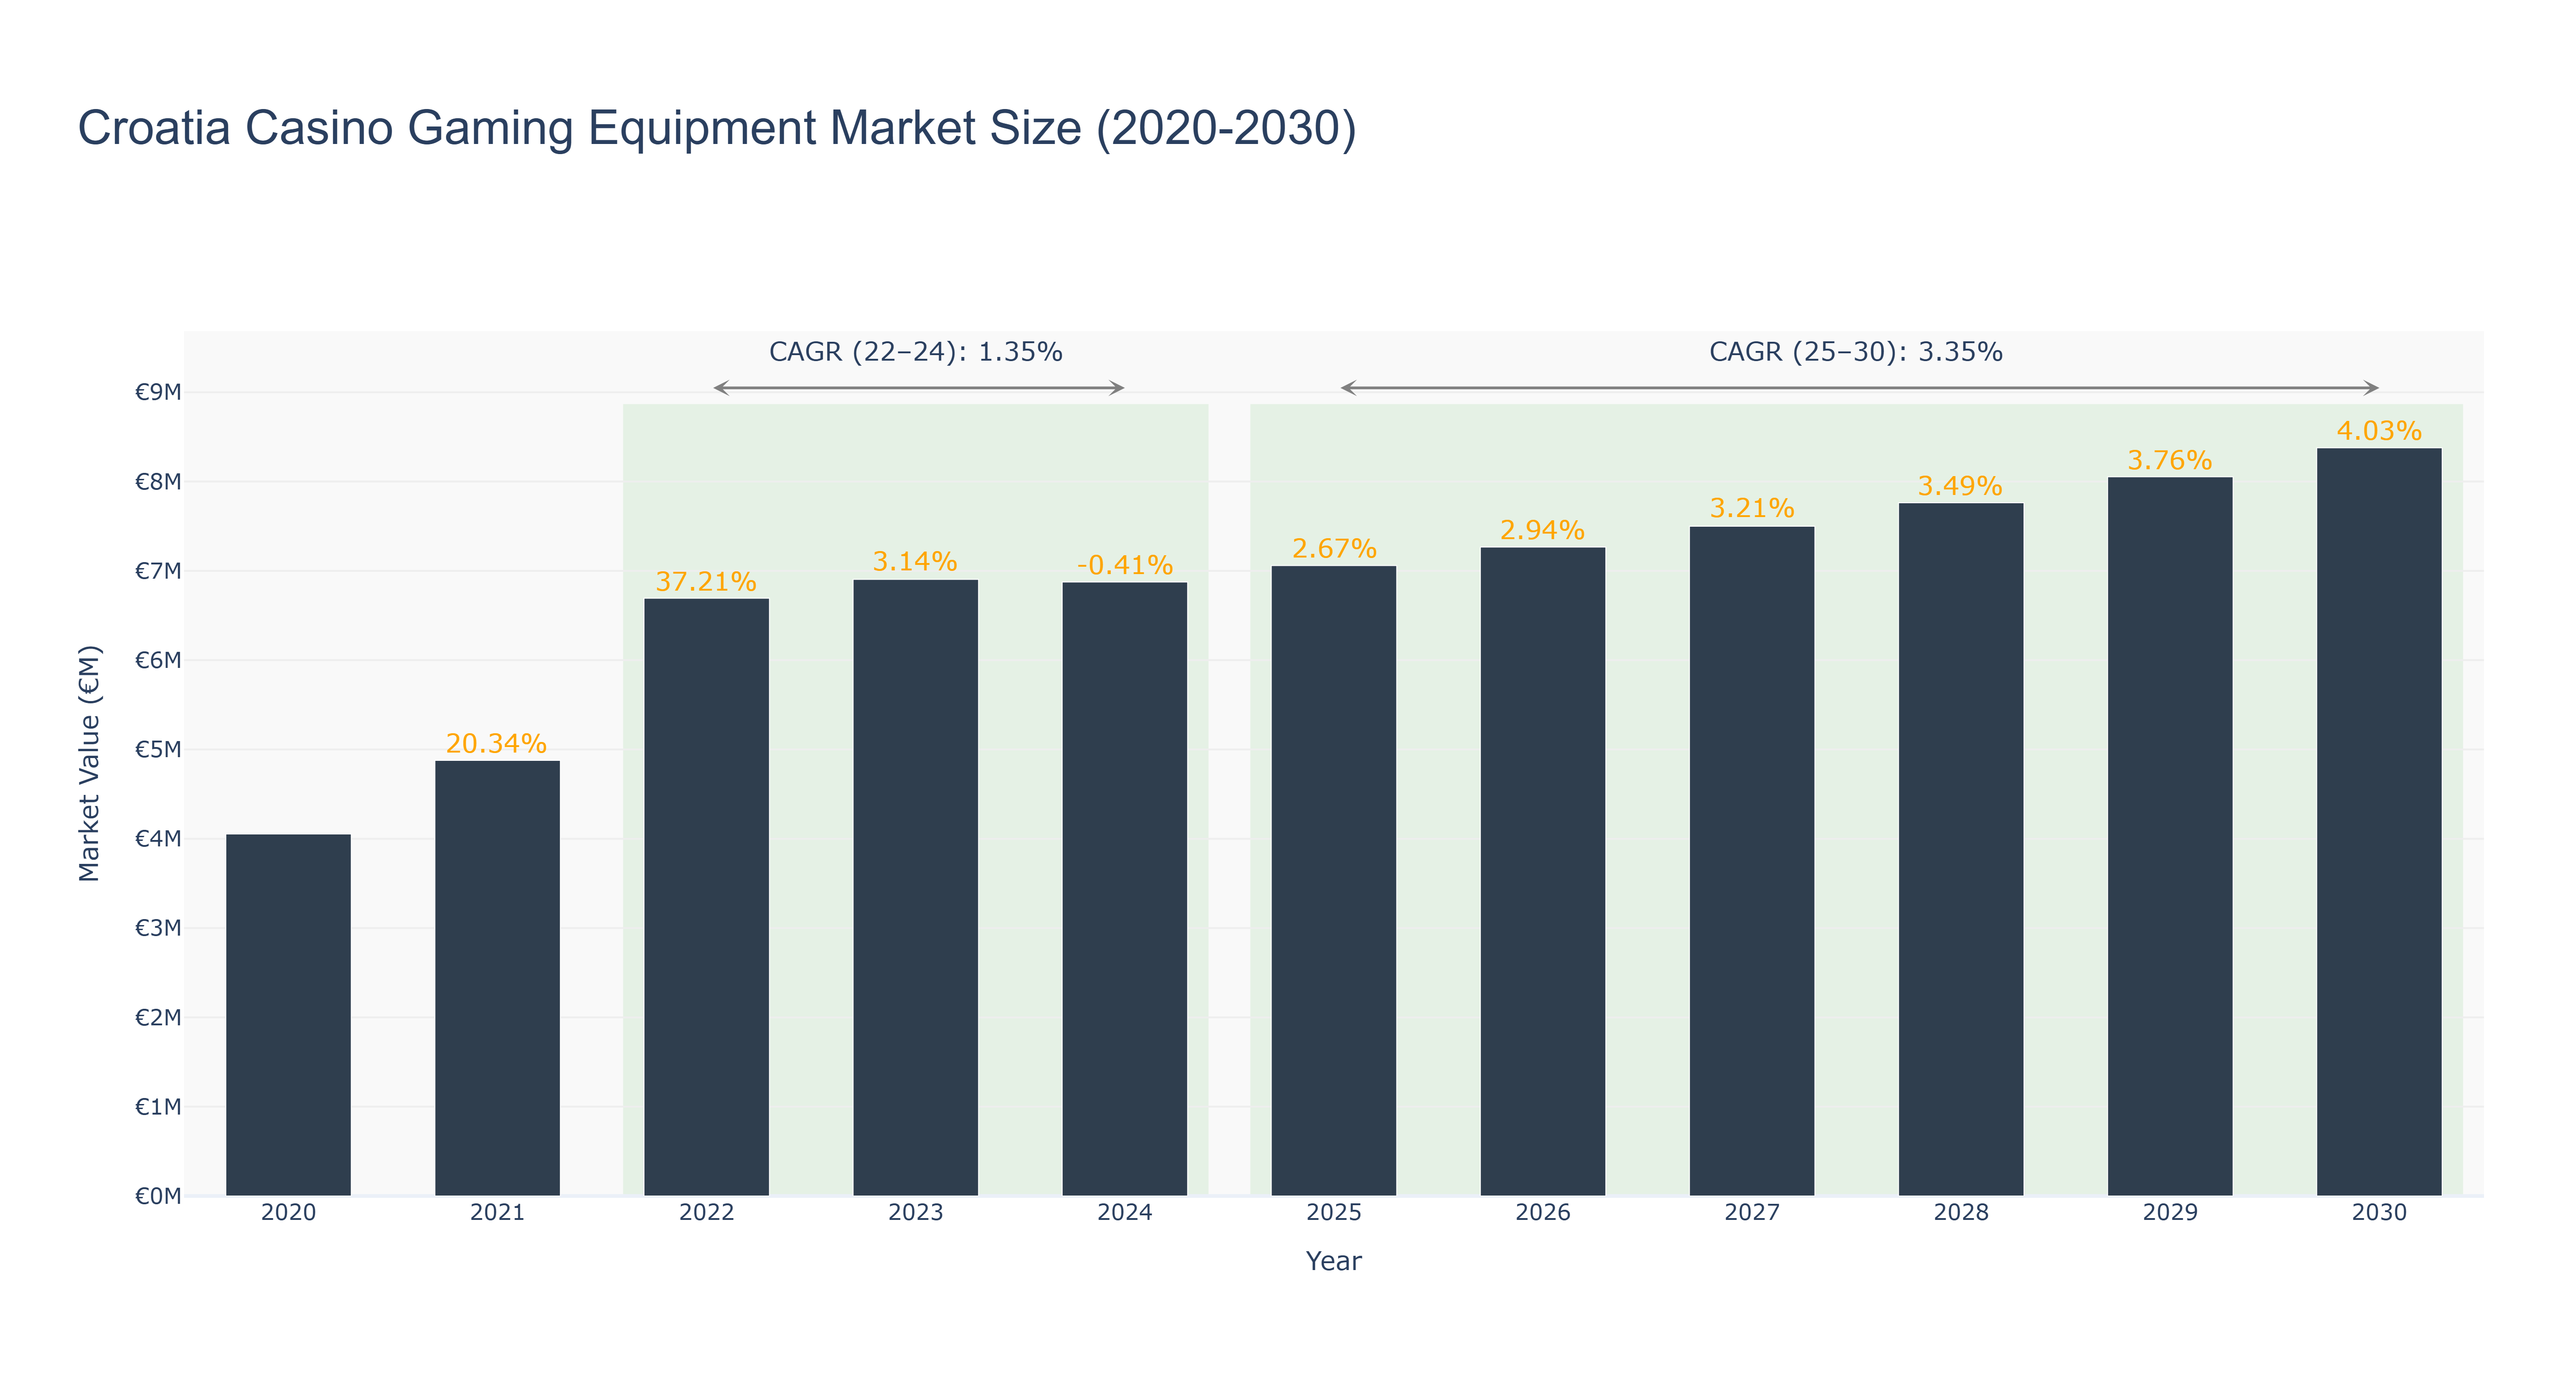
Croatia's Casino Gaming Equipment Market witnessed a steady growth trajectory from 2020 to 2024, with the market size reaching €6.88 million in 2024. However, a slight decline of -0.41% was observed in that year. From 2025 to 2030, the market is forecasted to continue its upward trend, with an expected market size of €8.38 million in 2030. The CAGR for the period 2022-24 stands at 1.35%, while the CAGR for 2025-30 is projected at 3.35%. The market's growth can be attributed to increasing tourism in Croatia, leading to a rise in casino visitors and demand for gaming equipment. Looking ahead, Croatia's Casino Gaming Equipment Market is set to benefit from upcoming infrastructure projects aimed at enhancing the country's tourism sector, thereby boosting the demand for casino gaming equipment.
Croatia Casino Gaming Equipment Market: Production & Trade Performance (2019-2025)
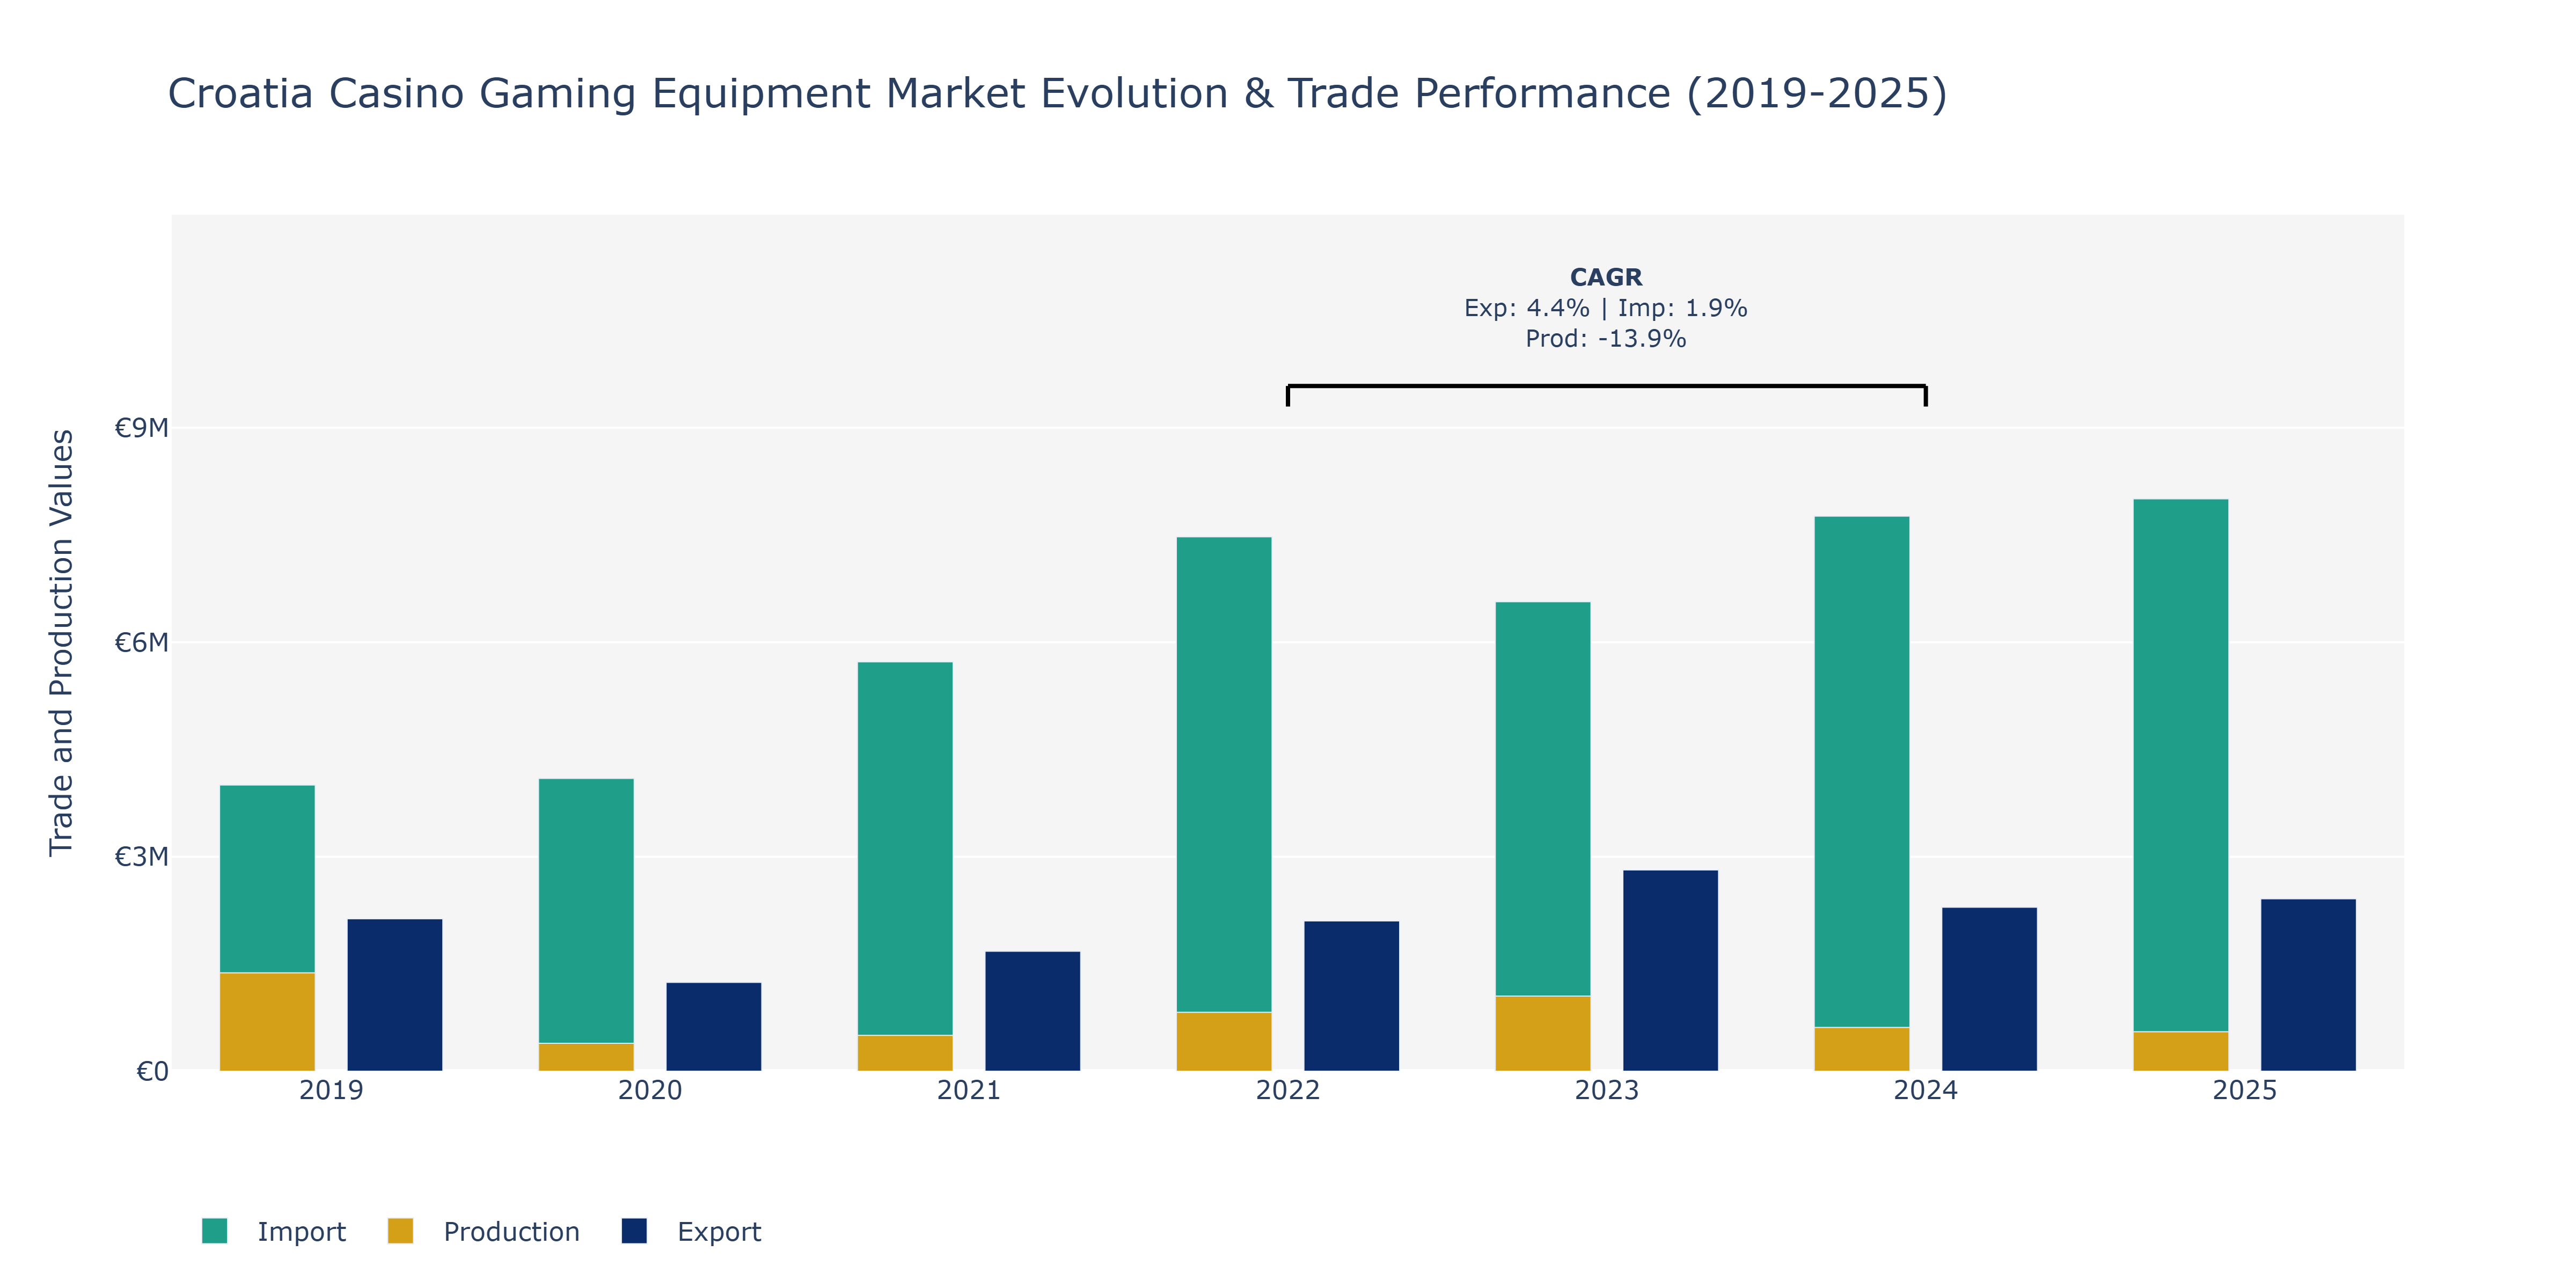
Between 2019 and 2025, Croatia's Casino Gaming Equipment Market saw notable shifts in exports, imports, and production. Exports peaked in 2023 at approximately €2.82 million, reflecting a substantial increase from the €2.13 million recorded in 2019. This growth can be attributed to enhanced market demand and potentially increased competitiveness of Croatian gaming equipment internationally. In contrast, imports steadily rose from €4 million in 2019 to around €8.01 million in 2025. The surge in imports suggests a growing appetite for foreign gaming technologies and equipment within Croatia. Production, on the other hand, experienced a sharp decline from €1.37 million in 2019 to approximately €552 million in 2025. This decrease could be due to factors such as changes in production strategies, technological advancements shifting manufacturing trends, or fluctuations in domestic demand. To maintain market competitiveness, Croatian manufacturers may need to focus on innovation and cost-efficiency to cater to evolving consumer preferences and global competition in the casino gaming equipment sector.
Croatia Casino Gaming Equipment Market Overview
The casino gaming equipment market in Croatia is closely tied to the countrys tourism and entertainment industries. With a rising number of casinos, the demand for gaming tables, slot machines, and electronic systems continues to grow.
Drivers of the market
The casino gaming equipment market in Croatia is driven by the growing popularity of gambling and entertainment tourism. The demand for advanced gaming technology, including slot machines and electronic gaming tables, is increasing as casinos seek to attract more visitors.
Challenges of the market
The casino gaming equipment market in Croatia faces challenges related to regulatory compliance and market competition. The industry must adhere to strict regulations related to gaming equipment standards and operations, which can increase operational costs. Additionally, the market is highly competitive, with numerous players offering similar products, impacting pricing and market share. Ensuring equipment reliability and compliance with regulations while managing costs and differentiating from competitors are key challenges for the industry.
Government Policy of the market
Regulations on gaming and gambling in Croatia influence the casino gaming equipment market. The government enforces strict licensing and compliance requirements to ensure fair play and regulatory adherence in the gaming industry.
Key Highlights of the Report:
- Croatia Casino Gaming Equipment Market Outlook
- Market Size of Croatia Casino Gaming Equipment Market, 2024
- Forecast of Croatia Casino Gaming Equipment Market, 2031
- Historical Data and Forecast of Croatia Casino Gaming Equipment Revenues & Volume for the Period 2021-2031
- Croatia Casino Gaming Equipment Market Trend Evolution
- Croatia Casino Gaming Equipment Market Drivers and Challenges
- Croatia Casino Gaming Equipment Price Trends
- Croatia Casino Gaming Equipment Porter`s Five Forces
- Croatia Casino Gaming Equipment Industry Life Cycle
- Historical Data and Forecast of Croatia Casino Gaming Equipment Market Revenues & Volume By Product Type for the Period 2021-2031
- Historical Data and Forecast of Croatia Casino Gaming Equipment Market Revenues & Volume By Slot Machines for the Period 2021-2031
- Historical Data and Forecast of Croatia Casino Gaming Equipment Market Revenues & Volume By Video Lottery Terminal for the Period 2021-2031
- Historical Data and Forecast of Croatia Casino Gaming Equipment Market Revenues & Volume By Video Poker Machines for the Period 2021-2031
- Historical Data and Forecast of Croatia Casino Gaming Equipment Market Revenues & Volume By Others for the Period 2021-2031
- Historical Data and Forecast of Croatia Casino Gaming Equipment Market Revenues & Volume By Installation for the Period 2021-2031
- Historical Data and Forecast of Croatia Casino Gaming Equipment Market Revenues & Volume By Installed Inside Casino for the Period 2021-2031
- Historical Data and Forecast of Croatia Casino Gaming Equipment Market Revenues & Volume By Installed Outside Casino for the Period 2021-2031
- Historical Data and Forecast of Croatia Casino Gaming Equipment Market Revenues & Volume By Mode Of Operation for the Period 2021-2031
- Historical Data and Forecast of Croatia Casino Gaming Equipment Market Revenues & Volume By Floor Mounted for the Period 2021-2031
- Historical Data and Forecast of Croatia Casino Gaming Equipment Market Revenues & Volume By Portable for the Period 2021-2031
- Croatia Casino Gaming Equipment Import Export Trade Statistics
- Market Opportunity Assessment By Product Type
- Market Opportunity Assessment By Installation
- Market Opportunity Assessment By Mode Of Operation
- Croatia Casino Gaming Equipment Top Companies Market Share
- Croatia Casino Gaming Equipment Competitive Benchmarking By Technical and Operational Parameters
- Croatia Casino Gaming Equipment Company Profiles
- Croatia Casino Gaming Equipment Key Strategic Recommendations
Frequently Asked Questions About the Market Study (FAQs):
6Wresearch actively monitors the Croatia Casino Gaming Equipment Market and publishes its comprehensive annual report, highlighting emerging trends, growth drivers, revenue analysis, and forecast outlook. Our insights help businesses to make data-backed strategic decisions with ongoing market dynamics. Our analysts track relevent industries related to the Croatia Casino Gaming Equipment Market, allowing our clients with actionable intelligence and reliable forecasts tailored to emerging regional needs.
Yes, we provide customisation as per your requirements. To learn more, feel free to contact us on sales@6wresearch.com
1 Executive Summary |
2 Introduction |
2.1 Key Highlights of the Report |
2.2 Report Description |
2.3 Market Scope & Segmentation |
2.4 Research Methodology |
2.5 Assumptions |
3 Croatia Casino Gaming Equipment Market Overview |
3.1 Croatia Country Macro Economic Indicators |
3.2 Croatia Casino Gaming Equipment Market Revenues & Volume, 2021 & 2031F |
3.3 Croatia Casino Gaming Equipment Market - Industry Life Cycle |
3.4 Croatia Casino Gaming Equipment Market - Porter's Five Forces |
3.5 Croatia Casino Gaming Equipment Market Revenues & Volume Share, By Product Type, 2021 & 2031F |
3.6 Croatia Casino Gaming Equipment Market Revenues & Volume Share, By Installation, 2021 & 2031F |
3.7 Croatia Casino Gaming Equipment Market Revenues & Volume Share, By Mode Of Operation, 2021 & 2031F |
4 Croatia Casino Gaming Equipment Market Dynamics |
4.1 Impact Analysis |
4.2 Market Drivers |
4.2.1 Growing tourism industry in Croatia, attracting more visitors to casinos and increasing demand for gaming equipment. |
4.2.2 Favorable regulations and policies supporting the development and expansion of the casino gaming industry in Croatia. |
4.2.3 Rising disposable income of the population leading to increased spending on leisure activities like casino gaming. |
4.3 Market Restraints |
4.3.1 High competition among casino operators in Croatia leading to pricing pressures on gaming equipment suppliers. |
4.3.2 Economic instability in the region impacting consumer spending on entertainment and leisure activities. |
5 Croatia Casino Gaming Equipment Market Trends |
6 Croatia Casino Gaming Equipment Market Segmentations |
6.1 Croatia Casino Gaming Equipment Market, By Product Type |
6.1.1 Overview and Analysis |
6.1.2 Croatia Casino Gaming Equipment Market Revenues & Volume, By Slot Machines, 2021-2031F |
6.1.3 Croatia Casino Gaming Equipment Market Revenues & Volume, By Video Lottery Terminal, 2021-2031F |
6.1.4 Croatia Casino Gaming Equipment Market Revenues & Volume, By Video Poker Machines, 2021-2031F |
6.1.5 Croatia Casino Gaming Equipment Market Revenues & Volume, By Others, 2021-2031F |
6.2 Croatia Casino Gaming Equipment Market, By Installation |
6.2.1 Overview and Analysis |
6.2.2 Croatia Casino Gaming Equipment Market Revenues & Volume, By Installed Inside Casino, 2021-2031F |
6.2.3 Croatia Casino Gaming Equipment Market Revenues & Volume, By Installed Outside Casino, 2021-2031F |
6.3 Croatia Casino Gaming Equipment Market, By Mode Of Operation |
6.3.1 Overview and Analysis |
6.3.2 Croatia Casino Gaming Equipment Market Revenues & Volume, By Floor Mounted, 2021-2031F | 6.3.3 Croatia Casino Gaming Equipment Market Revenues & Volume, By Portable, 2021-2031F |
7 Croatia Casino Gaming Equipment Market Import-Export Trade Statistics |
7.1 Croatia Casino Gaming Equipment Market Export to Major Countries |
7.2 Croatia Casino Gaming Equipment Market Imports from Major Countries |
8 Croatia Casino Gaming Equipment Market Key Performance Indicators |
8.1 Average revenue per user (ARPU) for casino gaming equipment. |
8.2 Percentage of casinos investing in new gaming technologies. |
8.3 Rate of adoption of innovative gaming equipment solutions by Croatian casinos. |
9 Croatia Casino Gaming Equipment Market - Opportunity Assessment |
9.1 Croatia Casino Gaming Equipment Market Opportunity Assessment, By Product Type, 2021 & 2031F |
9.2 Croatia Casino Gaming Equipment Market Opportunity Assessment, By Installation, 2021 & 2031F |
9.3 Croatia Casino Gaming Equipment Market Opportunity Assessment, By Mode Of Operation, 2021 & 2031F |
10 Croatia Casino Gaming Equipment Market - Competitive Landscape |
10.1 Croatia Casino Gaming Equipment Market Revenue Share, By Companies, 2024 |
10.2 Croatia Casino Gaming Equipment Market Competitive Benchmarking, By Operating and Technical Parameters |
11 Company Profiles |
12 Recommendations | 13 Disclaimer |
Global Go To Market Strategy - 2030
Export potential enables firms to identify high-growth global markets with greater confidence by combining advanced trade intelligence with a structured quantitative methodology. The framework analyzes emerging demand trends and country-level import patterns while integrating macroeconomic and trade datasets such as GDP and population forecasts, bilateral import–export flows, tariff structures, elasticity differentials between developed and developing economies, geographic distance, and import demand projections. Using weighted trade values from 2020–2024 as the base period to project country-to-country export potential for 2030, these inputs are operationalized through calculated drivers such as gravity model parameters, tariff impact factors, and projected GDP per-capita growth. Through an analysis of hidden potentials, demand hotspots, and market conditions that are most favorable to success, this method enables firms to focus on target countries, maximize returns, and global expansion with data, backed by accuracy.
By factoring in the projected importer demand gap that is currently unmet and could be potential opportunity, it identifies the potential for the Exporter (Country) among 190 countries, against the general trade analysis, which identifies the biggest importer or exporter.
To discover high-growth global markets and optimize your business strategy:
Click Here
Pricing
- Single User License$ 1,995
- Department License$ 2,400
- Site License$ 3,120
- Global License$ 3,795

Leadership Perspectives from Industry Events
Search
Thought Leadership and Analyst Meet


Our Clients
6WResearch In News
- India Air Conditioner Market Set for Strong Rebound in 2026 After Weather-Led Correction and GST-Driven Recovery: 6Wresearch
- ADAS in India: How Automatic Emergency Braking, Blind Spot Detection & Driver Monitoring are Transforming Road Safety
- Doha a strategic location for EV manufacturing hub: IPA Qatar
- Demand for luxury TVs surging in the GCC, says Samsung
- Empowering Growth: The Thriving Journey of Bangladesh’s Cable Industry
- Demand for luxury TVs surging in the GCC, says Samsung
Latest Reports
- Nicaragua RPG Gaming Market (2026-2032)
- New Zealand RPG Gaming Market (2026-2032)
- Netherlands RPG Gaming Market (2026-2032)
- Nauru RPG Gaming Market (2026-2032)
- Namibia RPG Gaming Market (2026-2032)
- Mozambique RPG Gaming Market (2026-2032)
- Montenegro RPG Gaming Market (2026-2032)
- Mongolia RPG Gaming Market (2026-2032)
- Monaco RPG Gaming Market (2026-2032)
- Micronesia RPG Gaming Market (2026-2032)
Industry Events and Analyst Meet

HIMTEX 2026

India Refining Summit 2026

India EV Show 2026

EV tech India Expo 2026

Auto Tech Asia 2026
Whitepaper
- Middle East & Africa Commercial Security Market Click here to view more.
- Middle East & Africa Fire Safety Systems & Equipment Market Click here to view more.
- GCC Drone Market Click here to view more.
- Middle East Lighting Fixture Market Click here to view more.
- GCC Physical & Perimeter Security Market Click here to view more.