Croatia Stuffed Animals And Plush Toys Market (2026-2032) | Outlook, Industry, Companies, Segmentation, Competitive Landscape, Growth, Value, Trends, Share, Analysis, Size & Revenue, Forecast
Market Forecast By Product (Stuffed Animals, Cartoon Toys, Action Figures, Others), By Distribution Channel (Online, Offline) And Competitive Landscape
| Product Code: ETC6862599 | Publication Date: Sep 2024 | Updated Date: Apr 2026 | Product Type: Market Research Report | |
| Publisher: 6Wresearch | Author: Summon Dutta | No. of Pages: 75 | No. of Figures: 35 | No. of Tables: 20 |
Croatia Stuffed Animals And Plush Toys Market Size (2020-2030)
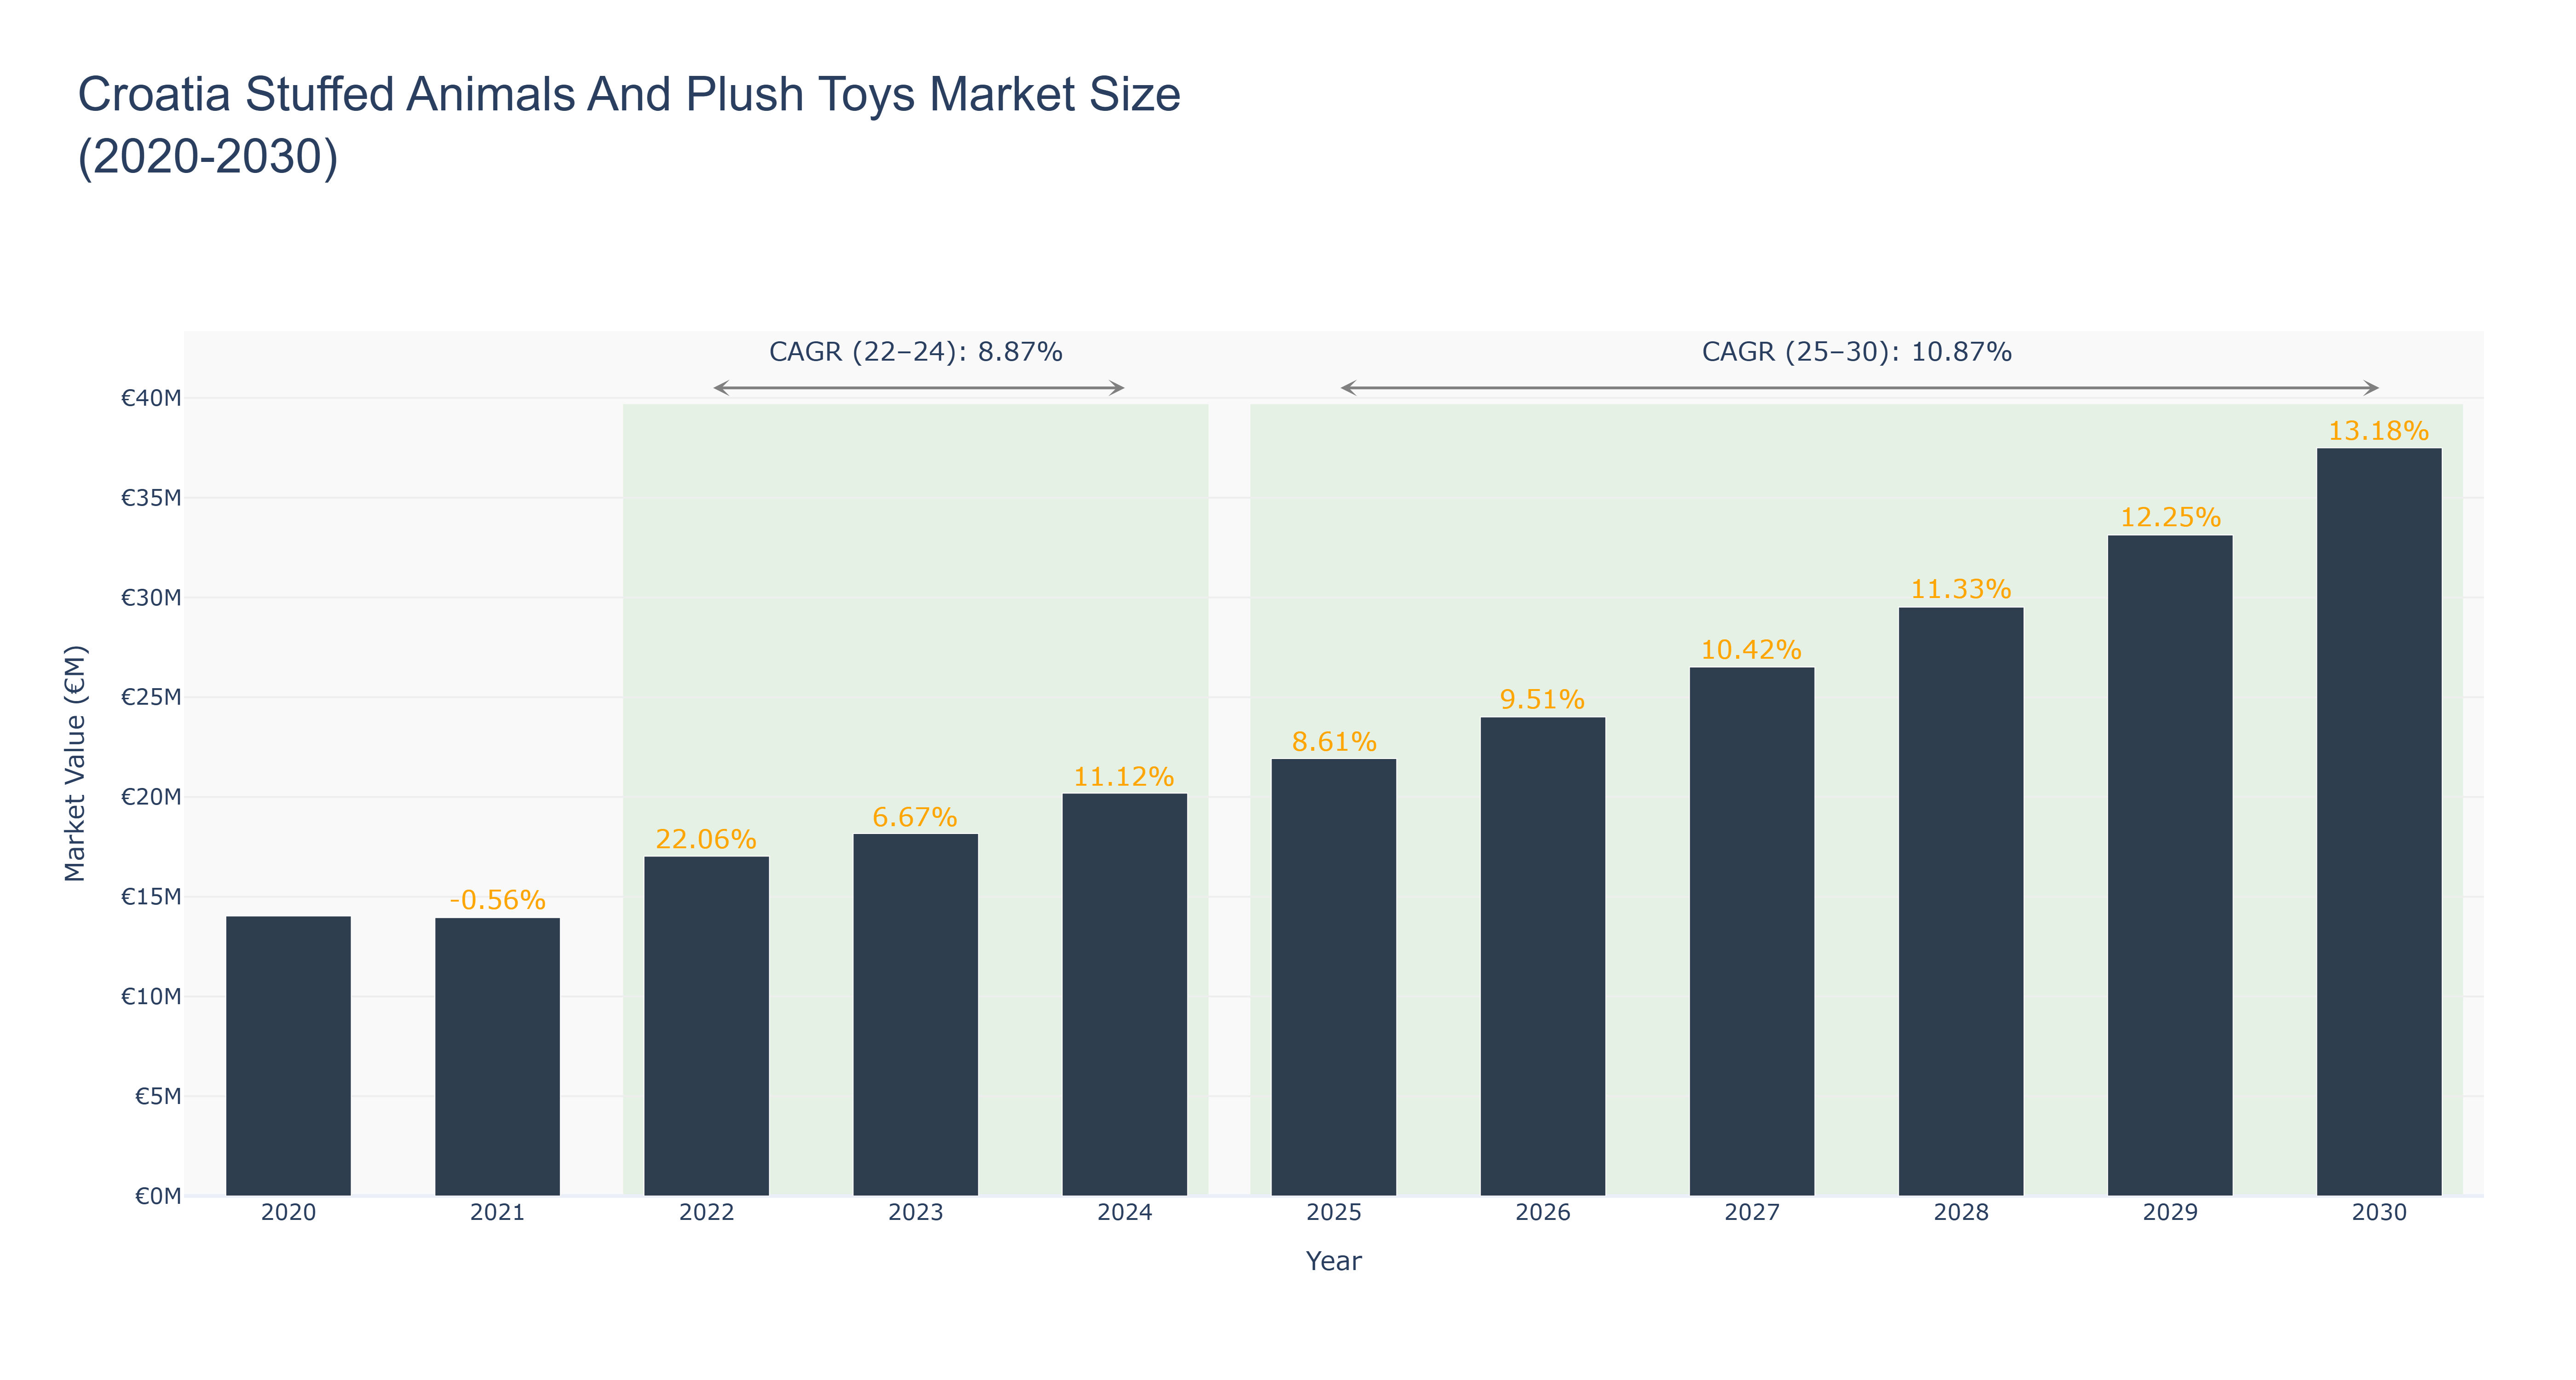
The Croatia Stuffed Animals And Plush Toys Market experienced steady growth from 2020 to 2024, reaching a peak market size of €20.19 million in 2024. The market is forecasted to continue its upward trajectory, with an estimated market size of €37.50 million in 2030. The CAGR for the period 2022-24 was 8.87%, showing a healthy expansion, while the CAGR for 2025-30 is projected at 10.87%. The market's growth can be attributed to increasing disposable income levels, growing demand for unique and personalized products, and a rise in the popularity of collectible toys. Looking ahead, Croatia is set to launch a national campaign promoting locally-made plush toys, aiming to boost domestic production and support local artisans. Industry drivers include consumer preferences shifting towards sustainable and eco-friendly toys, innovative product designs, and the rise of e-commerce platforms facilitating easier access to a wider range of products.
Croatia Stuffed Animals And Plush Toys Market: Production & Trade Performance (2019-2025)
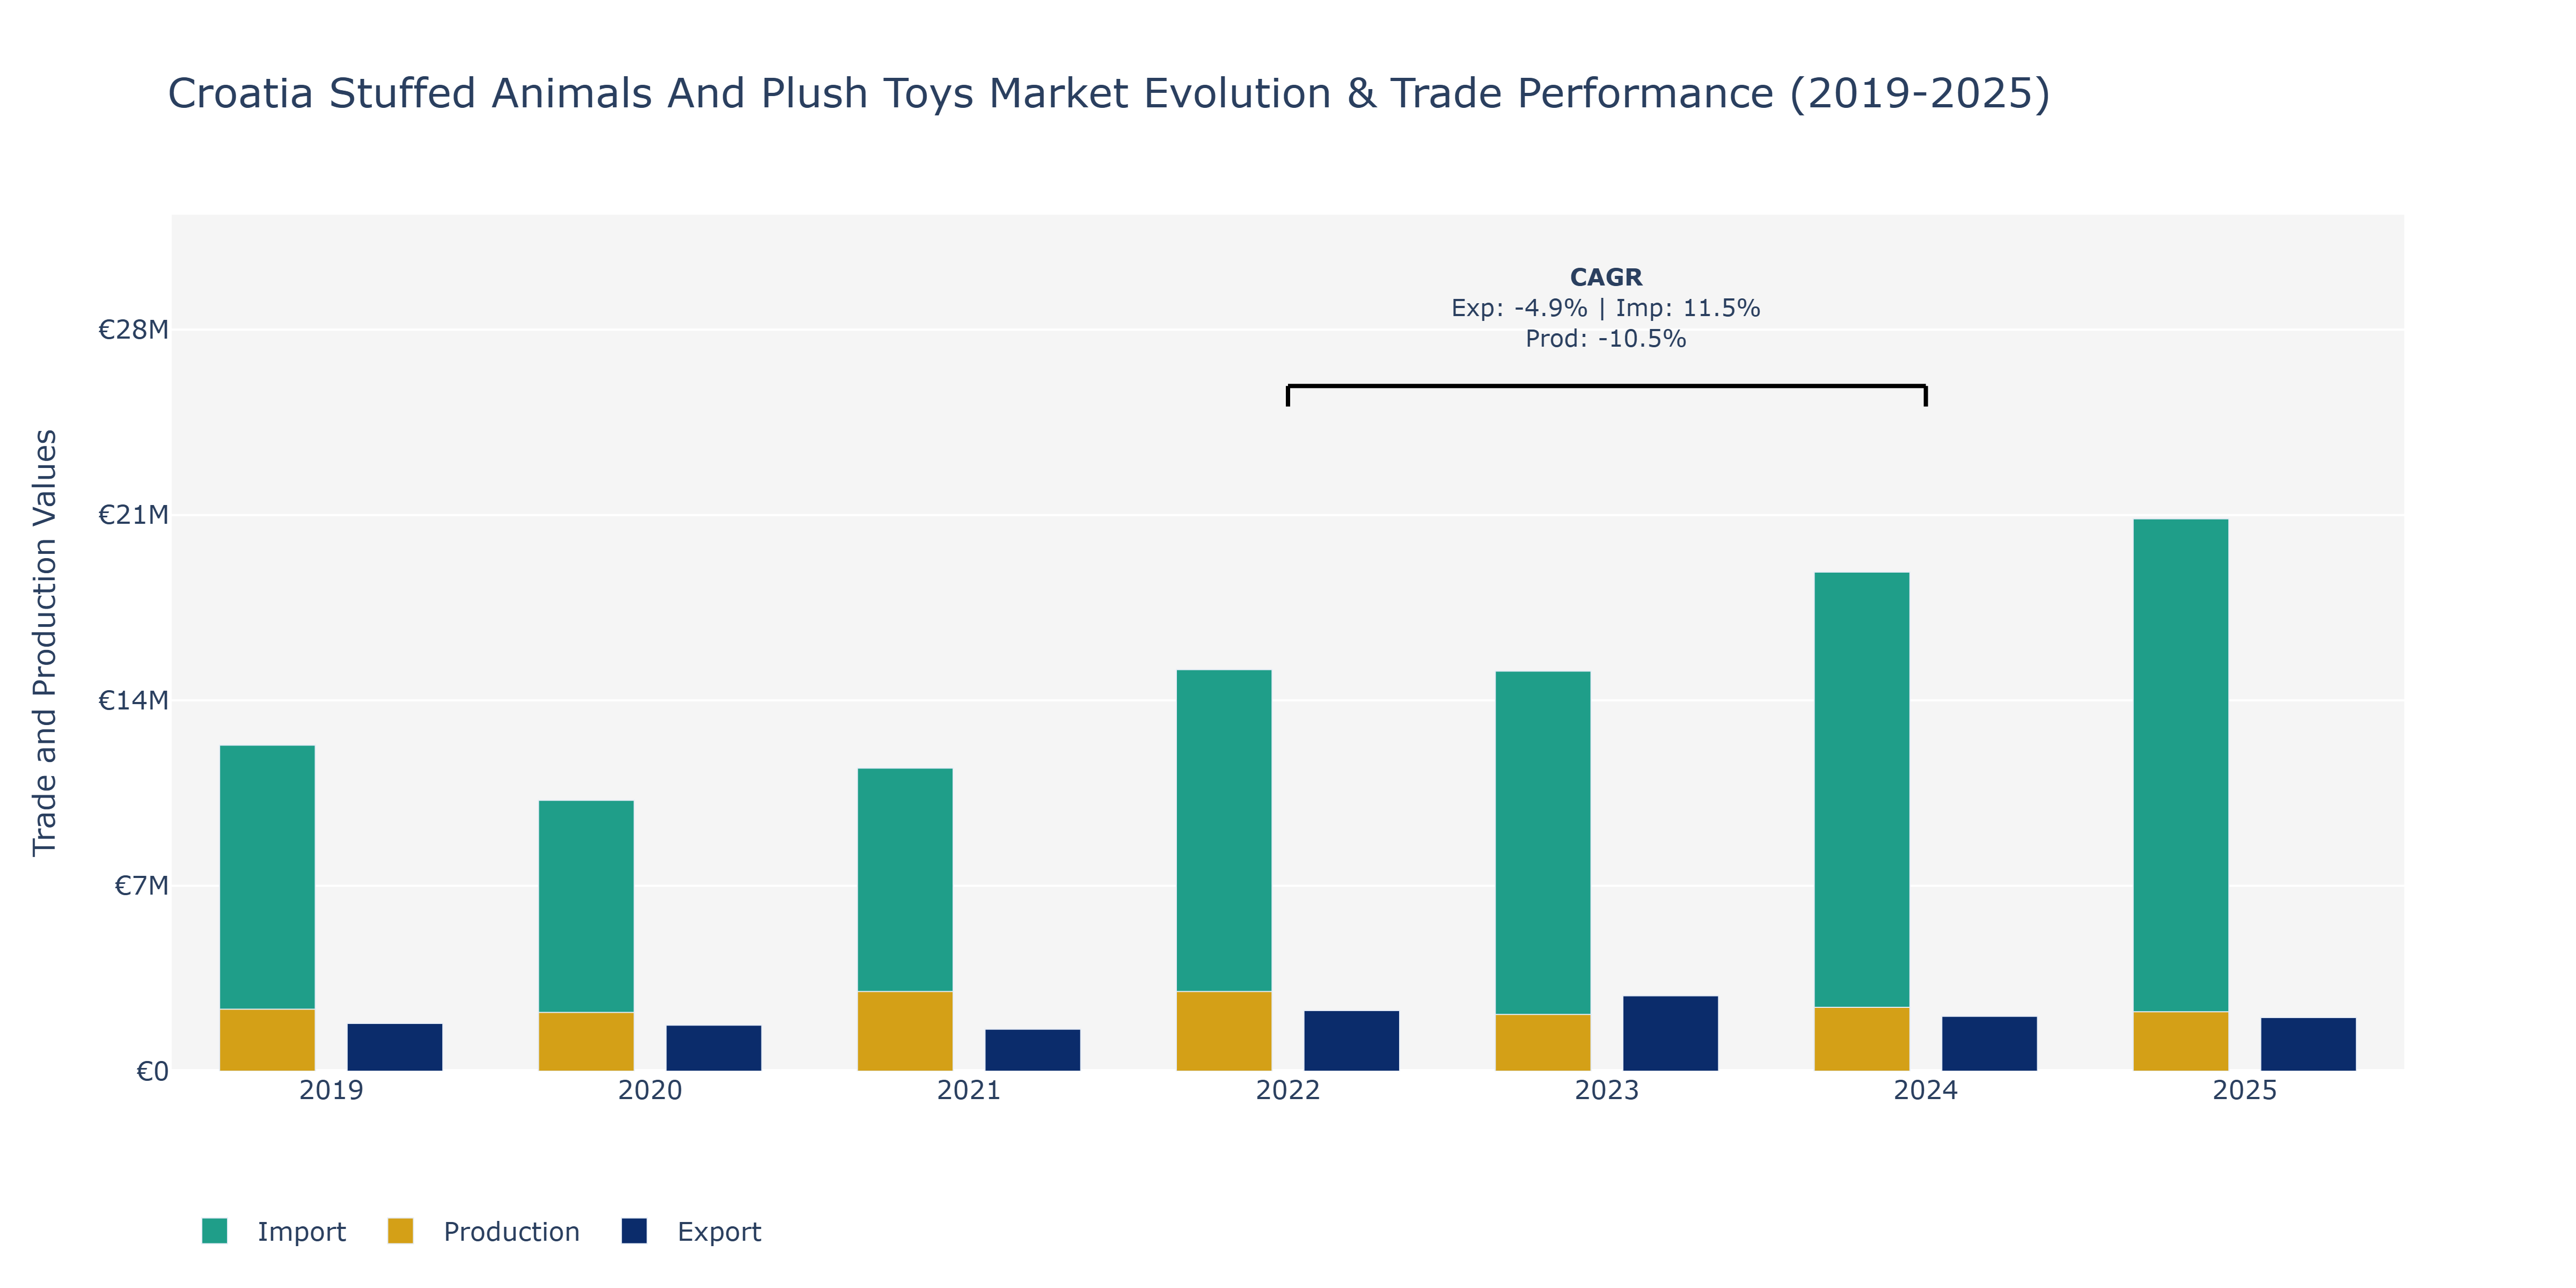
In the Croatia Stuffed Animals and Plush Toys Market, exports demonstrated varying performances from 2019 to 2025, with a peak in 2023 at €2.85 million, followed by a slight decrease in 2024 and 2025. Imports consistently increased year on year, reaching €20.86 million in 2025, showcasing a significant upward trend. Production, however, experienced fluctuations, with a notable spike in 2021 at €3.01 million, followed by a decline in subsequent years. The increase in imports could be attributed to rising consumer demand for diverse product offerings, potentially due to increased disposable income levels in the region. The fluctuations in production might be influenced by supply chain disruptions, impacting manufacturing capabilities and output levels. To sustain market competitiveness, local manufacturers could focus on enhancing production efficiency and product innovation to meet evolving consumer preferences and maintain a strong position in the global market.
Key Highlights of the Report:
- Croatia Stuffed Animals And Plush Toys Market Outlook
- Market Size of Croatia Stuffed Animals And Plush Toys Market, 2025
- Forecast of Croatia Stuffed Animals And Plush Toys Market, 2032
- Historical Data and Forecast of Croatia Stuffed Animals And Plush Toys Revenues & Volume for the Period 2022 - 2032
- Croatia Stuffed Animals And Plush Toys Market Trend Evolution
- Croatia Stuffed Animals And Plush Toys Market Drivers and Challenges
- Croatia Stuffed Animals And Plush Toys Price Trends
- Croatia Stuffed Animals And Plush Toys Porter's Five Forces
- Croatia Stuffed Animals And Plush Toys Industry Life Cycle
- Historical Data and Forecast of Croatia Stuffed Animals And Plush Toys Market Revenues & Volume By Product for the Period 2022 - 2032
- Historical Data and Forecast of Croatia Stuffed Animals And Plush Toys Market Revenues & Volume By Stuffed Animals for the Period 2022 - 2032
- Historical Data and Forecast of Croatia Stuffed Animals And Plush Toys Market Revenues & Volume By Cartoon Toys for the Period 2022 - 2032
- Historical Data and Forecast of Croatia Stuffed Animals And Plush Toys Market Revenues & Volume By Action Figures for the Period 2022 - 2032
- Historical Data and Forecast of Croatia Stuffed Animals And Plush Toys Market Revenues & Volume By Others for the Period 2022 - 2032
- Historical Data and Forecast of Croatia Stuffed Animals And Plush Toys Market Revenues & Volume By Distribution Channel for the Period 2022 - 2032
- Historical Data and Forecast of Croatia Stuffed Animals And Plush Toys Market Revenues & Volume By Online for the Period 2022 - 2032
- Historical Data and Forecast of Croatia Stuffed Animals And Plush Toys Market Revenues & Volume By Offline for the Period 2022 - 2032
- Croatia Stuffed Animals And Plush Toys Import Export Trade Statistics
- Market Opportunity Assessment By Product
- Market Opportunity Assessment By Distribution Channel
- Croatia Stuffed Animals And Plush Toys Top Companies Market Share
- Croatia Stuffed Animals And Plush Toys Competitive Benchmarking By Technical and Operational Parameters
- Croatia Stuffed Animals And Plush Toys Company Profiles
- Croatia Stuffed Animals And Plush Toys Key Strategic Recommendations
Frequently Asked Questions About the Market Study (FAQs):
6Wresearch actively monitors the Croatia Stuffed Animals And Plush Toys Market and publishes its comprehensive annual report, highlighting emerging trends, growth drivers, revenue analysis, and forecast outlook. Our insights help businesses to make data-backed strategic decisions with ongoing market dynamics. Our analysts track relevent industries related to the Croatia Stuffed Animals And Plush Toys Market, allowing our clients with actionable intelligence and reliable forecasts tailored to emerging regional needs.
Yes, we provide customisation as per your requirements. To learn more, feel free to contact us on sales@6wresearch.com
1 Executive Summary |
2 Introduction |
2.1 Key Highlights of the Report |
2.2 Report Description |
2.3 Market Scope & Segmentation |
2.4 Research Methodology |
2.5 Assumptions |
3 Croatia Stuffed Animals And Plush Toys Market Overview |
3.1 Croatia Country Macro Economic Indicators |
3.2 Croatia Stuffed Animals And Plush Toys Market Revenues & Volume, 2022 & 2032F |
3.3 Croatia Stuffed Animals And Plush Toys Market - Industry Life Cycle |
3.4 Croatia Stuffed Animals And Plush Toys Market - Porter's Five Forces |
3.5 Croatia Stuffed Animals And Plush Toys Market Revenues & Volume Share, By Product, 2022 & 2032F |
3.6 Croatia Stuffed Animals And Plush Toys Market Revenues & Volume Share, By Distribution Channel, 2022 & 2032F |
4 Croatia Stuffed Animals And Plush Toys Market Dynamics |
4.1 Impact Analysis |
4.2 Market Drivers |
4.2.1 Growing popularity of stuffed animals and plush toys among children and adults in Croatia |
4.2.2 Increasing disposable income leading to higher spending on non-essential items like toys |
4.2.3 Innovation in product design and materials to enhance the appeal of stuffed animals and plush toys |
4.3 Market Restraints |
4.3.1 Competition from electronic toys and digital entertainment products |
4.3.2 Fluctuations in raw material prices impacting production costs |
4.3.3 Seasonality of demand, with peak sales during holidays and special occasions |
5 Croatia Stuffed Animals And Plush Toys Market Trends |
6 Croatia Stuffed Animals And Plush Toys Market, By Types |
6.1 Croatia Stuffed Animals And Plush Toys Market, By Product |
6.1.1 Overview and Analysis |
6.1.2 Croatia Stuffed Animals And Plush Toys Market Revenues & Volume, By Product, 2022 - 2032F |
6.1.3 Croatia Stuffed Animals And Plush Toys Market Revenues & Volume, By Stuffed Animals, 2022 - 2032F |
6.1.4 Croatia Stuffed Animals And Plush Toys Market Revenues & Volume, By Cartoon Toys, 2022 - 2032F |
6.1.5 Croatia Stuffed Animals And Plush Toys Market Revenues & Volume, By Action Figures, 2022 - 2032F |
6.1.6 Croatia Stuffed Animals And Plush Toys Market Revenues & Volume, By Others, 2022 - 2032F |
6.2 Croatia Stuffed Animals And Plush Toys Market, By Distribution Channel |
6.2.1 Overview and Analysis |
6.2.2 Croatia Stuffed Animals And Plush Toys Market Revenues & Volume, By Online, 2022 - 2032F |
6.2.3 Croatia Stuffed Animals And Plush Toys Market Revenues & Volume, By Offline, 2022 - 2032F |
7 Croatia Stuffed Animals And Plush Toys Market Import-Export Trade Statistics |
7.1 Croatia Stuffed Animals And Plush Toys Market Export to Major Countries |
7.2 Croatia Stuffed Animals And Plush Toys Market Imports from Major Countries |
8 Croatia Stuffed Animals And Plush Toys Market Key Performance Indicators |
8.1 Social media engagement and online presence of key market players |
8.2 Customer satisfaction and retention rates |
8.3 Number of new product launches and innovations |
8.4 Trends in consumer preferences and demand for specific types of stuffed animals and plush toys |
8.5 Adoption of eco-friendly practices and materials in production |
9 Croatia Stuffed Animals And Plush Toys Market - Opportunity Assessment |
9.1 Croatia Stuffed Animals And Plush Toys Market Opportunity Assessment, By Product, 2022 & 2032F |
9.2 Croatia Stuffed Animals And Plush Toys Market Opportunity Assessment, By Distribution Channel, 2022 & 2032F |
10 Croatia Stuffed Animals And Plush Toys Market - Competitive Landscape |
10.1 Croatia Stuffed Animals And Plush Toys Market Revenue Share, By Companies, 2025 |
10.2 Croatia Stuffed Animals And Plush Toys Market Competitive Benchmarking, By Operating and Technical Parameters |
11 Company Profiles |
12 Recommendations |
13 Disclaimer |
Global Go To Market Strategy - 2030
Export potential enables firms to identify high-growth global markets with greater confidence by combining advanced trade intelligence with a structured quantitative methodology. The framework analyzes emerging demand trends and country-level import patterns while integrating macroeconomic and trade datasets such as GDP and population forecasts, bilateral import–export flows, tariff structures, elasticity differentials between developed and developing economies, geographic distance, and import demand projections. Using weighted trade values from 2020–2024 as the base period to project country-to-country export potential for 2030, these inputs are operationalized through calculated drivers such as gravity model parameters, tariff impact factors, and projected GDP per-capita growth. Through an analysis of hidden potentials, demand hotspots, and market conditions that are most favorable to success, this method enables firms to focus on target countries, maximize returns, and global expansion with data, backed by accuracy.
By factoring in the projected importer demand gap that is currently unmet and could be potential opportunity, it identifies the potential for the Exporter (Country) among 190 countries, against the general trade analysis, which identifies the biggest importer or exporter.
To discover high-growth global markets and optimize your business strategy:
Click Here
Pricing
- Single User License$ 1,995
- Department License$ 2,400
- Site License$ 3,120
- Global License$ 3,795

Leadership Perspectives from Industry Events
Search
Thought Leadership and Analyst Meet


Our Clients
6WResearch In News
- India Air Conditioner Market Set for Strong Rebound in 2026 After Weather-Led Correction and GST-Driven Recovery: 6Wresearch
- ADAS in India: How Automatic Emergency Braking, Blind Spot Detection & Driver Monitoring are Transforming Road Safety
- Doha a strategic location for EV manufacturing hub: IPA Qatar
- Demand for luxury TVs surging in the GCC, says Samsung
- Empowering Growth: The Thriving Journey of Bangladesh’s Cable Industry
- Demand for luxury TVs surging in the GCC, says Samsung
Latest Reports
- Nicaragua RPG Gaming Market (2026-2032)
- New Zealand RPG Gaming Market (2026-2032)
- Netherlands RPG Gaming Market (2026-2032)
- Nauru RPG Gaming Market (2026-2032)
- Namibia RPG Gaming Market (2026-2032)
- Mozambique RPG Gaming Market (2026-2032)
- Montenegro RPG Gaming Market (2026-2032)
- Mongolia RPG Gaming Market (2026-2032)
- Monaco RPG Gaming Market (2026-2032)
- Micronesia RPG Gaming Market (2026-2032)
Industry Events and Analyst Meet

EV India Expo 2026

HIMTEX 2026

India Refining Summit 2026

India EV Show 2026

EV tech India Expo 2026
Whitepaper
- Middle East & Africa Commercial Security Market Click here to view more.
- Middle East & Africa Fire Safety Systems & Equipment Market Click here to view more.
- GCC Drone Market Click here to view more.
- Middle East Lighting Fixture Market Click here to view more.
- GCC Physical & Perimeter Security Market Click here to view more.