El Salvador Clay Market (2025-2031) | Forecast, Companies, Size, Trends, Share, Revenue, Industry, Growth, Value, Analysis, Outlook & Segmentation
Market Forecast By Application (Tableware, Sanitary ware, Medical applications), By End Use (Ceramic and, Non-ceramic) And Competitive Landscape
| Product Code: ETC5257652 | Publication Date: Nov 2023 | Updated Date: Nov 2025 | Product Type: Market Research Report | |
| Publisher: 6Wresearch | Author: Bhawna Singh | No. of Pages: 60 | No. of Figures: 30 | No. of Tables: 5 |
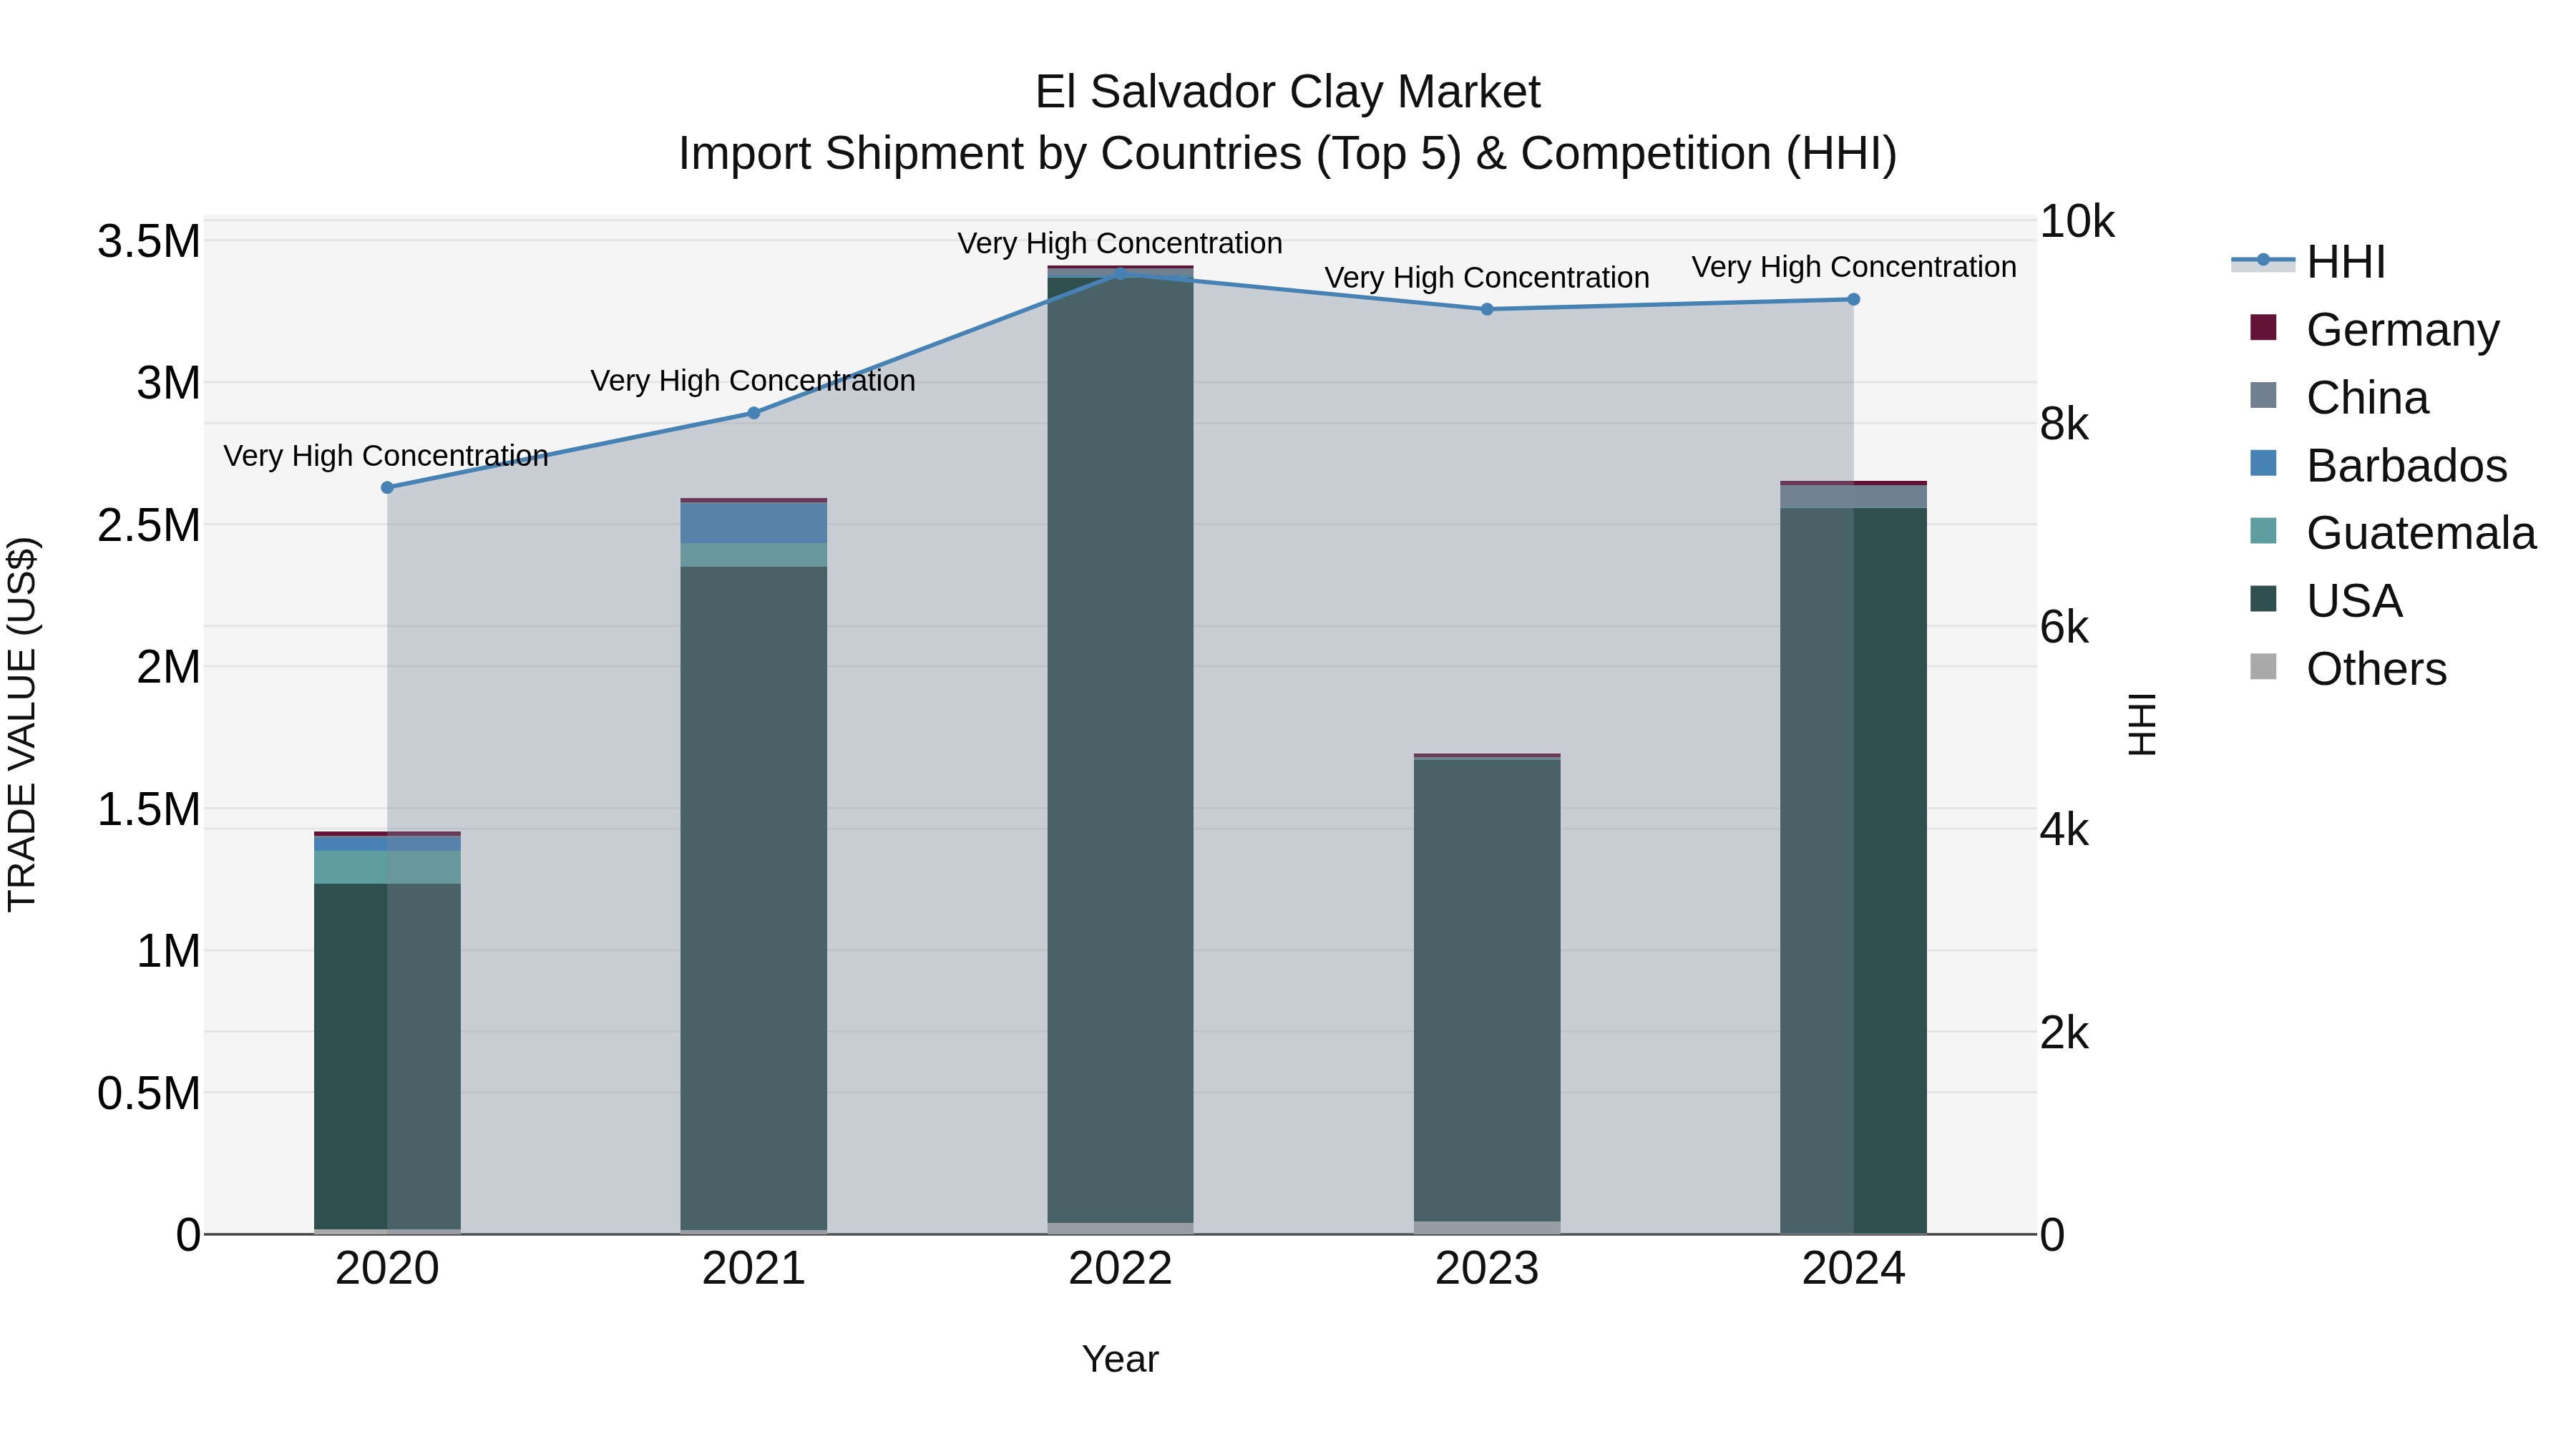
El Salvador Clay Market Top 5 Importing Countries and Market Competition (HHI) Analysis
El Salvador`s clay import market in 2024 continued to be dominated by key players such as the USA, China, Germany, Mexico, and Guatemala. The high concentration levels, as indicated by the high Herfindahl-Hirschman Index (HHI), suggest a limited number of major suppliers in this market. The impressive compound annual growth rate (CAGR) of 16.96% from 2020 to 2024 reflects a strong and steady increase in demand for clay imports. Furthermore, the remarkable growth rate of 56.75% from 2023 to 2024 indicates a significant surge in import activity, highlighting potential opportunities and challenges for industry stakeholders.
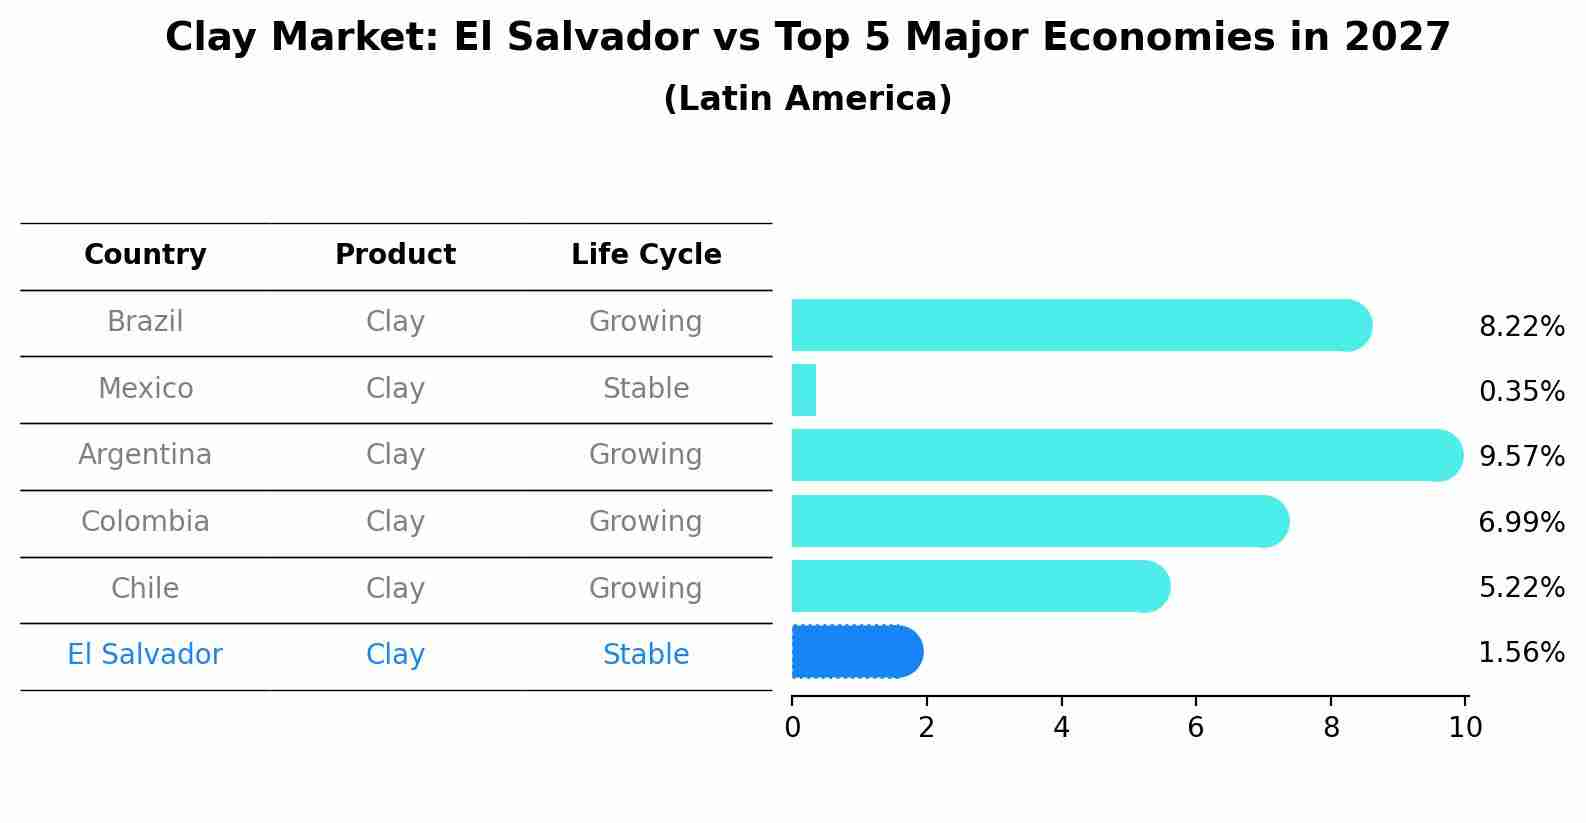
Clay Market: El Salvador vs Top 5 Major Economies in 2027 (Latin America)
By 2027, El Salvador's Clay market is forecasted to achieve a stable growth rate of 1.56%, with Brazil leading the Latin America region, followed by Mexico, Argentina, Colombia and Chile.
El Salvador Clay Market Overview
The clay market in El Salvador is primarily driven by the demand from the construction, ceramics, and pottery industries. Clay is a key raw material used in the production of bricks, tiles, and other ceramic products. With a growing construction sector and a renewed interest in artisanal and handmade products, the clay market is expected to experience steady demand. Additionally, the growth of the local ceramic industry, along with exports of clay-based products, will help further support the market.
Drivers of the market
The clay market in El Salvador is supported by the growing demand for raw materials in the construction, ceramics, and pottery industries. Clay is an essential component in the production of bricks, tiles, and ceramics, with the construction sector driving its demand. Additionally, the traditional pottery-making industry in El Salvador continues to be a significant contributor to the market. The increasing popularity of locally produced, artisanal ceramics and clay products, especially in the tourism and retail sectors, is further expanding the market. Moreover, the growing trend for sustainable and eco-friendly building materials is boosting the use of clay in green construction projects.
Challenges of the market
The clay market struggles with limited local demand, competition from alternative construction materials, and high production costs.
Government Policy of the market
El Salvadors government policies on the clay market are designed to promote the sustainable extraction and use of clay for various industrial applications, including ceramics and construction materials. The government enforces regulations on the environmental impact of clay mining, requiring companies to adopt responsible mining practices that minimize land degradation and protect local ecosystems. Additionally, policies support local industries involved in clay production and encourage the development of value-added products, such as ceramics and pottery, to boost the countrys export capacity.
Key Highlights of the Report:
- El Salvador Clay Market Outlook
- Market Size of El Salvador Clay Market, 2024
- Forecast of El Salvador Clay Market, 2031
- Historical Data and Forecast of El Salvador Clay Revenues & Volume for the Period 2021-2031
- El Salvador Clay Market Trend Evolution
- El Salvador Clay Market Drivers and Challenges
- El Salvador Clay Price Trends
- El Salvador Clay Porter`s Five Forces
- El Salvador Clay Industry Life Cycle
- Historical Data and Forecast of El Salvador Clay Market Revenues & Volume By Application for the Period 2021-2031
- Historical Data and Forecast of El Salvador Clay Market Revenues & Volume By Tableware for the Period 2021-2031
- Historical Data and Forecast of El Salvador Clay Market Revenues & Volume By Sanitary ware for the Period 2021-2031
- Historical Data and Forecast of El Salvador Clay Market Revenues & Volume By Medical applications for the Period 2021-2031
- Historical Data and Forecast of El Salvador Clay Market Revenues & Volume By End Use for the Period 2021-2031
- Historical Data and Forecast of El Salvador Clay Market Revenues & Volume By Ceramic and for the Period 2021-2031
- Historical Data and Forecast of El Salvador Clay Market Revenues & Volume By Non-ceramic for the Period 2021-2031
- El Salvador Clay Import Export Trade Statistics
- Market Opportunity Assessment By Application
- Market Opportunity Assessment By End Use
- El Salvador Clay Top Companies Market Share
- El Salvador Clay Competitive Benchmarking By Technical and Operational Parameters
- El Salvador Clay Company Profiles
- El Salvador Clay Key Strategic Recommendations
Frequently Asked Questions About the Market Study (FAQs):
6Wresearch actively monitors the El Salvador Clay Market and publishes its comprehensive annual report, highlighting emerging trends, growth drivers, revenue analysis, and forecast outlook. Our insights help businesses to make data-backed strategic decisions with ongoing market dynamics. Our analysts track relevent industries related to the El Salvador Clay Market, allowing our clients with actionable intelligence and reliable forecasts tailored to emerging regional needs.
Yes, we provide customisation as per your requirements. To learn more, feel free to contact us on sales@6wresearch.com
1 Executive Summary |
2 Introduction |
2.1 Key Highlights of the Report |
2.2 Report Description |
2.3 Market Scope & Segmentation |
2.4 Research Methodology |
2.5 Assumptions |
3 El Salvador Clay Market Overview |
3.1 El Salvador Country Macro Economic Indicators |
3.2 El Salvador Clay Market Revenues & Volume, 2021 & 2031F |
3.3 El Salvador Clay Market - Industry Life Cycle |
3.4 El Salvador Clay Market - Porter's Five Forces |
3.5 El Salvador Clay Market Revenues & Volume Share, By Application, 2021 & 2031F |
3.6 El Salvador Clay Market Revenues & Volume Share, By End Use, 2021 & 2031F |
4 El Salvador Clay Market Dynamics |
4.1 Impact Analysis |
4.2 Market Drivers |
4.2.1 Rising demand for eco-friendly and sustainable construction materials |
4.2.2 Growing popularity of handmade and artisanal products |
4.2.3 Government initiatives promoting local craftsmanship and traditional industries |
4.3 Market Restraints |
4.3.1 Availability and access to raw materials for clay production |
4.3.2 Fluctuations in global clay prices |
4.3.3 Competition from alternative construction materials such as concrete and steel |
5 El Salvador Clay Market Trends |
6 El Salvador Clay Market Segmentations |
6.1 El Salvador Clay Market, By Application |
6.1.1 Overview and Analysis |
6.1.2 El Salvador Clay Market Revenues & Volume, By Tableware, 2021-2031F |
6.1.3 El Salvador Clay Market Revenues & Volume, By Sanitary ware, 2021-2031F |
6.1.4 El Salvador Clay Market Revenues & Volume, By Medical applications, 2021-2031F |
6.2 El Salvador Clay Market, By End Use |
6.2.1 Overview and Analysis |
6.2.2 El Salvador Clay Market Revenues & Volume, By Ceramic and, 2021-2031F |
6.2.3 El Salvador Clay Market Revenues & Volume, By Non-ceramic, 2021-2031F |
7 El Salvador Clay Market Import-Export Trade Statistics |
7.1 El Salvador Clay Market Export to Major Countries |
7.2 El Salvador Clay Market Imports from Major Countries |
8 El Salvador Clay Market Key Performance Indicators |
8.1 Percentage of local clay used in construction projects |
8.2 Number of artisanal clay workshops and training programs |
8.3 Average time taken to obtain necessary permits and approvals for clay-related projects |
9 El Salvador Clay Market - Opportunity Assessment |
9.1 El Salvador Clay Market Opportunity Assessment, By Application, 2021 & 2031F |
9.2 El Salvador Clay Market Opportunity Assessment, By End Use, 2021 & 2031F |
10 El Salvador Clay Market - Competitive Landscape |
10.1 El Salvador Clay Market Revenue Share, By Companies, 2024 |
10.2 El Salvador Clay Market Competitive Benchmarking, By Operating and Technical Parameters |
11 Company Profiles |
12 Recommendations | 13 Disclaimer |
Export potential assessment - trade Analytics for 2030
Export potential enables firms to identify high-growth global markets with greater confidence by combining advanced trade intelligence with a structured quantitative methodology. The framework analyzes emerging demand trends and country-level import patterns while integrating macroeconomic and trade datasets such as GDP and population forecasts, bilateral import–export flows, tariff structures, elasticity differentials between developed and developing economies, geographic distance, and import demand projections. Using weighted trade values from 2020–2024 as the base period to project country-to-country export potential for 2030, these inputs are operationalized through calculated drivers such as gravity model parameters, tariff impact factors, and projected GDP per-capita growth. Through an analysis of hidden potentials, demand hotspots, and market conditions that are most favorable to success, this method enables firms to focus on target countries, maximize returns, and global expansion with data, backed by accuracy.
By factoring in the projected importer demand gap that is currently unmet and could be potential opportunity, it identifies the potential for the Exporter (Country) among 190 countries, against the general trade analysis, which identifies the biggest importer or exporter.
To discover high-growth global markets and optimize your business strategy:
Click Here
Pricing
- Single User License$ 1,995
- Department License$ 2,400
- Site License$ 3,120
- Global License$ 3,795

Search
Thought Leadership and Analyst Meet


Our Clients
Related Reports
- India Switchgear Market Outlook (2026 - 2032) | Size, Share, Trends, Growth, Revenue, Forecast, Analysis, Value, Outlook
- Pakistan Contraceptive Implants Market (2025-2031) | Demand, Growth, Size, Share, Industry, Pricing Analysis, Competitive, Strategic Insights, Strategy, Consumer Insights, Analysis, Investment Trends, Opportunities, Revenue, Segments, Value, Segmentation, Supply, Forecast, Restraints, Outlook, Competition, Drivers, Trends, Companies, Challenges
- Sri Lanka Packaging Market (2026-2032) | Outlook, Competition, Drivers, Trends, Demand, Pricing Analysis, Competitive, Strategic Insights, Companies, Challenges, Strategy, Consumer Insights, Analysis, Investment Trends, Opportunities, Growth, Size, Share, Industry, Revenue, Segments, Value, Segmentation, Supply, Forecast, Restraints
- India Kids Watches Market (2026-2032) | Strategy, Consumer Insights, Analysis, Investment Trends, Opportunities, Growth, Size, Share, Industry, Revenue, Segments, Value, Segmentation, Supply, Forecast, Restraints, Outlook, Competition, Drivers, Trends, Demand, Pricing Analysis, Competitive, Strategic Insights, Companies, Challenges
- Saudi Arabia Core Assurance Service Market (2025-2031) | Strategy, Consumer Insights, Analysis, Investment Trends, Opportunities, Growth, Size, Share, Industry, Revenue, Segments, Value, Segmentation, Supply, Forecast, Restraints, Outlook, Competition, Drivers, Trends, Demand, Pricing Analysis, Competitive, Strategic Insights, Companies, Challenges
- Romania Uninterruptible Power Supply (UPS) Market (2026-2032) | Industry, Analysis, Revenue, Size, Forecast, Outlook, Value, Trends, Share, Growth & Companies
- Saudi Arabia Car Window Tinting Film, Paint Protection Film (PPF), and Ceramic Coating Market (2025-2031) | Strategy, Consumer Insights, Analysis, Investment Trends, Opportunities, Growth, Size, Share, Industry, Revenue, Segments, Value, Segmentation, Supply, Forecast, Restraints, Outlook, Competition, Drivers, Trends, Demand, Pricing Analysis, Competitive, Strategic Insights, Companies, Challenges
- South Africa Stationery Market (2025-2031) | Share, Size, Industry, Value, Growth, Revenue, Analysis, Trends, Segmentation & Outlook
- Afghanistan Rocking Chairs And Adirondack Chairs Market (2026-2032) | Size & Revenue, Competitive Landscape, Share, Segmentation, Industry, Value, Outlook, Analysis, Trends, Growth, Forecast, Companies
- Afghanistan Apparel Market (2026-2032) | Growth, Outlook, Industry, Segmentation, Forecast, Size, Companies, Trends, Value, Share, Analysis & Revenue
Industry Events and Analyst Meet

India EV Show 2026

EV tech India Expo 2026

Auto Tech Asia 2026

Battery Tech India 2026

Smart Production Solutions Guangzhou 2026
Whitepaper
- Middle East & Africa Commercial Security Market Click here to view more.
- Middle East & Africa Fire Safety Systems & Equipment Market Click here to view more.
- GCC Drone Market Click here to view more.
- Middle East Lighting Fixture Market Click here to view more.
- GCC Physical & Perimeter Security Market Click here to view more.
6WResearch In News
- Doha a strategic location for EV manufacturing hub: IPA Qatar
- Demand for luxury TVs surging in the GCC, says Samsung
- Empowering Growth: The Thriving Journey of Bangladesh’s Cable Industry
- Demand for luxury TVs surging in the GCC, says Samsung
- Video call with a traditional healer? Once unthinkable, it’s now common in South Africa
- Intelligent Buildings To Smooth GCC’s Path To Net Zero