Finland Xenon Gas Market (2025-2031) | Forecast, Trends, Segmentation, Analysis, Growth, Value, Share, Companies, Revenue, Industry, Size & Outlook
Market Forecast By Mode of Supply (Packaged, Merchant, On-Site, Others), By End-use (Aviation andAerospace, Healthcare, Imaging and Lighting, Automotive and Transportation, Electrical and Electronics, Construction, Others) And Competitive Landscape
| Product Code: ETC4715550 | Publication Date: Nov 2023 | Updated Date: Nov 2025 | Product Type: Market Research Report | |
| Publisher: 6Wresearch | Author: Shubham Deep | No. of Pages: 60 | No. of Figures: 30 | No. of Tables: 5 |
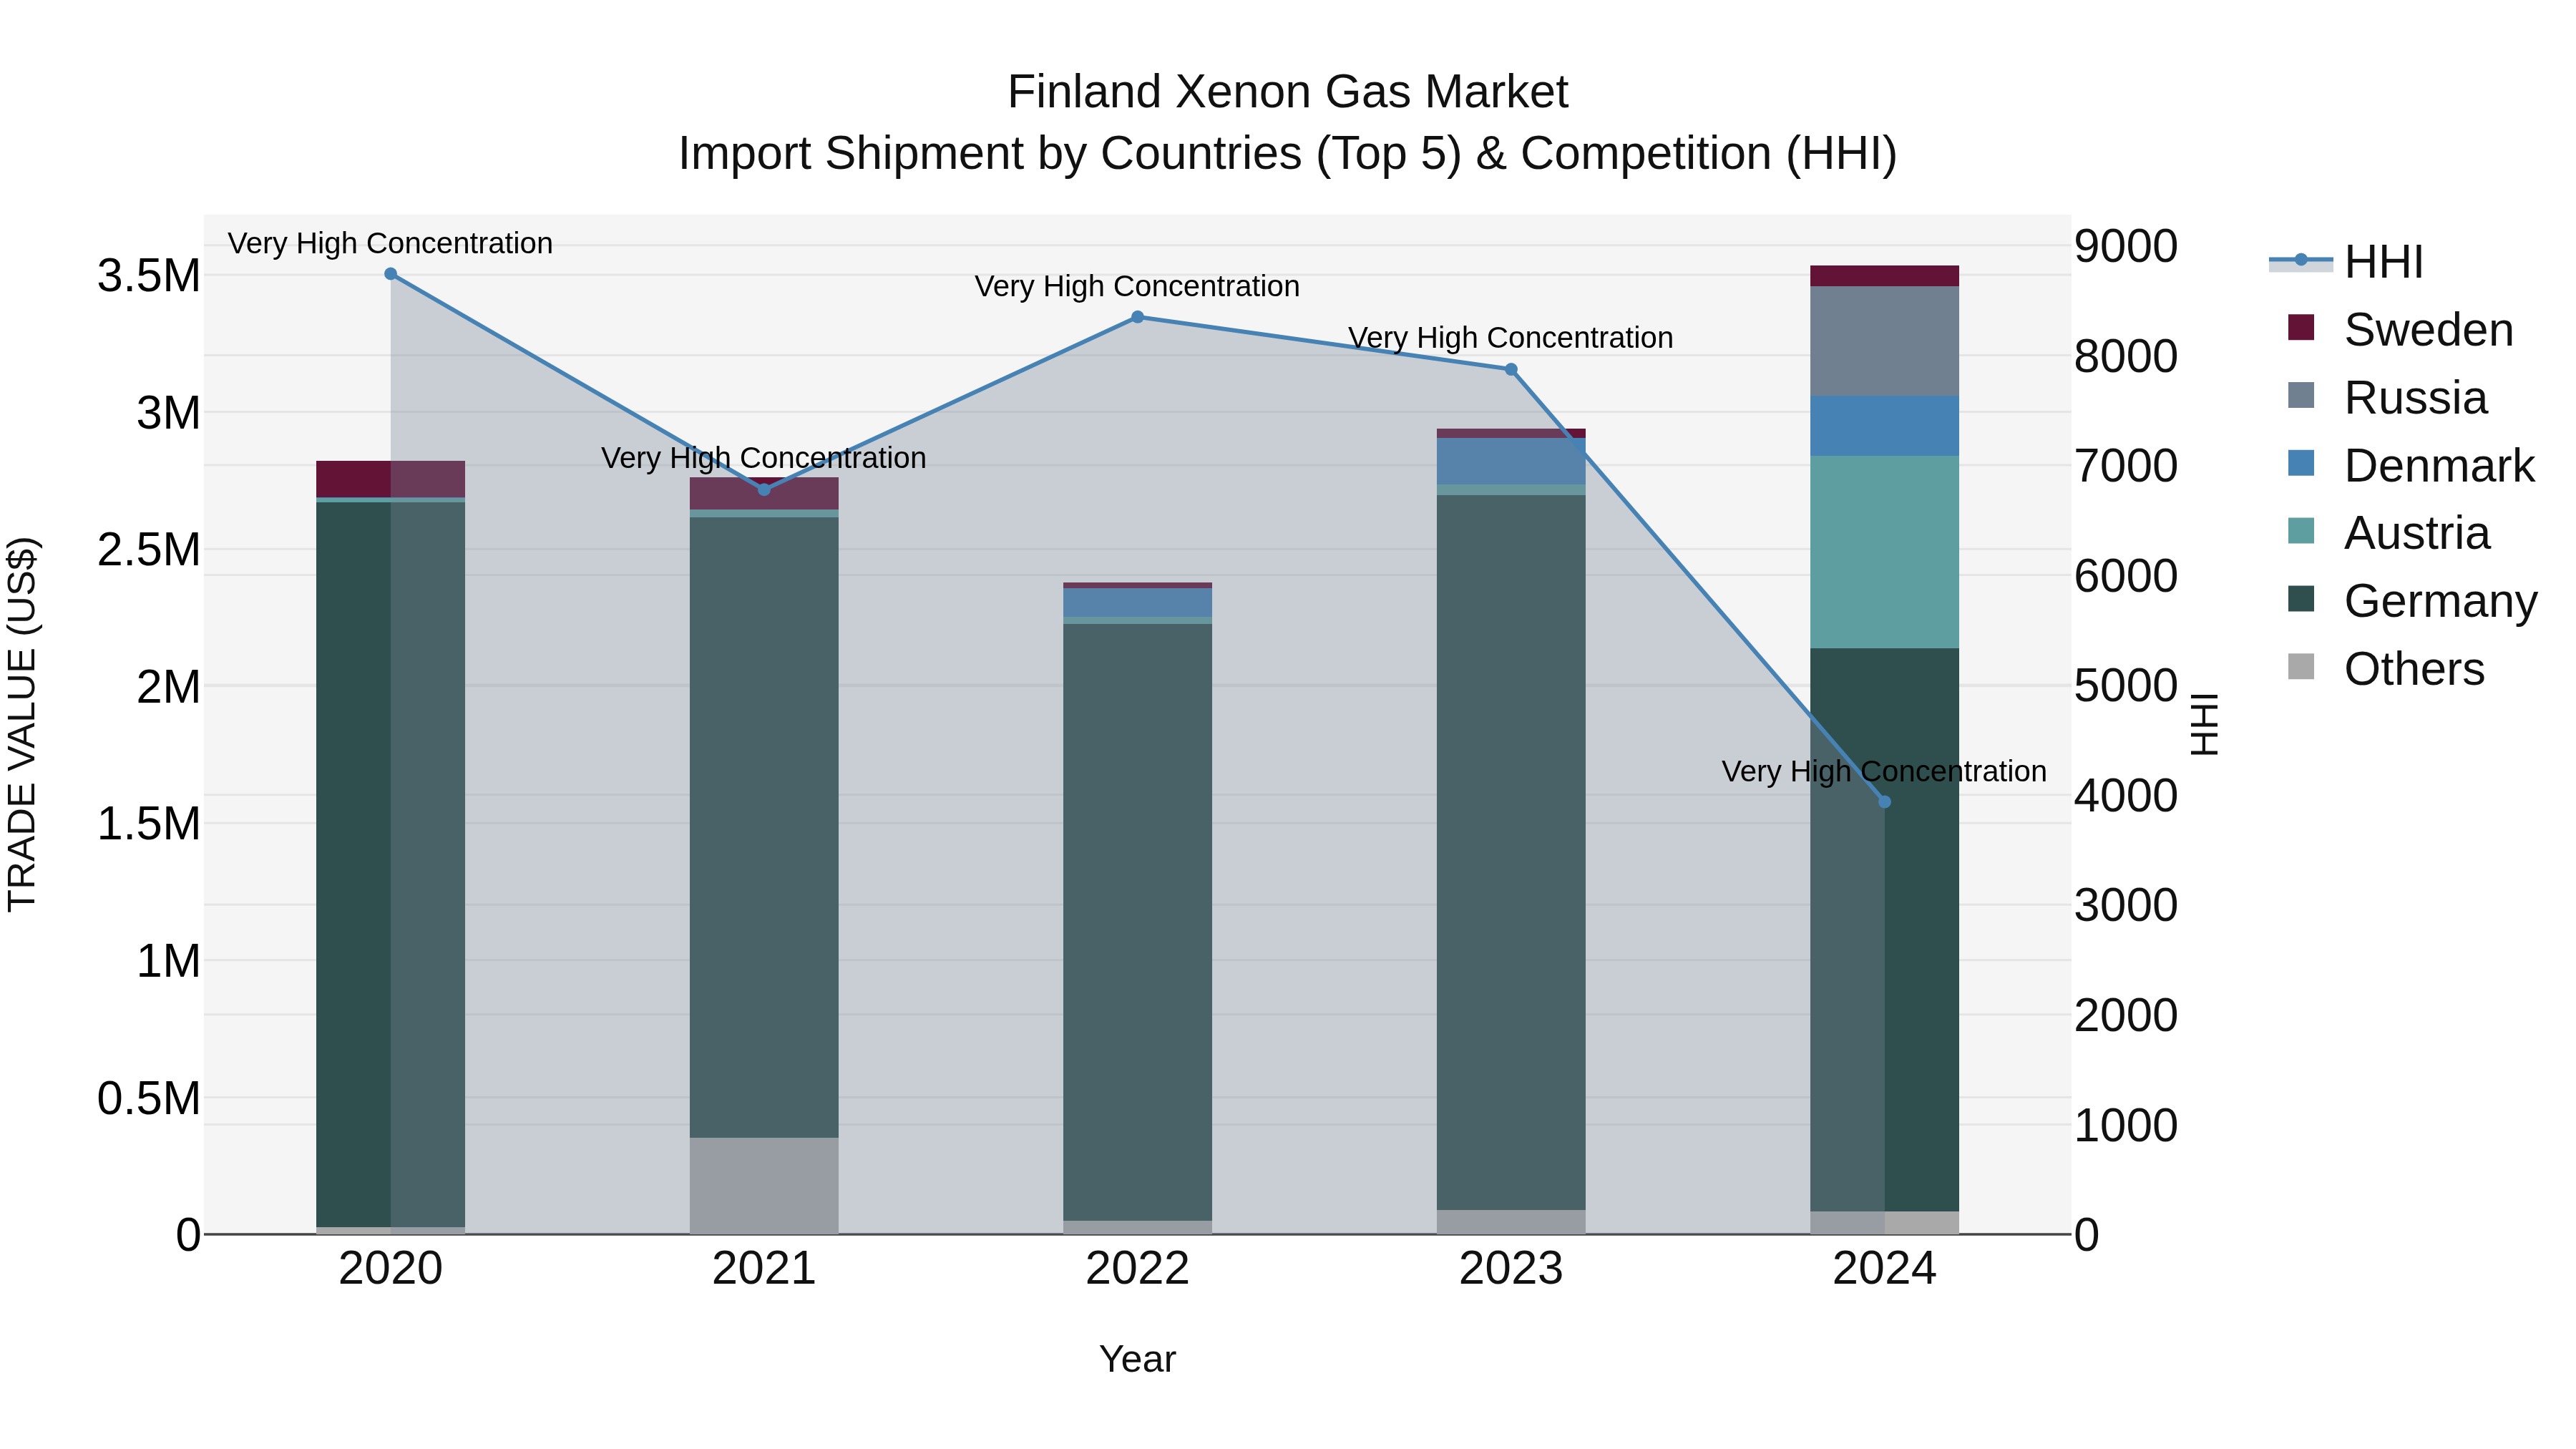
Finland Xenon Gas Market Top 5 Importing Countries and Market Competition (HHI) Analysis
In 2024, Finland continued to rely on imports of xenon gas, with top suppliers being Germany, Austria, Russia, Denmark, and Sweden. The Herfindahl-Hirschman Index (HHI) indicated a high concentration of imports, suggesting a competitive market. The compound annual growth rate (CAGR) from 2020 to 2024 stood at a steady 5.77%, showing sustained demand. Notably, the impressive growth rate of 20.25% from 2023 to 2024 signals a potential surge in xenon gas utilization in Finland, indicating a promising market for suppliers.
Finland Xenon Gas Market Overview
Xenon gas in Finland is widely used in lighting, medical imaging, and aerospace applications. The market benefits from increasing demand for high-performance and energy-efficient solutions.
Drivers of the market
The xenon gas market in Finland is driven by the growing demand for high-quality lighting solutions, particularly in the automotive and medical sectors. Xenon gas is used in high-intensity discharge lamps, which are commonly found in car headlights and stadium lighting due to their brightness and energy efficiency. The medical sector also utilizes xenon gas in anesthesiology for its anesthetic properties. As Finland continues to focus on sustainability and energy-efficient technologies, the adoption of xenon-based lighting solutions is likely to increase. Additionally, innovations in lighting technologies and the demand for specialized gas mixtures in industrial applications are contributing to the growth of the xenon gas market.
Challenges of the market
The xenon gas market in Finland is constrained by limited domestic production capabilities and dependence on imports. Volatile pricing and stringent safety regulations further challenge market growth.
Government Policy of the market
The Xenon Gas market in Finland is influenced by industrial gas policies that regulate the production, distribution, and use of gases in various sectors, including electronics, medical, and lighting industries. Finnish regulations focus on ensuring the safety of handling and transporting gases, as well as promoting the use of gases in high-tech applications. Xenon gas is used in specialized applications like high-performance lighting and medical imaging, where Finlands commitment to technological advancement and healthcare innovation drives demand. These policies encourage the safe and sustainable use of industrial gases, supporting the growth of the xenon gas market.
Key Highlights of the Report:
- Finland Xenon Gas Market Outlook
- Market Size of Finland Xenon Gas Market, 2024
- Forecast of Finland Xenon Gas Market, 2031
- Historical Data and Forecast of Finland Xenon Gas Revenues & Volume for the Period 2021-2031
- Finland Xenon Gas Market Trend Evolution
- Finland Xenon Gas Market Drivers and Challenges
- Finland Xenon Gas Price Trends
- Finland Xenon Gas Porter`s Five Forces
- Finland Xenon Gas Industry Life Cycle
- Historical Data and Forecast of Finland Xenon Gas Market Revenues & Volume By Mode of Supply for the Period 2021-2031
- Historical Data and Forecast of Finland Xenon Gas Market Revenues & Volume By Packaged for the Period 2021-2031
- Historical Data and Forecast of Finland Xenon Gas Market Revenues & Volume By Merchant for the Period 2021-2031
- Historical Data and Forecast of Finland Xenon Gas Market Revenues & Volume By On-Site for the Period 2021-2031
- Historical Data and Forecast of Finland Xenon Gas Market Revenues & Volume By Others for the Period 2021-2031
- Historical Data and Forecast of Finland Xenon Gas Market Revenues & Volume By End-use for the Period 2021-2031
- Historical Data and Forecast of Finland Xenon Gas Market Revenues & Volume By Aviation andAerospace for the Period 2021-2031
- Historical Data and Forecast of Finland Xenon Gas Market Revenues & Volume By Healthcare for the Period 2021-2031
- Historical Data and Forecast of Finland Xenon Gas Market Revenues & Volume By Imaging and Lighting for the Period 2021-2031
- Historical Data and Forecast of Finland Xenon Gas Market Revenues & Volume By Automotive and Transportation for the Period 2021-2031
- Historical Data and Forecast of Finland Xenon Gas Market Revenues & Volume By Electrical and Electronics for the Period 2021-2031
- Historical Data and Forecast of Finland Xenon Gas Market Revenues & Volume By Construction for the Period 2021-2031
- Historical Data and Forecast of Finland Xenon Gas Market Revenues & Volume By Others for the Period 2021-2031
- Finland Xenon Gas Import Export Trade Statistics
- Market Opportunity Assessment By Mode of Supply
- Market Opportunity Assessment By End-use
- Finland Xenon Gas Top Companies Market Share
- Finland Xenon Gas Competitive Benchmarking By Technical and Operational Parameters
- Finland Xenon Gas Company Profiles
- Finland Xenon Gas Key Strategic Recommendations
Frequently Asked Questions About the Market Study (FAQs):
6Wresearch actively monitors the Finland Xenon Gas Market and publishes its comprehensive annual report, highlighting emerging trends, growth drivers, revenue analysis, and forecast outlook. Our insights help businesses to make data-backed strategic decisions with ongoing market dynamics. Our analysts track relevent industries related to the Finland Xenon Gas Market, allowing our clients with actionable intelligence and reliable forecasts tailored to emerging regional needs.
Yes, we provide customisation as per your requirements. To learn more, feel free to contact us on sales@6wresearch.com
1 Executive Summary |
2 Introduction |
2.1 Key Highlights of the Report |
2.2 Report Description |
2.3 Market Scope & Segmentation |
2.4 Research Methodology |
2.5 Assumptions |
3 Finland Xenon Gas Market Overview |
3.1 Finland Country Macro Economic Indicators |
3.2 Finland Xenon Gas Market Revenues & Volume, 2021 & 2031F |
3.3 Finland Xenon Gas Market - Industry Life Cycle |
3.4 Finland Xenon Gas Market - Porter's Five Forces |
3.5 Finland Xenon Gas Market Revenues & Volume Share, By Mode of Supply, 2021 & 2031F |
3.6 Finland Xenon Gas Market Revenues & Volume Share, By End-use, 2021 & 2031F |
4 Finland Xenon Gas Market Dynamics |
4.1 Impact Analysis |
4.2 Market Drivers |
4.2.1 Increasing demand for xenon gas in various industries such as healthcare, aerospace, and electronics |
4.2.2 Growing awareness about the benefits of xenon gas in lighting applications and medical imaging |
4.2.3 Technological advancements leading to new uses of xenon gas in different sectors |
4.3 Market Restraints |
4.3.1 Fluctuating prices of raw materials affecting the production cost of xenon gas |
4.3.2 Stringent regulations regarding the handling and disposal of xenon gas impacting market growth |
4.3.3 Competition from alternative gases with similar properties affecting market penetration |
5 Finland Xenon Gas Market Trends |
6 Finland Xenon Gas Market Segmentations |
6.1 Finland Xenon Gas Market, By Mode of Supply |
6.1.1 Overview and Analysis |
6.1.2 Finland Xenon Gas Market Revenues & Volume, By Packaged, 2021-2031F |
6.1.3 Finland Xenon Gas Market Revenues & Volume, By Merchant, 2021-2031F |
6.1.4 Finland Xenon Gas Market Revenues & Volume, By On-Site, 2021-2031F |
6.1.5 Finland Xenon Gas Market Revenues & Volume, By Others, 2021-2031F |
6.2 Finland Xenon Gas Market, By End-use |
6.2.1 Overview and Analysis |
6.2.2 Finland Xenon Gas Market Revenues & Volume, By Aviation and? Aerospace, 2021-2031F |
6.2.3 Finland Xenon Gas Market Revenues & Volume, By Healthcare, 2021-2031F |
6.2.4 Finland Xenon Gas Market Revenues & Volume, By Imaging and Lighting, 2021-2031F |
6.2.5 Finland Xenon Gas Market Revenues & Volume, By Automotive and Transportation, 2021-2031F |
6.2.6 Finland Xenon Gas Market Revenues & Volume, By Electrical and Electronics, 2021-2031F |
6.2.7 Finland Xenon Gas Market Revenues & Volume, By Construction, 2021-2031F |
7 Finland Xenon Gas Market Import-Export Trade Statistics |
7.1 Finland Xenon Gas Market Export to Major Countries |
7.2 Finland Xenon Gas Market Imports from Major Countries |
8 Finland Xenon Gas Market Key Performance Indicators |
8.1 Adoption rate of xenon gas in emerging industries |
8.2 Research and development investments in xenon gas applications |
8.3 Number of patents filed for xenon gas technologies |
8.4 Environmental impact assessments related to xenon gas production and usage |
8.5 Investments in infrastructure for xenon gas storage and transportation |
9 Finland Xenon Gas Market - Opportunity Assessment |
9.1 Finland Xenon Gas Market Opportunity Assessment, By Mode of Supply, 2021 & 2031F |
9.2 Finland Xenon Gas Market Opportunity Assessment, By End-use, 2021 & 2031F |
10 Finland Xenon Gas Market - Competitive Landscape |
10.1 Finland Xenon Gas Market Revenue Share, By Companies, 2024 |
10.2 Finland Xenon Gas Market Competitive Benchmarking, By Operating and Technical Parameters |
11 Company Profiles |
12 Recommendations | 13 Disclaimer |
Export potential assessment - trade Analytics for 2030
Export potential enables firms to identify high-growth global markets with greater confidence by combining advanced trade intelligence with a structured quantitative methodology. The framework analyzes emerging demand trends and country-level import patterns while integrating macroeconomic and trade datasets such as GDP and population forecasts, bilateral import–export flows, tariff structures, elasticity differentials between developed and developing economies, geographic distance, and import demand projections. Using weighted trade values from 2020–2024 as the base period to project country-to-country export potential for 2030, these inputs are operationalized through calculated drivers such as gravity model parameters, tariff impact factors, and projected GDP per-capita growth. Through an analysis of hidden potentials, demand hotspots, and market conditions that are most favorable to success, this method enables firms to focus on target countries, maximize returns, and global expansion with data, backed by accuracy.
By factoring in the projected importer demand gap that is currently unmet and could be potential opportunity, it identifies the potential for the Exporter (Country) among 190 countries, against the general trade analysis, which identifies the biggest importer or exporter.
To discover high-growth global markets and optimize your business strategy:
Click Here
Pricing
- Single User License$ 1,995
- Department License$ 2,400
- Site License$ 3,120
- Global License$ 3,795

Search
Thought Leadership and Analyst Meet


Our Clients
Latest Reports
- United Kingdom (UK) Long-term Care Insurance Market (2026-2032) | Growth, Share, Consumer Insights, Drivers, Opportunities, Competition, Pricing Analysis, Segments, Restraints, Companies, Competitive, Value, Outlook, Size, Demand, Analysis, Challenges, Strategic Insights, Investment Trends, Revenue, Trends, Supply, Forecast
- United Kingdom (UK) Long Term Care Market (2026-2032) | Companies, Outlook, Analysis, Trends, Value, Revenue, Segmentation, Share, Forecast, Competitive Landscape, Growth, Size & Forecast
- Iraq Insulation and Waterproofing Market (2026-2032) | Outlook, Drivers, Growth, Size, Share, Industry, Revenue, Trends, Demand, Competitive, Strategic Insights, Opportunities, Segments, Companies, Challenges, Strategy, Consumer Insights, Analysis, Investment Trends, Value, Segmentation, Forecast, Restraints
- India Switchgear Market Outlook (2026 - 2032) | Size, Share, Trends, Growth, Revenue, Forecast, Analysis, Value, Outlook
- Pakistan Contraceptive Implants Market (2025-2031) | Demand, Growth, Size, Share, Industry, Pricing Analysis, Competitive, Strategic Insights, Strategy, Consumer Insights, Analysis, Investment Trends, Opportunities, Revenue, Segments, Value, Segmentation, Supply, Forecast, Restraints, Outlook, Competition, Drivers, Trends, Companies, Challenges
- Sri Lanka Packaging Market (2026-2032) | Outlook, Competition, Drivers, Trends, Demand, Pricing Analysis, Competitive, Strategic Insights, Companies, Challenges, Strategy, Consumer Insights, Analysis, Investment Trends, Opportunities, Growth, Size, Share, Industry, Revenue, Segments, Value, Segmentation, Supply, Forecast, Restraints
- India Kids Watches Market (2026-2032) | Strategy, Consumer Insights, Analysis, Investment Trends, Opportunities, Growth, Size, Share, Industry, Revenue, Segments, Value, Segmentation, Supply, Forecast, Restraints, Outlook, Competition, Drivers, Trends, Demand, Pricing Analysis, Competitive, Strategic Insights, Companies, Challenges
- Saudi Arabia Core Assurance Service Market (2025-2031) | Strategy, Consumer Insights, Analysis, Investment Trends, Opportunities, Growth, Size, Share, Industry, Revenue, Segments, Value, Segmentation, Supply, Forecast, Restraints, Outlook, Competition, Drivers, Trends, Demand, Pricing Analysis, Competitive, Strategic Insights, Companies, Challenges
- Romania Uninterruptible Power Supply (UPS) Market (2026-2032) | Industry, Analysis, Revenue, Size, Forecast, Outlook, Value, Trends, Share, Growth & Companies
- Saudi Arabia Car Window Tinting Film, Paint Protection Film (PPF), and Ceramic Coating Market (2025-2031) | Strategy, Consumer Insights, Analysis, Investment Trends, Opportunities, Growth, Size, Share, Industry, Revenue, Segments, Value, Segmentation, Supply, Forecast, Restraints, Outlook, Competition, Drivers, Trends, Demand, Pricing Analysis, Competitive, Strategic Insights, Companies, Challenges
Industry Events and Analyst Meet

India EV Show 2026

EV tech India Expo 2026

Auto Tech Asia 2026

Battery Tech India 2026

Smart Production Solutions Guangzhou 2026
Whitepaper
- Middle East & Africa Commercial Security Market Click here to view more.
- Middle East & Africa Fire Safety Systems & Equipment Market Click here to view more.
- GCC Drone Market Click here to view more.
- Middle East Lighting Fixture Market Click here to view more.
- GCC Physical & Perimeter Security Market Click here to view more.
6WResearch In News
- Doha a strategic location for EV manufacturing hub: IPA Qatar
- Demand for luxury TVs surging in the GCC, says Samsung
- Empowering Growth: The Thriving Journey of Bangladesh’s Cable Industry
- Demand for luxury TVs surging in the GCC, says Samsung
- Video call with a traditional healer? Once unthinkable, it’s now common in South Africa
- Intelligent Buildings To Smooth GCC’s Path To Net Zero