Georgia Caustic Soda Market Outlook | Share, Industry, Companies, COVID-19 IMPACT, Value, Forecast, Analysis, Growth, Trends, Size & Revenue
Market Forecast By Production Process (Membrane Cell, Diaphragm Cell, Other Production Processes), By Applications (Pulp and Paper, Organic Chemical, Inorganic Chemical, Soap and Detergent, Alumina, Water Treatment, Others) And Competitive Landscape
| Product Code: ETC191352 | Publication Date: May 2022 | Updated Date: Sep 2025 | Product Type: Market Research Report | |
| Publisher: 6Wresearch | Author: Ravi Bhandari | No. of Pages: 60 | No. of Figures: 40 | No. of Tables: 7 |
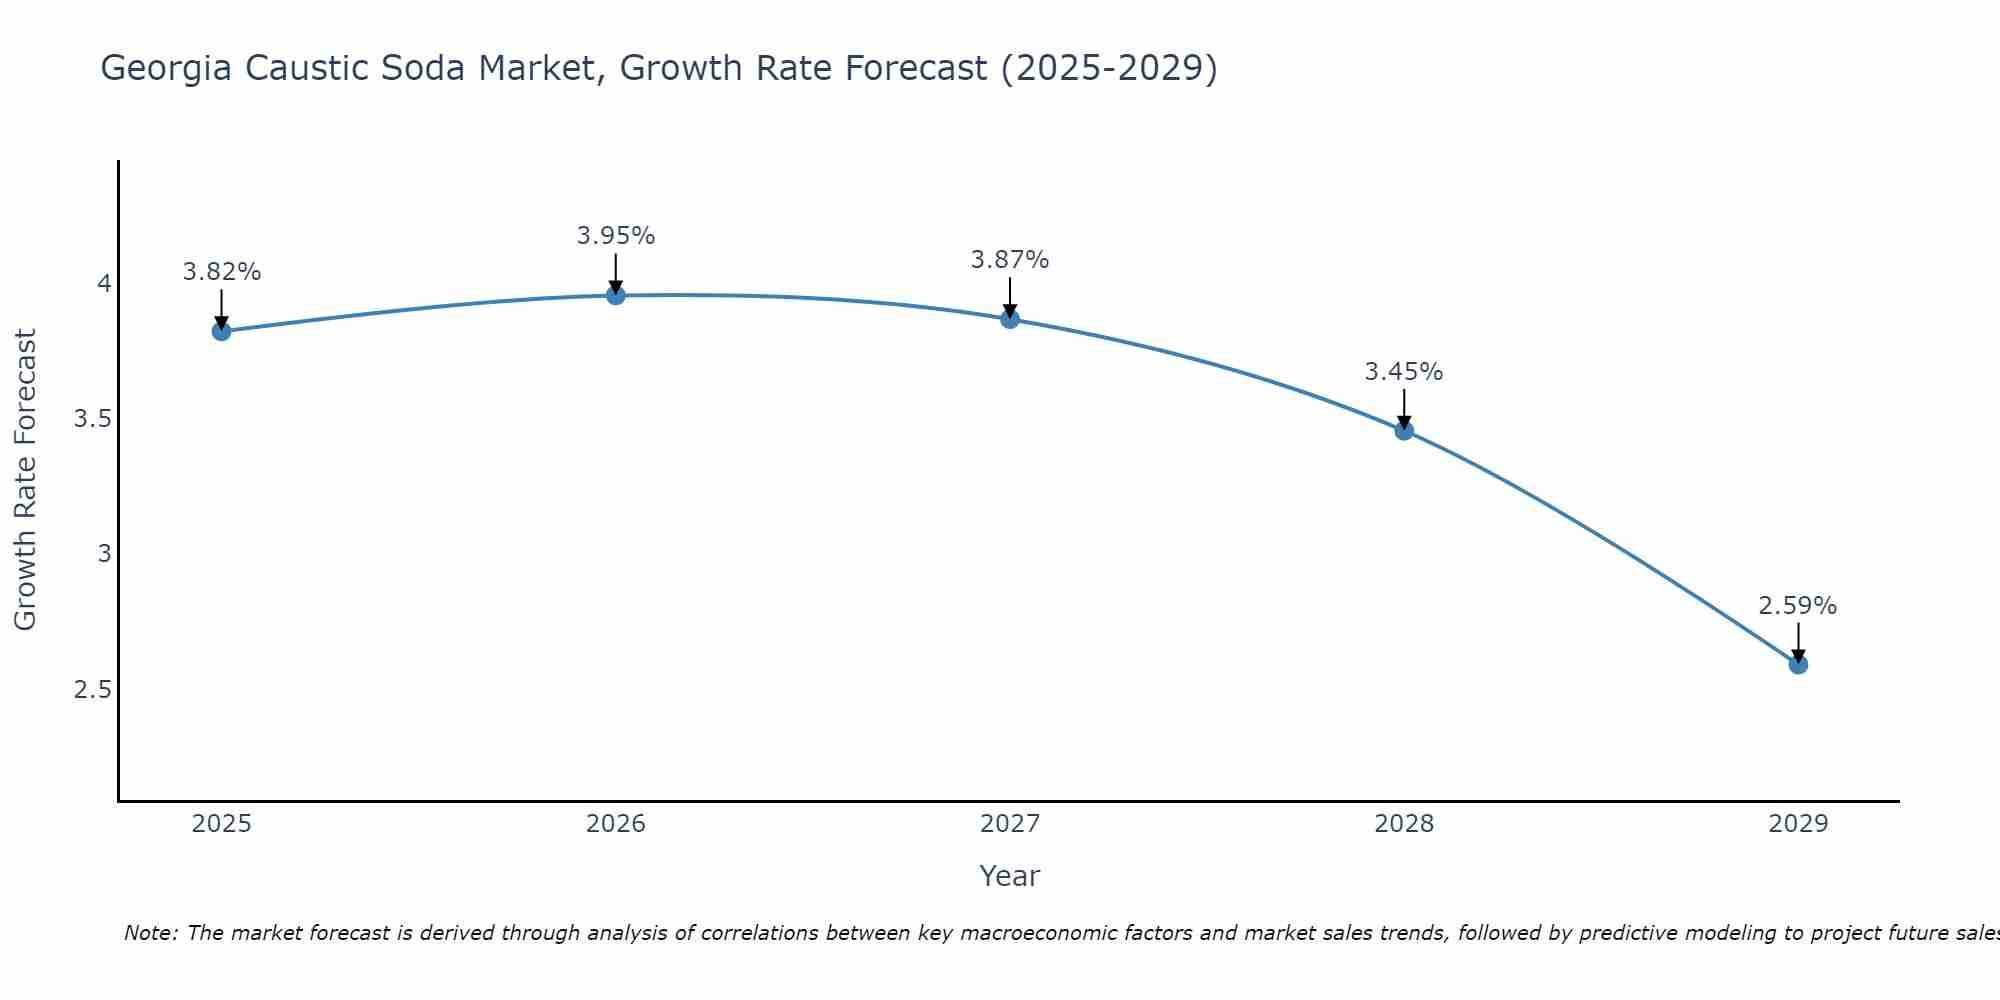
Georgia Caustic Soda Market Size Growth Rate
The Georgia Caustic Soda Market is projected to witness mixed growth rate patterns during 2025 to 2029. Starting at 3.82% in 2025, the market peaks at 3.95% in 2026, and settles at 2.59% by 2029.
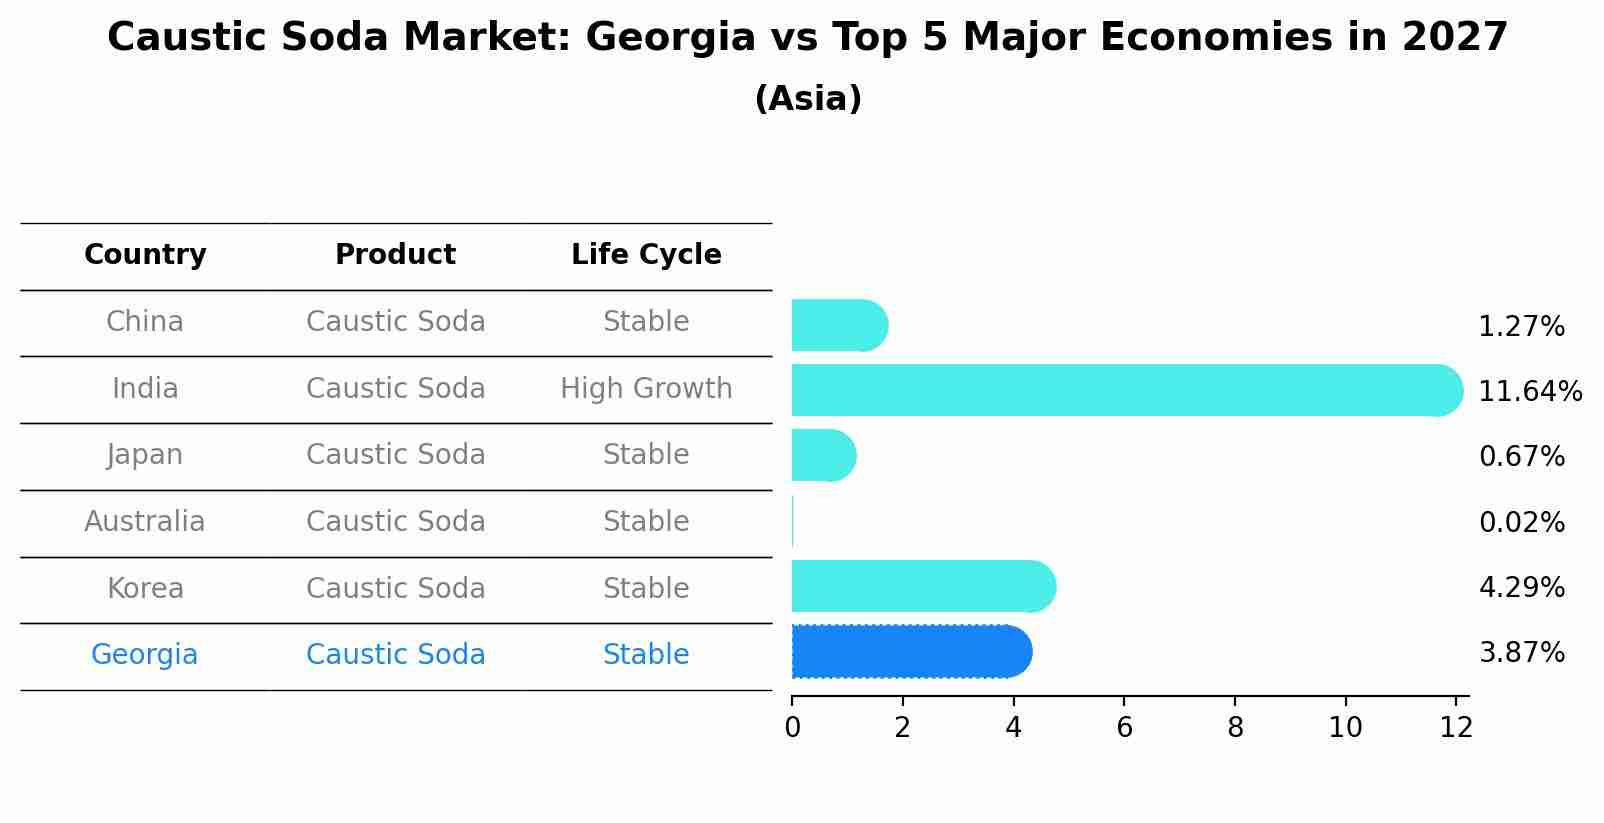
Caustic Soda Market: Georgia vs Top 5 Major Economies in 2027 (Asia)
In the Asia region, the Caustic Soda market in Georgia is projected to expand at a stable growth rate of 3.87% by 2027. The largest economy is China, followed by India, Japan, Australia and South Korea.
Georgia Caustic Soda Market Overview
In the caustic soda market, Georgia plays a significant role as both a consumer and producer of this essential chemical. Caustic soda, also known as sodium hydroxide, is used in various industries, including pulp and paper, textiles, and chemical manufacturing. Georgia industrial sector relies on caustic soda for processes such as bleaching, pH regulation, and chemical synthesis. With the state`s strategic location and industrial infrastructure, Georgia serves as a key hub for caustic soda trade and manufacturing in the Southeastern United States.
Drivers of the market
In the caustic soda market, drivers encompass various industries` requirements, including pulp and paper, textiles, and chemical manufacturing. Caustic soda, also known as sodium hydroxide, is a versatile chemical used in numerous industrial processes, such as pulp bleaching and water treatment. The demand for caustic soda in Georgia is driven by the overall growth of these industries and their need for this essential chemical.
Challenges of the market
The Georgia caustic soda market confronts challenges related to supply chain disruptions, environmental regulations, and competitive pricing pressures. Caustic soda manufacturers rely on a complex supply chain involving raw material procurement, manufacturing processes, and distribution networks, making them vulnerable to disruptions caused by natural disasters, geopolitical tensions, or transportation issues. Additionally, stringent environmental regulations governing the production and disposal of caustic soda by-products impose compliance costs on manufacturers, impacting overall profitability and market competitiveness.
Government Policy of the market
The caustic soda market in Georgia is subject to government regulations aimed at ensuring product quality, environmental protection, and industrial safety. Regulatory frameworks may include licensing requirements for caustic soda manufacturers, standards for production processes and waste management, and guidelines for safe handling and transportation of hazardous chemicals. Moreover, trade policies and tariffs may impact market dynamics by affecting import/export flows and domestic production capacity.
Key Highlights of the Report:
- Georgia Caustic Soda Market Outlook
- Market Size of Georgia Caustic Soda Market, 2021
- Forecast of Georgia Caustic Soda Market, 2028
- Historical Data and Forecast of Georgia Caustic Soda Revenues & Volume for the Period 2018 - 2028
- Georgia Caustic Soda Market Trend Evolution
- Georgia Caustic Soda Market Drivers and Challenges
- Georgia Caustic Soda Price Trends
- Georgia Caustic Soda Porter's Five Forces
- Georgia Caustic Soda Industry Life Cycle
- Historical Data and Forecast of Georgia Caustic Soda Market Revenues & Volume By Production Process for the Period 2018 - 2028
- Historical Data and Forecast of Georgia Caustic Soda Market Revenues & Volume By Membrane Cell for the Period 2018 - 2028
- Historical Data and Forecast of Georgia Caustic Soda Market Revenues & Volume By Diaphragm Cell for the Period 2018 - 2028
- Historical Data and Forecast of Georgia Caustic Soda Market Revenues & Volume By Other Production Processes for the Period 2018 - 2028
- Historical Data and Forecast of Georgia Caustic Soda Market Revenues & Volume By Applications for the Period 2018 - 2028
- Historical Data and Forecast of Georgia Caustic Soda Market Revenues & Volume By Pulp and Paper for the Period 2018 - 2028
- Historical Data and Forecast of Georgia Caustic Soda Market Revenues & Volume By Organic Chemical for the Period 2018 - 2028
- Historical Data and Forecast of Georgia Caustic Soda Market Revenues & Volume By Inorganic Chemical for the Period 2018 - 2028
- Historical Data and Forecast of Georgia Caustic Soda Market Revenues & Volume By Soap and Detergent for the Period 2018 - 2028
- Historical Data and Forecast of Georgia Caustic Soda Market Revenues & Volume By Alumina for the Period 2018 - 2028
- Historical Data and Forecast of Georgia Caustic Soda Market Revenues & Volume By Water Treatment for the Period 2018 - 2028
- Historical Data and Forecast of Georgia Caustic Soda Market Revenues & Volume By Others for the Period 2018 - 2028
- Georgia Caustic Soda Import Export Trade Statistics
- Market Opportunity Assessment By Production Process
- Market Opportunity Assessment By Applications
- Georgia Caustic Soda Top Companies Market Share
- Georgia Caustic Soda Competitive Benchmarking By Technical and Operational Parameters
- Georgia Caustic Soda Company Profiles
- Georgia Caustic Soda Key Strategic Recommendations
Frequently Asked Questions About the Market Study (FAQs):
6Wresearch actively monitors the Georgia Caustic Soda Market and publishes its comprehensive annual report, highlighting emerging trends, growth drivers, revenue analysis, and forecast outlook. Our insights help businesses to make data-backed strategic decisions with ongoing market dynamics. Our analysts track relevent industries related to the Georgia Caustic Soda Market, allowing our clients with actionable intelligence and reliable forecasts tailored to emerging regional needs.
Yes, we provide customisation as per your requirements. To learn more, feel free to contact us on sales@6wresearch.com
1 Executive Summary |
2 Introduction |
2.1 Key Highlights of the Report |
2.2 Report Description |
2.3 Market Scope & Segmentation |
2.4 Research Methodology |
2.5 Assumptions |
3 Georgia Caustic Soda Market Overview |
3.1 Georgia Country Macro Economic Indicators |
3.2 Georgia Caustic Soda Market Revenues & Volume, 2021 & 2028F |
3.3 Georgia Caustic Soda Market - Industry Life Cycle |
3.4 Georgia Caustic Soda Market - Porter's Five Forces |
3.5 Georgia Caustic Soda Market Revenues & Volume Share, By Production Process, 2021 & 2028F |
3.6 Georgia Caustic Soda Market Revenues & Volume Share, By Applications, 2021 & 2028F |
4 Georgia Caustic Soda Market Dynamics |
4.1 Impact Analysis |
4.2 Market Drivers |
4.2.1 Growth in the manufacturing sector in Georgia, leading to increased demand for caustic soda in industrial processes. |
4.2.2 Expansion of the paper and pulp industry in the region, driving the need for caustic soda in the production process. |
4.2.3 Increasing adoption of caustic soda in water treatment applications due to growing environmental concerns and regulations. |
4.3 Market Restraints |
4.3.1 Fluctuating prices of raw materials used in caustic soda production, impacting the overall cost and profitability. |
4.3.2 Environmental regulations and sustainability initiatives affecting the production processes of caustic soda manufacturers in Georgia. |
5 Georgia Caustic Soda Market Trends |
6 Georgia Caustic Soda Market, By Types |
6.1 Georgia Caustic Soda Market, By Production Process |
6.1.1 Overview and Analysis |
6.1.2 Georgia Caustic Soda Market Revenues & Volume, By Production Process, 2018 - 2028F |
6.1.3 Georgia Caustic Soda Market Revenues & Volume, By Membrane Cell, 2018 - 2028F |
6.1.4 Georgia Caustic Soda Market Revenues & Volume, By Diaphragm Cell, 2018 - 2028F |
6.1.5 Georgia Caustic Soda Market Revenues & Volume, By Other Production Processes, 2018 - 2028F |
6.2 Georgia Caustic Soda Market, By Applications |
6.2.1 Overview and Analysis |
6.2.2 Georgia Caustic Soda Market Revenues & Volume, By Pulp and Paper, 2018 - 2028F |
6.2.3 Georgia Caustic Soda Market Revenues & Volume, By Organic Chemical, 2018 - 2028F |
6.2.4 Georgia Caustic Soda Market Revenues & Volume, By Inorganic Chemical, 2018 - 2028F |
6.2.5 Georgia Caustic Soda Market Revenues & Volume, By Soap and Detergent, 2018 - 2028F |
6.2.6 Georgia Caustic Soda Market Revenues & Volume, By Alumina, 2018 - 2028F |
6.2.7 Georgia Caustic Soda Market Revenues & Volume, By Water Treatment, 2018 - 2028F |
7 Georgia Caustic Soda Market Import-Export Trade Statistics |
7.1 Georgia Caustic Soda Market Export to Major Countries |
7.2 Georgia Caustic Soda Market Imports from Major Countries |
8 Georgia Caustic Soda Market Key Performance Indicators |
8.1 Energy efficiency improvements in caustic soda production plants. |
8.2 Adoption of sustainable production practices in the caustic soda industry. |
8.3 Compliance with environmental regulations related to caustic soda production. |
9 Georgia Caustic Soda Market - Opportunity Assessment |
9.1 Georgia Caustic Soda Market Opportunity Assessment, By Production Process, 2021 & 2028F |
9.2 Georgia Caustic Soda Market Opportunity Assessment, By Applications, 2021 & 2028F |
10 Georgia Caustic Soda Market - Competitive Landscape |
10.1 Georgia Caustic Soda Market Revenue Share, By Companies, 2021 |
10.2 Georgia Caustic Soda Market Competitive Benchmarking, By Operating and Technical Parameters |
11 Company Profiles |
12 Recommendations |
13 Disclaimer |
Export potential assessment - trade Analytics for 2030
Export potential enables firms to identify high-growth global markets with greater confidence by combining advanced trade intelligence with a structured quantitative methodology. The framework analyzes emerging demand trends and country-level import patterns while integrating macroeconomic and trade datasets such as GDP and population forecasts, bilateral import–export flows, tariff structures, elasticity differentials between developed and developing economies, geographic distance, and import demand projections. Using weighted trade values from 2020–2024 as the base period to project country-to-country export potential for 2030, these inputs are operationalized through calculated drivers such as gravity model parameters, tariff impact factors, and projected GDP per-capita growth. Through an analysis of hidden potentials, demand hotspots, and market conditions that are most favorable to success, this method enables firms to focus on target countries, maximize returns, and global expansion with data, backed by accuracy.
By factoring in the projected importer demand gap that is currently unmet and could be potential opportunity, it identifies the potential for the Exporter (Country) among 190 countries, against the general trade analysis, which identifies the biggest importer or exporter.
To discover high-growth global markets and optimize your business strategy:
Click Here
Pricing
- Single User License$ 1,995
- Department License$ 2,400
- Site License$ 3,120
- Global License$ 3,795

Search
Thought Leadership and Analyst Meet


Our Clients
Related Reports
- India Switchgear Market Outlook (2026 - 2032) | Size, Share, Trends, Growth, Revenue, Forecast, Analysis, Value, Outlook
- Pakistan Contraceptive Implants Market (2025-2031) | Demand, Growth, Size, Share, Industry, Pricing Analysis, Competitive, Strategic Insights, Strategy, Consumer Insights, Analysis, Investment Trends, Opportunities, Revenue, Segments, Value, Segmentation, Supply, Forecast, Restraints, Outlook, Competition, Drivers, Trends, Companies, Challenges
- Sri Lanka Packaging Market (2026-2032) | Outlook, Competition, Drivers, Trends, Demand, Pricing Analysis, Competitive, Strategic Insights, Companies, Challenges, Strategy, Consumer Insights, Analysis, Investment Trends, Opportunities, Growth, Size, Share, Industry, Revenue, Segments, Value, Segmentation, Supply, Forecast, Restraints
- India Kids Watches Market (2026-2032) | Strategy, Consumer Insights, Analysis, Investment Trends, Opportunities, Growth, Size, Share, Industry, Revenue, Segments, Value, Segmentation, Supply, Forecast, Restraints, Outlook, Competition, Drivers, Trends, Demand, Pricing Analysis, Competitive, Strategic Insights, Companies, Challenges
- Saudi Arabia Core Assurance Service Market (2025-2031) | Strategy, Consumer Insights, Analysis, Investment Trends, Opportunities, Growth, Size, Share, Industry, Revenue, Segments, Value, Segmentation, Supply, Forecast, Restraints, Outlook, Competition, Drivers, Trends, Demand, Pricing Analysis, Competitive, Strategic Insights, Companies, Challenges
- Romania Uninterruptible Power Supply (UPS) Market (2026-2032) | Industry, Analysis, Revenue, Size, Forecast, Outlook, Value, Trends, Share, Growth & Companies
- Saudi Arabia Car Window Tinting Film, Paint Protection Film (PPF), and Ceramic Coating Market (2025-2031) | Strategy, Consumer Insights, Analysis, Investment Trends, Opportunities, Growth, Size, Share, Industry, Revenue, Segments, Value, Segmentation, Supply, Forecast, Restraints, Outlook, Competition, Drivers, Trends, Demand, Pricing Analysis, Competitive, Strategic Insights, Companies, Challenges
- South Africa Stationery Market (2025-2031) | Share, Size, Industry, Value, Growth, Revenue, Analysis, Trends, Segmentation & Outlook
- Afghanistan Rocking Chairs And Adirondack Chairs Market (2026-2032) | Size & Revenue, Competitive Landscape, Share, Segmentation, Industry, Value, Outlook, Analysis, Trends, Growth, Forecast, Companies
- Afghanistan Apparel Market (2026-2032) | Growth, Outlook, Industry, Segmentation, Forecast, Size, Companies, Trends, Value, Share, Analysis & Revenue
Industry Events and Analyst Meet

India EV Show 2026

EV tech India Expo 2026

Auto Tech Asia 2026

Battery Tech India 2026

Smart Production Solutions Guangzhou 2026
Whitepaper
- Middle East & Africa Commercial Security Market Click here to view more.
- Middle East & Africa Fire Safety Systems & Equipment Market Click here to view more.
- GCC Drone Market Click here to view more.
- Middle East Lighting Fixture Market Click here to view more.
- GCC Physical & Perimeter Security Market Click here to view more.
6WResearch In News
- Doha a strategic location for EV manufacturing hub: IPA Qatar
- Demand for luxury TVs surging in the GCC, says Samsung
- Empowering Growth: The Thriving Journey of Bangladesh’s Cable Industry
- Demand for luxury TVs surging in the GCC, says Samsung
- Video call with a traditional healer? Once unthinkable, it’s now common in South Africa
- Intelligent Buildings To Smooth GCC’s Path To Net Zero