Georgia Microbiological Testing Of Water Market (2026-2032) Outlook | Growth, Analysis, Share, Size, Companies, Trends, Value, Industry, Forecast & Revenue
Market Forecast By Pathogen Type (Legionella, Coliform, Salmonella, Vibrio, Clostridium, Others), By Water Type (Drinking & bottled water, Industrial water), By Type (Instruments, Test kits & reagents), By Industry Type (Pharmaceutical, Clinical, Food, Energy, Chemicals & material, Environmental) And Competitive Landscape
| Product Code: ETC333540 | Publication Date: Aug 2022 | Updated Date: Jul 2026 | Product Type: Market Research Report | |
| Publisher: 6Wresearch | Author: Ravi Bhandari | No. of Pages: 75 | No. of Figures: 35 | No. of Tables: 20 |
Georgia Microbiological Testing Of Water Market Size, Share & Growth Rate
The Georgia Microbiological Testing Of Water Market was estimated at USD 226 Million in 2025 and is projected to reach USD 301 Million by 2032, growing at a CAGR of 4.2% from 2026 to 2032. This upward trajectory is driven by the state's increasing commitment to water quality management and environmental protection, which has heightened the demand for comprehensive testing solutions. Additionally, heightened public awareness regarding waterborne pathogens and the regulatory push for compliance across various sectors further fuels market expansion.
Georgia Microbiological Testing Of Water Market Growth Rate Analysis (2021-2032)
The Georgia microbiological testing of water market is experiencing stable growth, reflecting an increasing emphasis on water safety and quality. With growth rates of 4.5% in 2021 and rising consistently to 5.1% in both 2023 and 2024, the sector benefits from heightened consumer demand for clean water, driven by public health concerns and regulatory pressures. Investments in advanced testing technologies are further propelling this market, reinforcing its significance in environmental monitoring. Although a slight dip to 4.9% is anticipated in 2025 to 2027, this is attributed to market saturation and operational constraints. However, the revival to 5.1% in 2032 underscores a resilient adaptation to evolving industry standards and ongoing digitalization in testing processes.
Georgia Microbiological Testing Of Water Market Year-wise Growth Rate and Key Drivers
This graph highlights how the Georgia Microbiological Testing Of Water Market has steadily grown over the past five years, supported by major growth factors.
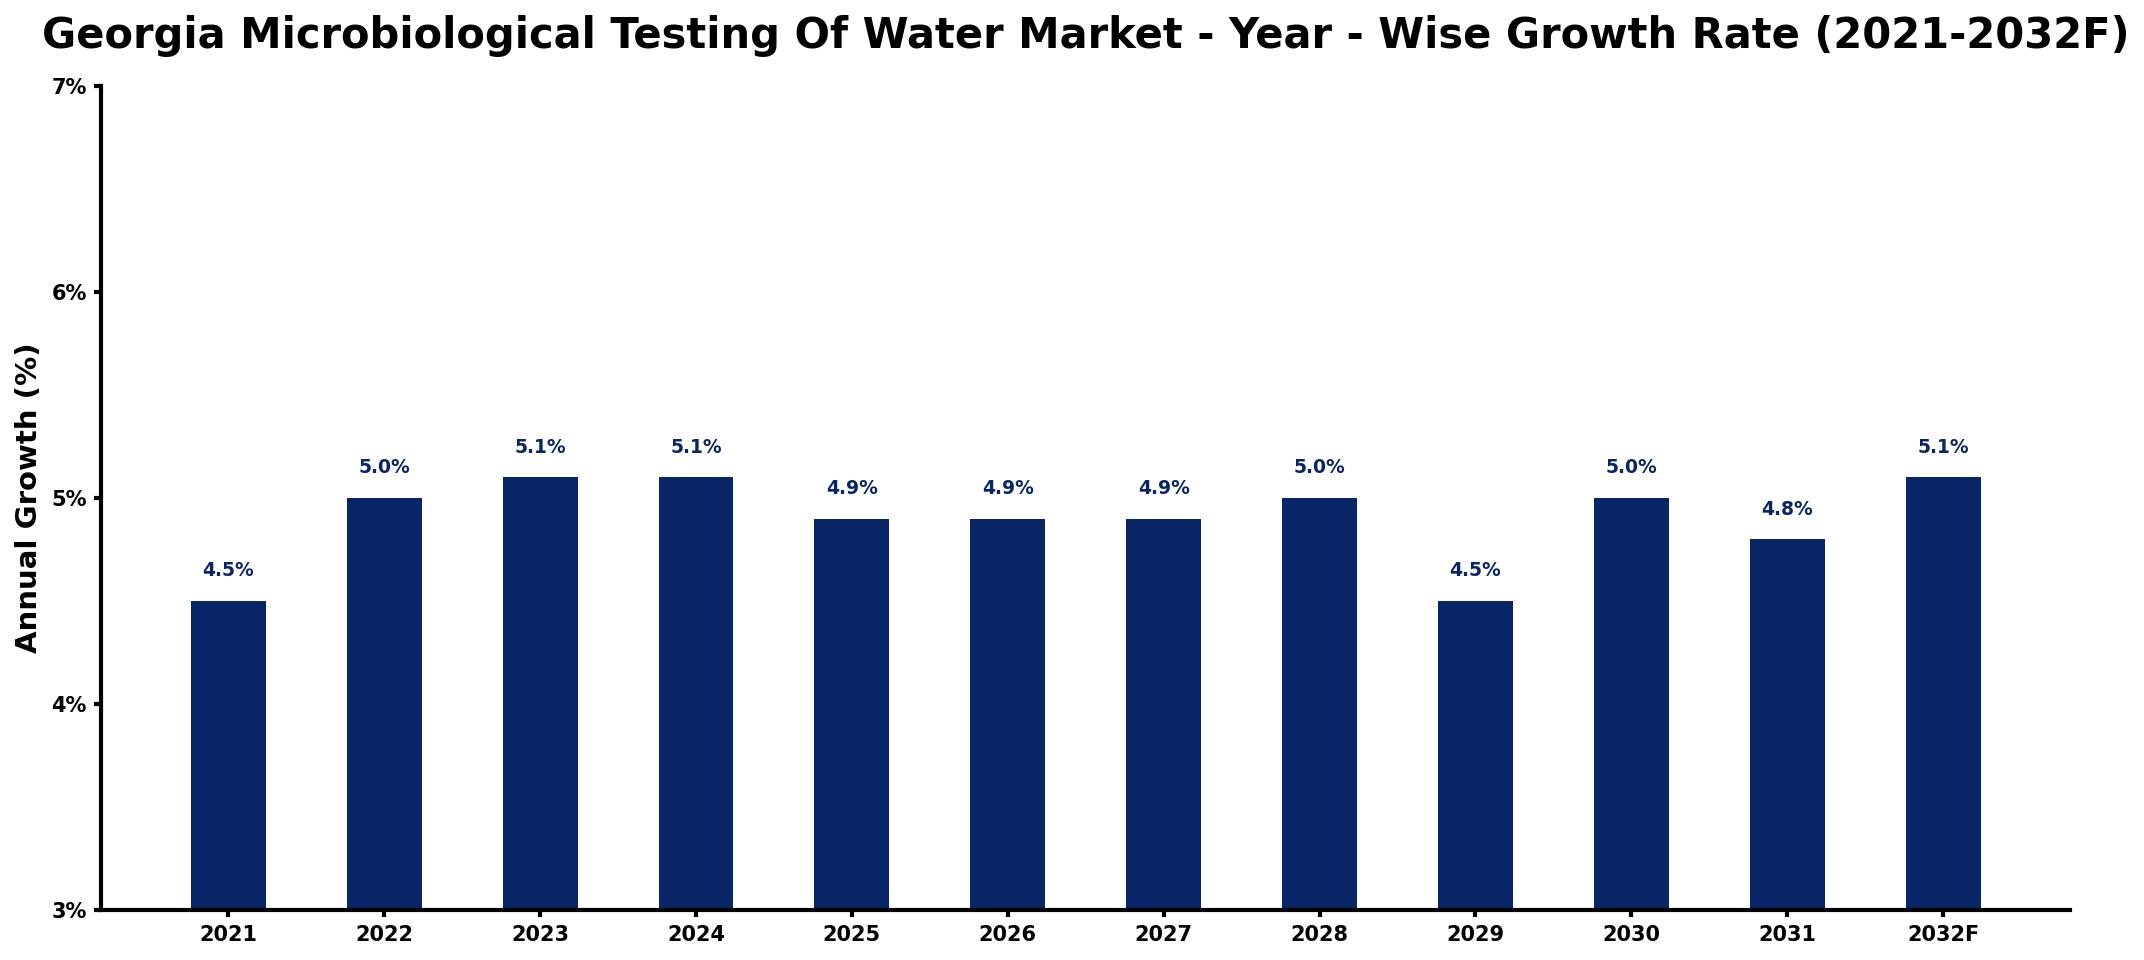
The table below presents the year‑wise growth rates along with the key drivers influencing the market
| Year | Growth Rate | Major Drivers |
| 2021 | 4.5% | Rising environmental regulations boost demand |
| 2022 | 5.0% | rising end-use demand growth |
| 2023 | 5.1% | Technological advancements enhance capabilities |
| 2024 | 5.1% | Growing industrial applications increase usage |
| 2025 | 4.9% | growing emerging market penetration |
| 2026 | 4.9% | Sustainable practices gain market traction |
| 2027 | 4.9% | Investment in infrastructure supports growth |
| 2028 | 5.0% | Consumer preferences shift towards safety |
| 2029 | 4.5% | Regulatory changes prompt market adjustment |
| 2030 | 5.0% | Emerging markets create new opportunities |
| 2031 | 4.8% | Partnerships foster innovation and expansion |
| 2032 | 5.1% | Research initiatives drive sector advancements |
Note: Market size estimations and growth projections presented in this report are based on 6Wresearch's proprietary forecasting methodology, utilizing the latest available industry data, government publications, and primary research inputs.
Georgia Microbiological Testing Of Water Market Synopsis
The foremost force currently shaping the Georgia Microbiological Testing Of Water Market is the escalating public health emphasis on water quality. With a growing recognition of the potential health risks posed by contaminated water, stakeholders across healthcare, environmental, and industrial sectors are increasingly reliant on microbiological testing to ensure compliance and safeguard public welfare.
As Georgia's population continues to grow, the demand for safe drinking water and effective wastewater management becomes ever more critical. This, paired with advancements in testing methodologies, positions the microbiological testing sector as a pivotal component in the states broader environmental strategy, aiming to maintain high standards of water safety and quality.
Georgia Microbiological Testing Of Water Market Key Takeaways
- The market is set for significant growth, driven by regulatory compliance and public health initiatives.
- Technological advancements in testing methods are enhancing accuracy and efficiency.
- Increased awareness surrounding waterborne diseases is driving demand across various industries.
- The states environmental protection policies are creating a conducive environment for market expansion.
- Laboratories face challenges related to turnaround time and equipment investments.
Evaluation of Restraints in Georgia Microbiological Testing Of Water Market
Despite the growth potential, the Georgia Microbiological Testing Of Water Market faces several restraints. The need for continuous investment in advanced testing technologies poses a financial burden for smaller laboratories, which may struggle to keep pace with more established entities. Furthermore, the competitive landscape coupled with pricing pressures from alternative testing solutions necessitates a focus on innovation and regulatory compliance. Additionally, issues around data interpretation and the speed of testing turnaround times present ongoing challenges for service providers aiming to meet increasing demand.
Georgia Microbiological Testing Of Water Market Trends
Several current and emerging trends are influencing the Georgia Microbiological Testing Of Water Market. The integration of automation and data analytics into testing processes is streamlining operations and improving result accuracy. Additionally, molecular testing techniques, such as PCR, are gaining traction due to their rapid detection capabilities. Environmental agencies are increasingly seeking real-time data to better monitor water quality, necessitating advancements in both technology and laboratory capabilities.
Georgia Microbiological Testing Of Water Market Opportunities
Opportunities for growth within the Georgia Microbiological Testing Of Water Market are plentiful, especially as industries adapt to stricter regulations. Increased public and private investment in laboratory infrastructure presents a pathway for technological advancements. Moreover, partnerships between governmental bodies and private sector laboratories can foster innovation and enhance service delivery, positioning stakeholders to better meet the rising demand for comprehensive water quality assessments.
Government Initiatives in the Georgia Microbiological Testing Of Water Market
The Georgia government is actively involved in promoting public health through various initiatives aimed at enhancing water quality and safety. Policies surrounding microbiological testing are designed to set stringent water quality standards, ensure compliance across sectors, and promote public health monitoring programs. These measures are critical in preventing waterborne diseases and protecting the health of Georgia's communities, underscoring the importance of robust microbiological testing protocols.
Future Insights of the Georgia Microbiological Testing Of Water Market
Looking ahead to the period between 2026 and 2032, the Georgia Microbiological Testing Of Water Market is poised for dynamic growth driven by technological advancements and evolving regulatory frameworks. Innovations in rapid testing methodologies and the adoption of real-time monitoring systems will likely become standard practices. Furthermore, as public health concerns continue to take precedence, the market is expected to adapt, with a focus on delivering highly accurate and timely results to meet the diverse needs of various stakeholders.
Georgia Microbiological Testing Of Water Market Latest Developments (2025 - 2026)
In recent months, the industry has witnessed a shift towards enhanced testing capabilities, with several laboratories investing in next-generation sequencing technologies to improve detection of waterborne pathogens. Moreover, collaborative efforts between state agencies and private entities have begun to emerge, aimed at streamlining testing protocols and addressing regulatory compliance more efficiently. These developments indicate a strong momentum towards improving water safety and quality management across Georgia.
Georgia Microbiological Testing Of Water Market - Key Attractiveness of the Report
- 10 Years of Market Numbers
- Historical Data Starting from 2022 to 2025
- Base Year: 2025
- Forecast Data until 2032
- Key Performance Indicators Impacting the Market
- Major Upcoming Developments and Projects
Key Highlights of the Report:
- Georgia Microbiological Testing Of Water Market Outlook
- Market Size of Georgia Microbiological Testing Of Water Market, 2025
- Forecast of Georgia Microbiological Testing Of Water Market, 2032
- Historical Data and Forecast of Georgia Microbiological Testing Of Water Revenues & Volume for the Period 2022-2032F
- Georgia Microbiological Testing Of Water Market Trend Evolution
- Georgia Microbiological Testing Of Water Market Drivers and Challenges
- Georgia Microbiological Testing Of Water Price Trends
- Georgia Microbiological Testing Of Water Porter's Five Forces
- Georgia Microbiological Testing Of Water Industry Life Cycle
- Historical Data and Forecast of Georgia Microbiological Testing Of Water Market Revenues & Volume By Pathogen Type for the Period 2022-2032F
- Historical Data and Forecast of Georgia Microbiological Testing Of Water Market Revenues & Volume By Legionella for the Period 2022-2032F
- Historical Data and Forecast of Georgia Microbiological Testing Of Water Market Revenues & Volume By Coliform for the Period 2022-2032F
- Historical Data and Forecast of Georgia Microbiological Testing Of Water Market Revenues & Volume By Salmonella for the Period 2022-2032F
- Historical Data and Forecast of Georgia Microbiological Testing Of Water Market Revenues & Volume By Vibrio for the Period 2022-2032F
- Historical Data and Forecast of Georgia Microbiological Testing Of Water Market Revenues & Volume By Clostridium for the Period 2022-2032F
- Historical Data and Forecast of Georgia Microbiological Testing Of Water Market Revenues & Volume By Others for the Period 2022-2032F
- Historical Data and Forecast of Georgia Microbiological Testing Of Water Market Revenues & Volume By Water Type for the Period 2022-2032F
- Historical Data and Forecast of Georgia Microbiological Testing Of Water Market Revenues & Volume By Drinking & bottled water for the Period 2022-2032F
- Historical Data and Forecast of Georgia Microbiological Testing Of Water Market Revenues & Volume By Industrial water for the Period 2022-2032F
- Historical Data and Forecast of Georgia Microbiological Testing Of Water Market Revenues & Volume By Type for the Period 2022-2032F
- Historical Data and Forecast of Georgia Microbiological Testing Of Water Market Revenues & Volume By Instruments for the Period 2022-2032F
- Historical Data and Forecast of Georgia Microbiological Testing Of Water Market Revenues & Volume By Test kits & reagents for the Period 2022-2032F
- Historical Data and Forecast of Georgia Microbiological Testing Of Water Market Revenues & Volume By Industry Type for the Period 2022-2032F
- Historical Data and Forecast of Georgia Microbiological Testing Of Water Market Revenues & Volume By Pharmaceutical for the Period 2022-2032F
- Historical Data and Forecast of Georgia Microbiological Testing Of Water Market Revenues & Volume By Clinical for the Period 2022-2032F
- Historical Data and Forecast of Georgia Microbiological Testing Of Water Market Revenues & Volume By Food for the Period 2022-2032F
- Historical Data and Forecast of Georgia Microbiological Testing Of Water Market Revenues & Volume By Energy for the Period 2022-2032F
- Historical Data and Forecast of Georgia Microbiological Testing Of Water Market Revenues & Volume By Chemicals & material for the Period 2022-2032F
- Historical Data and Forecast of Georgia Microbiological Testing Of Water Market Revenues & Volume By Environmental for the Period 2022-2032F
- Georgia Microbiological Testing Of Water Import Export Trade Statistics
- Market Opportunity Assessment By Pathogen Type
- Market Opportunity Assessment By Water Type
- Market Opportunity Assessment By Type
- Market Opportunity Assessment By Industry Type
- Georgia Microbiological Testing Of Water Top Companies Market Share
- Georgia Microbiological Testing Of Water Competitive Benchmarking By Technical and Operational Parameters
- Georgia Microbiological Testing Of Water Company Profiles
- Georgia Microbiological Testing Of Water Key Strategic Recommendations
Frequently Asked Questions About the Market Study (FAQs):
The primary growth drivers include increasing public awareness of water quality issues, the need for regulatory compliance across various sectors, and advancements in testing technologies.
The market was estimated at USD 226 Million in 2025, projected to reach USD 301 Million by 2032, growing at a CAGR of 4.2% from 2026 to 2032.
Technological advancements, particularly in automation and molecular testing, are revolutionizing testing methodologies, offering faster and more accurate detection of microbial contaminants.
Government policies are crucial in setting water quality standards and regulatory frameworks that promote rigorous microbiological testing to protect public health.
Competitive pressures necessitate continuous innovation and efficiency improvements among laboratories, as well as strategic pricing to remain competitive amidst alternative testing technologies.
6Wresearch actively monitors the Georgia Microbiological Testing Of Water Market and publishes its comprehensive annual report, highlighting emerging trends, growth drivers, revenue analysis, and forecast outlook. Our insights help businesses to make data-backed strategic decisions with ongoing market dynamics. Our analysts track relevent industries related to the Georgia Microbiological Testing Of Water Market, allowing our clients with actionable intelligence and reliable forecasts tailored to emerging regional needs.
Yes, we provide customisation as per your requirements. To learn more, feel free to contact us on sales@6wresearch.com
1 Executive Summary |
2 Introduction |
2.1 Key Highlights of the Report |
2.2 Report Description |
2.3 Market Scope & Segmentation |
2.4 Research Methodology |
2.5 Assumptions |
3 Georgia Microbiological Testing Of Water Market Overview |
3.1 Georgia Country Macro Economic Indicators |
3.2 Georgia Microbiological Testing Of Water Market Revenues & Volume, 2022 & 2032F |
3.3 Georgia Microbiological Testing Of Water Market - Industry Life Cycle |
3.4 Georgia Microbiological Testing Of Water Market - Porter's Five Forces |
3.5 Georgia Microbiological Testing Of Water Market Revenues & Volume Share, By Pathogen Type, 2022 & 2032F |
3.6 Georgia Microbiological Testing Of Water Market Revenues & Volume Share, By Water Type, 2022 & 2032F |
3.7 Georgia Microbiological Testing Of Water Market Revenues & Volume Share, By Type, 2022 & 2032F |
3.8 Georgia Microbiological Testing Of Water Market Revenues & Volume Share, By Industry Type, 2022 & 2032F |
4 Georgia Microbiological Testing Of Water Market Dynamics |
4.1 Impact Analysis |
4.2 Market Drivers |
4.2.1 Stringent regulations and standards related to water quality testing in Georgia |
4.2.2 Increasing awareness about waterborne diseases and the importance of testing |
4.2.3 Growth in population leading to higher demand for clean and safe water |
4.3 Market Restraints |
4.3.1 High initial setup costs for establishing microbiological testing facilities |
4.3.2 Lack of skilled professionals in the field of microbiological testing |
4.3.3 Limited access to advanced testing technologies in certain regions of Georgia |
5 Georgia Microbiological Testing Of Water Market Trends |
6 Georgia Microbiological Testing Of Water Market, By Types |
6.1 Georgia Microbiological Testing Of Water Market, By Pathogen Type |
6.1.1 Overview and Analysis |
6.1.2 Georgia Microbiological Testing Of Water Market Revenues & Volume, By Pathogen Type, 2022-2032F |
6.1.3 Georgia Microbiological Testing Of Water Market Revenues & Volume, By Legionella, 2022-2032F |
6.1.4 Georgia Microbiological Testing Of Water Market Revenues & Volume, By Coliform, 2022-2032F |
6.1.5 Georgia Microbiological Testing Of Water Market Revenues & Volume, By Salmonella, 2022-2032F |
6.1.6 Georgia Microbiological Testing Of Water Market Revenues & Volume, By Vibrio, 2022-2032F |
6.1.7 Georgia Microbiological Testing Of Water Market Revenues & Volume, By Clostridium, 2022-2032F |
6.1.8 Georgia Microbiological Testing Of Water Market Revenues & Volume, By Others, 2022-2032F |
6.2 Georgia Microbiological Testing Of Water Market, By Water Type |
6.2.1 Overview and Analysis |
6.2.2 Georgia Microbiological Testing Of Water Market Revenues & Volume, By Drinking & bottled water, 2022-2032F |
6.2.3 Georgia Microbiological Testing Of Water Market Revenues & Volume, By Industrial water, 2022-2032F |
6.3 Georgia Microbiological Testing Of Water Market, By Type |
6.3.1 Overview and Analysis |
6.3.2 Georgia Microbiological Testing Of Water Market Revenues & Volume, By Instruments, 2022-2032F |
6.3.3 Georgia Microbiological Testing Of Water Market Revenues & Volume, By Test kits & reagents, 2022-2032F |
6.4 Georgia Microbiological Testing Of Water Market, By Industry Type |
6.4.1 Overview and Analysis |
6.4.2 Georgia Microbiological Testing Of Water Market Revenues & Volume, By Pharmaceutical, 2022-2032F |
6.4.3 Georgia Microbiological Testing Of Water Market Revenues & Volume, By Clinical, 2022-2032F |
6.4.4 Georgia Microbiological Testing Of Water Market Revenues & Volume, By Food, 2022-2032F |
6.4.5 Georgia Microbiological Testing Of Water Market Revenues & Volume, By Energy, 2022-2032F |
6.4.6 Georgia Microbiological Testing Of Water Market Revenues & Volume, By Chemicals & material, 2022-2032F |
6.4.7 Georgia Microbiological Testing Of Water Market Revenues & Volume, By Environmental, 2022-2032F |
7 Georgia Microbiological Testing Of Water Market Import-Export Trade Statistics |
7.1 Georgia Microbiological Testing Of Water Market Export to Major Countries |
7.2 Georgia Microbiological Testing Of Water Market Imports from Major Countries |
8 Georgia Microbiological Testing Of Water Market Key Performance Indicators |
8.1 Percentage of water testing facilities in compliance with regulatory standards |
8.2 Number of public awareness campaigns and their impact on water testing awareness |
8.3 Growth in the number of water testing laboratories offering microbiological testing services |
9 Georgia Microbiological Testing Of Water Market - Opportunity Assessment |
9.1 Georgia Microbiological Testing Of Water Market Opportunity Assessment, By Pathogen Type, 2022 & 2032F |
9.2 Georgia Microbiological Testing Of Water Market Opportunity Assessment, By Water Type, 2022 & 2032F |
9.3 Georgia Microbiological Testing Of Water Market Opportunity Assessment, By Type, 2022 & 2032F |
9.4 Georgia Microbiological Testing Of Water Market Opportunity Assessment, By Industry Type, 2022 & 2032F |
10 Georgia Microbiological Testing Of Water Market - Competitive Landscape |
10.1 Georgia Microbiological Testing Of Water Market Revenue Share, By Companies, 2025 |
10.2 Georgia Microbiological Testing Of Water Market Competitive Benchmarking, By Operating and Technical Parameters |
11 Company Profiles |
12 Recommendations |
13 Disclaimer |
Global Go To Market Strategy - 2030
Export potential enables firms to identify high-growth global markets with greater confidence by combining advanced trade intelligence with a structured quantitative methodology. The framework analyzes emerging demand trends and country-level import patterns while integrating macroeconomic and trade datasets such as GDP and population forecasts, bilateral import–export flows, tariff structures, elasticity differentials between developed and developing economies, geographic distance, and import demand projections. Using weighted trade values from 2020–2024 as the base period to project country-to-country export potential for 2030, these inputs are operationalized through calculated drivers such as gravity model parameters, tariff impact factors, and projected GDP per-capita growth. Through an analysis of hidden potentials, demand hotspots, and market conditions that are most favorable to success, this method enables firms to focus on target countries, maximize returns, and global expansion with data, backed by accuracy.
By factoring in the projected importer demand gap that is currently unmet and could be potential opportunity, it identifies the potential for the Exporter (Country) among 190 countries, against the general trade analysis, which identifies the biggest importer or exporter.
To discover high-growth global markets and optimize your business strategy:
Click Here
Pricing
- Single User License$ 1,995
- Department License$ 2,400
- Site License$ 3,120
- Global License$ 3,795

Leadership Perspectives from Industry Events
Search
Thought Leadership and Analyst Meet


Our Clients
6WResearch In News
- India Air Conditioner Market Set for Strong Rebound in 2026 After Weather-Led Correction and GST-Driven Recovery: 6Wresearch
- ADAS in India: How Automatic Emergency Braking, Blind Spot Detection & Driver Monitoring are Transforming Road Safety
- Doha a strategic location for EV manufacturing hub: IPA Qatar
- Demand for luxury TVs surging in the GCC, says Samsung
- Empowering Growth: The Thriving Journey of Bangladesh’s Cable Industry
- Demand for luxury TVs surging in the GCC, says Samsung
Latest Reports
- Nicaragua RPG Gaming Market (2026-2032)
- New Zealand RPG Gaming Market (2026-2032)
- Netherlands RPG Gaming Market (2026-2032)
- Nauru RPG Gaming Market (2026-2032)
- Namibia RPG Gaming Market (2026-2032)
- Mozambique RPG Gaming Market (2026-2032)
- Montenegro RPG Gaming Market (2026-2032)
- Mongolia RPG Gaming Market (2026-2032)
- Monaco RPG Gaming Market (2026-2032)
- Micronesia RPG Gaming Market (2026-2032)
Industry Events and Analyst Meet

HIMTEX 2026

India Refining Summit 2026

India EV Show 2026

EV tech India Expo 2026

Auto Tech Asia 2026
Whitepaper
- Middle East & Africa Commercial Security Market Click here to view more.
- Middle East & Africa Fire Safety Systems & Equipment Market Click here to view more.
- GCC Drone Market Click here to view more.
- Middle East Lighting Fixture Market Click here to view more.
- GCC Physical & Perimeter Security Market Click here to view more.