Indonesia Bee Products Market | Analysis, Value, Revenue, Industry, Share, Trends, Outlook, Forecast, Growth, Size, Companies & COVID-19 IMPACT
Market Forecast By Product Type (Propolis, Honey, Others), By Application (Food Industry, Cosmetic Industry, Pharmaceutical Industry, Others) And Competitive Landscape
| Product Code: ETC170027 | Publication Date: Jul 2023 | Updated Date: Jan 2026 | Product Type: Market Research Report | |
| Publisher: 6Wresearch | Author: Ravi Bhandari | No. of Pages: 70 | No. of Figures: 35 | No. of Tables: 5 |
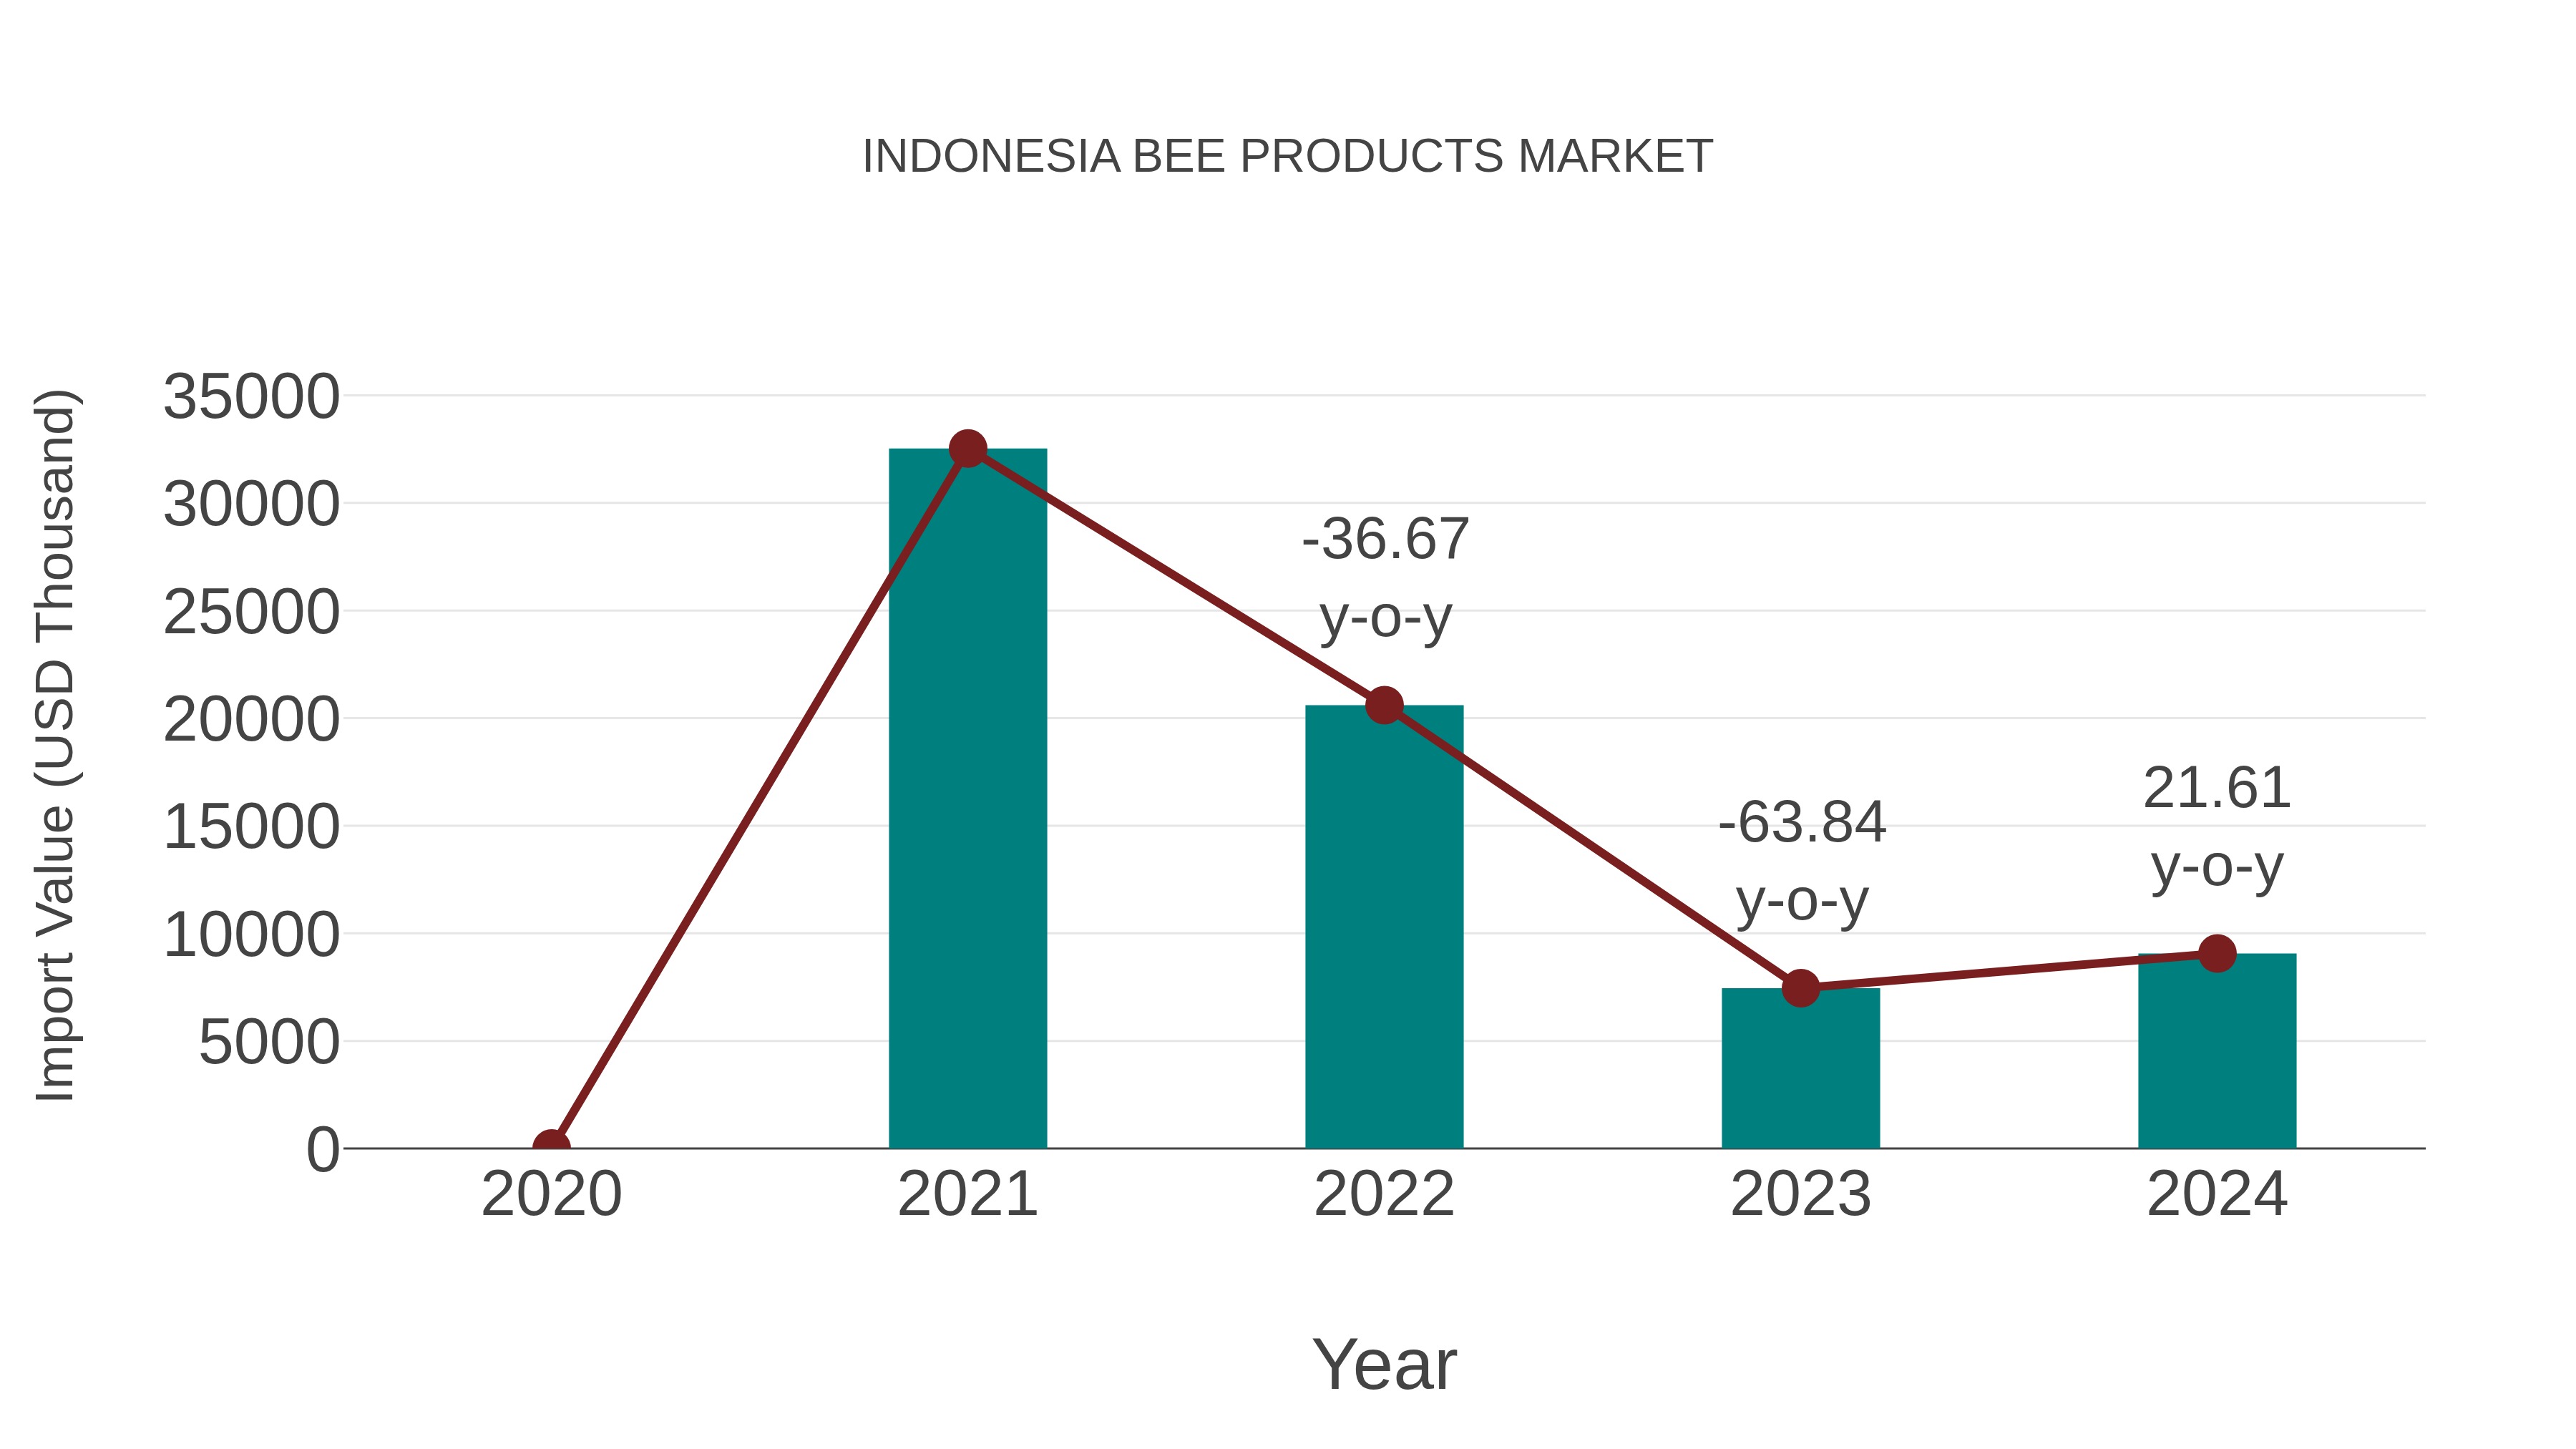
Indonesia Bee Products Market: Import Trend Analysis
Indonesia`s import trend for bee products in 2024 saw a growth rate of 21.61%, contrasting with a compound annual growth rate (CAGR) of -34.7% from 2020 to 2023. This notable recovery in import momentum from 2023 to 2024 could be attributed to a shift in demand dynamics or potentially favorable trade policies that stimulated market stability during the period.
Indonesia Bee Products MarketSynopsis
The Indonesia bee products market is expected to register a CAGR of 7.5% during the forecast period, 2020-2025. The country is one of the leading apiculture markets in Southeast Asia and has experienced steady growth over the past few years due to numerous initiatives taken by both government and private organizations for promoting beekeeping activities in the country.
Market Trends
One major trend driving growth within this industry is vertical integration wherein stakeholders are coming together with various companies along different points of production process like packaging firms etc., thus creating more efficient supply chains with improved cost savings at each stage Another significant development is that many local manufacturers have started developing their own brand labels for their primary and secondary outputs thereby enabling them to capture larger shares in regional markets apart from catering directly to domestic customers Additionally there has been a rise in multi-brand stores specialising solely on organic food items including bee related ones thereby providing further opportunities for producers operating within this sector.
Market Drivers
The growing awareness about the health benefits associated with consumption of natural bee based products continues being one of key drivers fuelling demand India?s food industry especially amongst millennials who prefer more nutritious alternatives when it comes dietary supplementation. Also evolving urban lifestyles accompanied by hectic work schedules have resulted increased preference ready -to eat meals resulting higher demand processed foods containing some form preservatives making way beeswax derivatives popular choice manufacturing units across nation create longer shelf lives product batches. This factor coupled increasing number permission granting authorities established own apiaries mostly rural areas well government sponsored subsidies provide ample support entrepreneurs venture into business hence contributing significantly towards overall market revenue stream.
COVID-19 Impact on the Market
The COVID-19 pandemic has had a major impact on the bee products market in Indonesia. The global lockdown and movement restrictions have caused disruption to production, supply chains, and demand for bee products. Trade restrictions at both national and international levels have further hampered the growth of this sector as well as export opportunities. Moreover, there is an overall decline in consumer spending due to economic downturns which has resulted in reduced sales of bee products such as honey, waxes, propolis etc., thereby hitting revenues of many companies operating within this space.
Challenges of the Market
The key challenges faced by companies operating within the Indonesia Bee Products Market include lack of awareness among consumers regarding health benefits associated with these natural ingredients; presence of counterfeit products resulting in loss of trust; limited access to finance for small & medium enterprises (SMEs) involved with production & distribution activities; high cost associated with product innovation initiatives; stringent regulations imposed by government agencies etc.
Industry Key Players
Some prominent players operating within the Indonesia Bee Products Market include Honeycraft PT Indah Kiat Tbk., Panglima Bee Farm Sdn Bhd., Gloryhoney Agro Industry Co Ltd., Anak Rimba Enterprise, Bali Bees Apiary Company Pvt Ltd., EcoBees Ltd., CV Permata Cengkeh Jaya Abadi etc.
Key Highlights of the Report:
- Indonesia Bee Products Market Outlook
- Market Size of Indonesia Bee Products Market, 2023
- Forecast of Indonesia Bee Products Market, 2030
- Historical Data and Forecast of Indonesia Bee Products Revenues & Volume for the Period 2020-2030
- Indonesia Bee Products Market Trend Evolution
- Indonesia Bee Products Market Drivers and Challenges
- Indonesia Bee Products Price Trends
- Indonesia Bee Products Porter's Five Forces
- Indonesia Bee Products Industry Life Cycle
- Historical Data and Forecast of Indonesia Bee Products Market Revenues & Volume By Product Type for the Period 2020-2030
- Historical Data and Forecast of Indonesia Bee Products Market Revenues & Volume By Propolis for the Period 2020-2030
- Historical Data and Forecast of Indonesia Bee Products Market Revenues & Volume By Honey for the Period 2020-2030
- Historical Data and Forecast of Indonesia Bee Products Market Revenues & Volume By Others for the Period 2020-2030
- Historical Data and Forecast of Indonesia Bee Products Market Revenues & Volume By Application for the Period 2020-2030
- Historical Data and Forecast of Indonesia Bee Products Market Revenues & Volume By Food Industry for the Period 2020-2030
- Historical Data and Forecast of Indonesia Bee Products Market Revenues & Volume By Cosmetic Industry for the Period 2020-2030
- Historical Data and Forecast of Indonesia Bee Products Market Revenues & Volume By Pharmaceutical Industry for the Period 2020-2030
- Historical Data and Forecast of Indonesia Bee Products Market Revenues & Volume By Others for the Period 2020-2030
- Indonesia Bee Products Import Export Trade Statistics
- Market Opportunity Assessment By Product Type
- Market Opportunity Assessment By Application
- Indonesia Bee Products Top Companies Market Share
- Indonesia Bee Products Competitive Benchmarking By Technical and Operational Parameters
- Indonesia Bee Products Company Profiles
- Indonesia Bee Products Key Strategic Recommendations
Frequently Asked Questions About the Market Study (FAQs):
6Wresearch actively monitors the Indonesia Bee Products Market and publishes its comprehensive annual report, highlighting emerging trends, growth drivers, revenue analysis, and forecast outlook. Our insights help businesses to make data-backed strategic decisions with ongoing market dynamics. Our analysts track relevent industries related to the Indonesia Bee Products Market, allowing our clients with actionable intelligence and reliable forecasts tailored to emerging regional needs.
Yes, we provide customisation as per your requirements. To learn more, feel free to contact us on sales@6wresearch.com
1 Executive Summary |
2 Introduction |
2.1 Key Highlights of the Report |
2.2 Report Description |
2.3 Market Scope & Segmentation |
2.4 Research Methodology |
2.5 Assumptions |
3 Indonesia Bee Products Market Overview |
3.1 Indonesia Country Macro Economic Indicators |
3.2 Indonesia Bee Products Market Revenues & Volume, 2020 & 2030F |
3.3 Indonesia Bee Products Market - Industry Life Cycle |
3.4 Indonesia Bee Products Market - Porter's Five Forces |
3.5 Indonesia Bee Products Market Revenues & Volume Share, By Product Type, 2020 & 2030F |
3.6 Indonesia Bee Products Market Revenues & Volume Share, By Application, 2020 & 2030F |
4 Indonesia Bee Products Market Dynamics |
4.1 Impact Analysis |
4.2 Market Drivers |
4.3 Market Restraints |
5 Indonesia Bee Products Market Trends |
6 Indonesia Bee Products Market, By Types |
6.1 Indonesia Bee Products Market, By Product Type |
6.1.1 Overview and Analysis |
6.1.2 Indonesia Bee Products Market Revenues & Volume, By Product Type, 2020-2030F |
6.1.3 Indonesia Bee Products Market Revenues & Volume, By Propolis, 2020-2030F |
6.1.4 Indonesia Bee Products Market Revenues & Volume, By Honey, 2020-2030F |
6.1.5 Indonesia Bee Products Market Revenues & Volume, By Others, 2020-2030F |
6.2 Indonesia Bee Products Market, By Application |
6.2.1 Overview and Analysis |
6.2.2 Indonesia Bee Products Market Revenues & Volume, By Food Industry, 2020-2030F |
6.2.3 Indonesia Bee Products Market Revenues & Volume, By Cosmetic Industry, 2020-2030F |
6.2.4 Indonesia Bee Products Market Revenues & Volume, By Pharmaceutical Industry, 2020-2030F |
6.2.5 Indonesia Bee Products Market Revenues & Volume, By Others, 2020-2030F |
7 Indonesia Bee Products Market Import-Export Trade Statistics |
7.1 Indonesia Bee Products Market Export to Major Countries |
7.2 Indonesia Bee Products Market Imports from Major Countries |
8 Indonesia Bee Products Market Key Performance Indicators |
9 Indonesia Bee Products Market - Opportunity Assessment |
9.1 Indonesia Bee Products Market Opportunity Assessment, By Product Type, 2020 & 2030F |
9.2 Indonesia Bee Products Market Opportunity Assessment, By Application, 2020 & 2030F |
10 Indonesia Bee Products Market - Competitive Landscape |
10.1 Indonesia Bee Products Market Revenue Share, By Companies, 2023 |
10.2 Indonesia Bee Products Market Competitive Benchmarking, By Operating and Technical Parameters |
11 Company Profiles |
12 Recommendations |
13 Disclaimer |
Export potential assessment - trade Analytics for 2030
Export potential enables firms to identify high-growth global markets with greater confidence by combining advanced trade intelligence with a structured quantitative methodology. The framework analyzes emerging demand trends and country-level import patterns while integrating macroeconomic and trade datasets such as GDP and population forecasts, bilateral import–export flows, tariff structures, elasticity differentials between developed and developing economies, geographic distance, and import demand projections. Using weighted trade values from 2020–2024 as the base period to project country-to-country export potential for 2030, these inputs are operationalized through calculated drivers such as gravity model parameters, tariff impact factors, and projected GDP per-capita growth. Through an analysis of hidden potentials, demand hotspots, and market conditions that are most favorable to success, this method enables firms to focus on target countries, maximize returns, and global expansion with data, backed by accuracy.
By factoring in the projected importer demand gap that is currently unmet and could be potential opportunity, it identifies the potential for the Exporter (Country) among 190 countries, against the general trade analysis, which identifies the biggest importer or exporter.
To discover high-growth global markets and optimize your business strategy:
Click Here
Pricing
- Single User License$ 1,995
- Department License$ 2,400
- Site License$ 3,120
- Global License$ 3,795

Search
Thought Leadership and Analyst Meet


Our Clients
Related Reports
- Pakistan Contraceptive Implants Market (2025-2031) | Demand, Growth, Size, Share, Industry, Pricing Analysis, Competitive, Strategic Insights, Strategy, Consumer Insights, Analysis, Investment Trends, Opportunities, Revenue, Segments, Value, Segmentation, Supply, Forecast, Restraints, Outlook, Competition, Drivers, Trends, Companies, Challenges
- Sri Lanka Packaging Market (2026-2032) | Outlook, Competition, Drivers, Trends, Demand, Pricing Analysis, Competitive, Strategic Insights, Companies, Challenges, Strategy, Consumer Insights, Analysis, Investment Trends, Opportunities, Growth, Size, Share, Industry, Revenue, Segments, Value, Segmentation, Supply, Forecast, Restraints
- India Kids Watches Market (2026-2032) | Strategy, Consumer Insights, Analysis, Investment Trends, Opportunities, Growth, Size, Share, Industry, Revenue, Segments, Value, Segmentation, Supply, Forecast, Restraints, Outlook, Competition, Drivers, Trends, Demand, Pricing Analysis, Competitive, Strategic Insights, Companies, Challenges
- Saudi Arabia Core Assurance Service Market (2025-2031) | Strategy, Consumer Insights, Analysis, Investment Trends, Opportunities, Growth, Size, Share, Industry, Revenue, Segments, Value, Segmentation, Supply, Forecast, Restraints, Outlook, Competition, Drivers, Trends, Demand, Pricing Analysis, Competitive, Strategic Insights, Companies, Challenges
- Romania Uninterruptible Power Supply (UPS) Market (2026-2032) | Industry, Analysis, Revenue, Size, Forecast, Outlook, Value, Trends, Share, Growth & Companies
- Saudi Arabia Car Window Tinting Film, Paint Protection Film (PPF), and Ceramic Coating Market (2025-2031) | Strategy, Consumer Insights, Analysis, Investment Trends, Opportunities, Growth, Size, Share, Industry, Revenue, Segments, Value, Segmentation, Supply, Forecast, Restraints, Outlook, Competition, Drivers, Trends, Demand, Pricing Analysis, Competitive, Strategic Insights, Companies, Challenges
- South Africa Stationery Market (2025-2031) | Share, Size, Industry, Value, Growth, Revenue, Analysis, Trends, Segmentation & Outlook
- Afghanistan Rocking Chairs And Adirondack Chairs Market (2026-2032) | Size & Revenue, Competitive Landscape, Share, Segmentation, Industry, Value, Outlook, Analysis, Trends, Growth, Forecast, Companies
- Afghanistan Apparel Market (2026-2032) | Growth, Outlook, Industry, Segmentation, Forecast, Size, Companies, Trends, Value, Share, Analysis & Revenue
- Canada Oil and Gas Market (2026-2032) | Share, Segmentation, Value, Industry, Trends, Forecast, Analysis, Size & Revenue, Growth, Competitive Landscape, Outlook, Companies
Industry Events and Analyst Meet

EV tech India Expo 2026

Auto Tech Asia 2026

Battery Tech India 2026

Smart Production Solutions Guangzhou 2026

Stationery & Paper Expo Saudi Arabia 2026
Whitepaper
- Middle East & Africa Commercial Security Market Click here to view more.
- Middle East & Africa Fire Safety Systems & Equipment Market Click here to view more.
- GCC Drone Market Click here to view more.
- Middle East Lighting Fixture Market Click here to view more.
- GCC Physical & Perimeter Security Market Click here to view more.
6WResearch In News
- Doha a strategic location for EV manufacturing hub: IPA Qatar
- Demand for luxury TVs surging in the GCC, says Samsung
- Empowering Growth: The Thriving Journey of Bangladesh’s Cable Industry
- Demand for luxury TVs surging in the GCC, says Samsung
- Video call with a traditional healer? Once unthinkable, it’s now common in South Africa
- Intelligent Buildings To Smooth GCC’s Path To Net Zero