Indonesia Benzoyl Peroxide Market (2026-2032) Outlook | Size, Trends, Revenue, Value, Industry, Growth, Analysis, Forecast, Companies & Share
Market Forecast By Type (50% Benzoyl Peroxide Powder, 50% Benzoyl Peroxide Paste, Others), By Application (Chemical and Plastics Industry, Building and Construction, Automotive and Transportation, Others) And Competitive Landscape
| Product Code: ETC314608 | Publication Date: Aug 2022 | Updated Date: Mar 2026 | Product Type: Market Research Report | |
| Publisher: 6Wresearch | Author: Ravi Bhandari | No. of Pages: 75 | No. of Figures: 35 | No. of Tables: 20 |
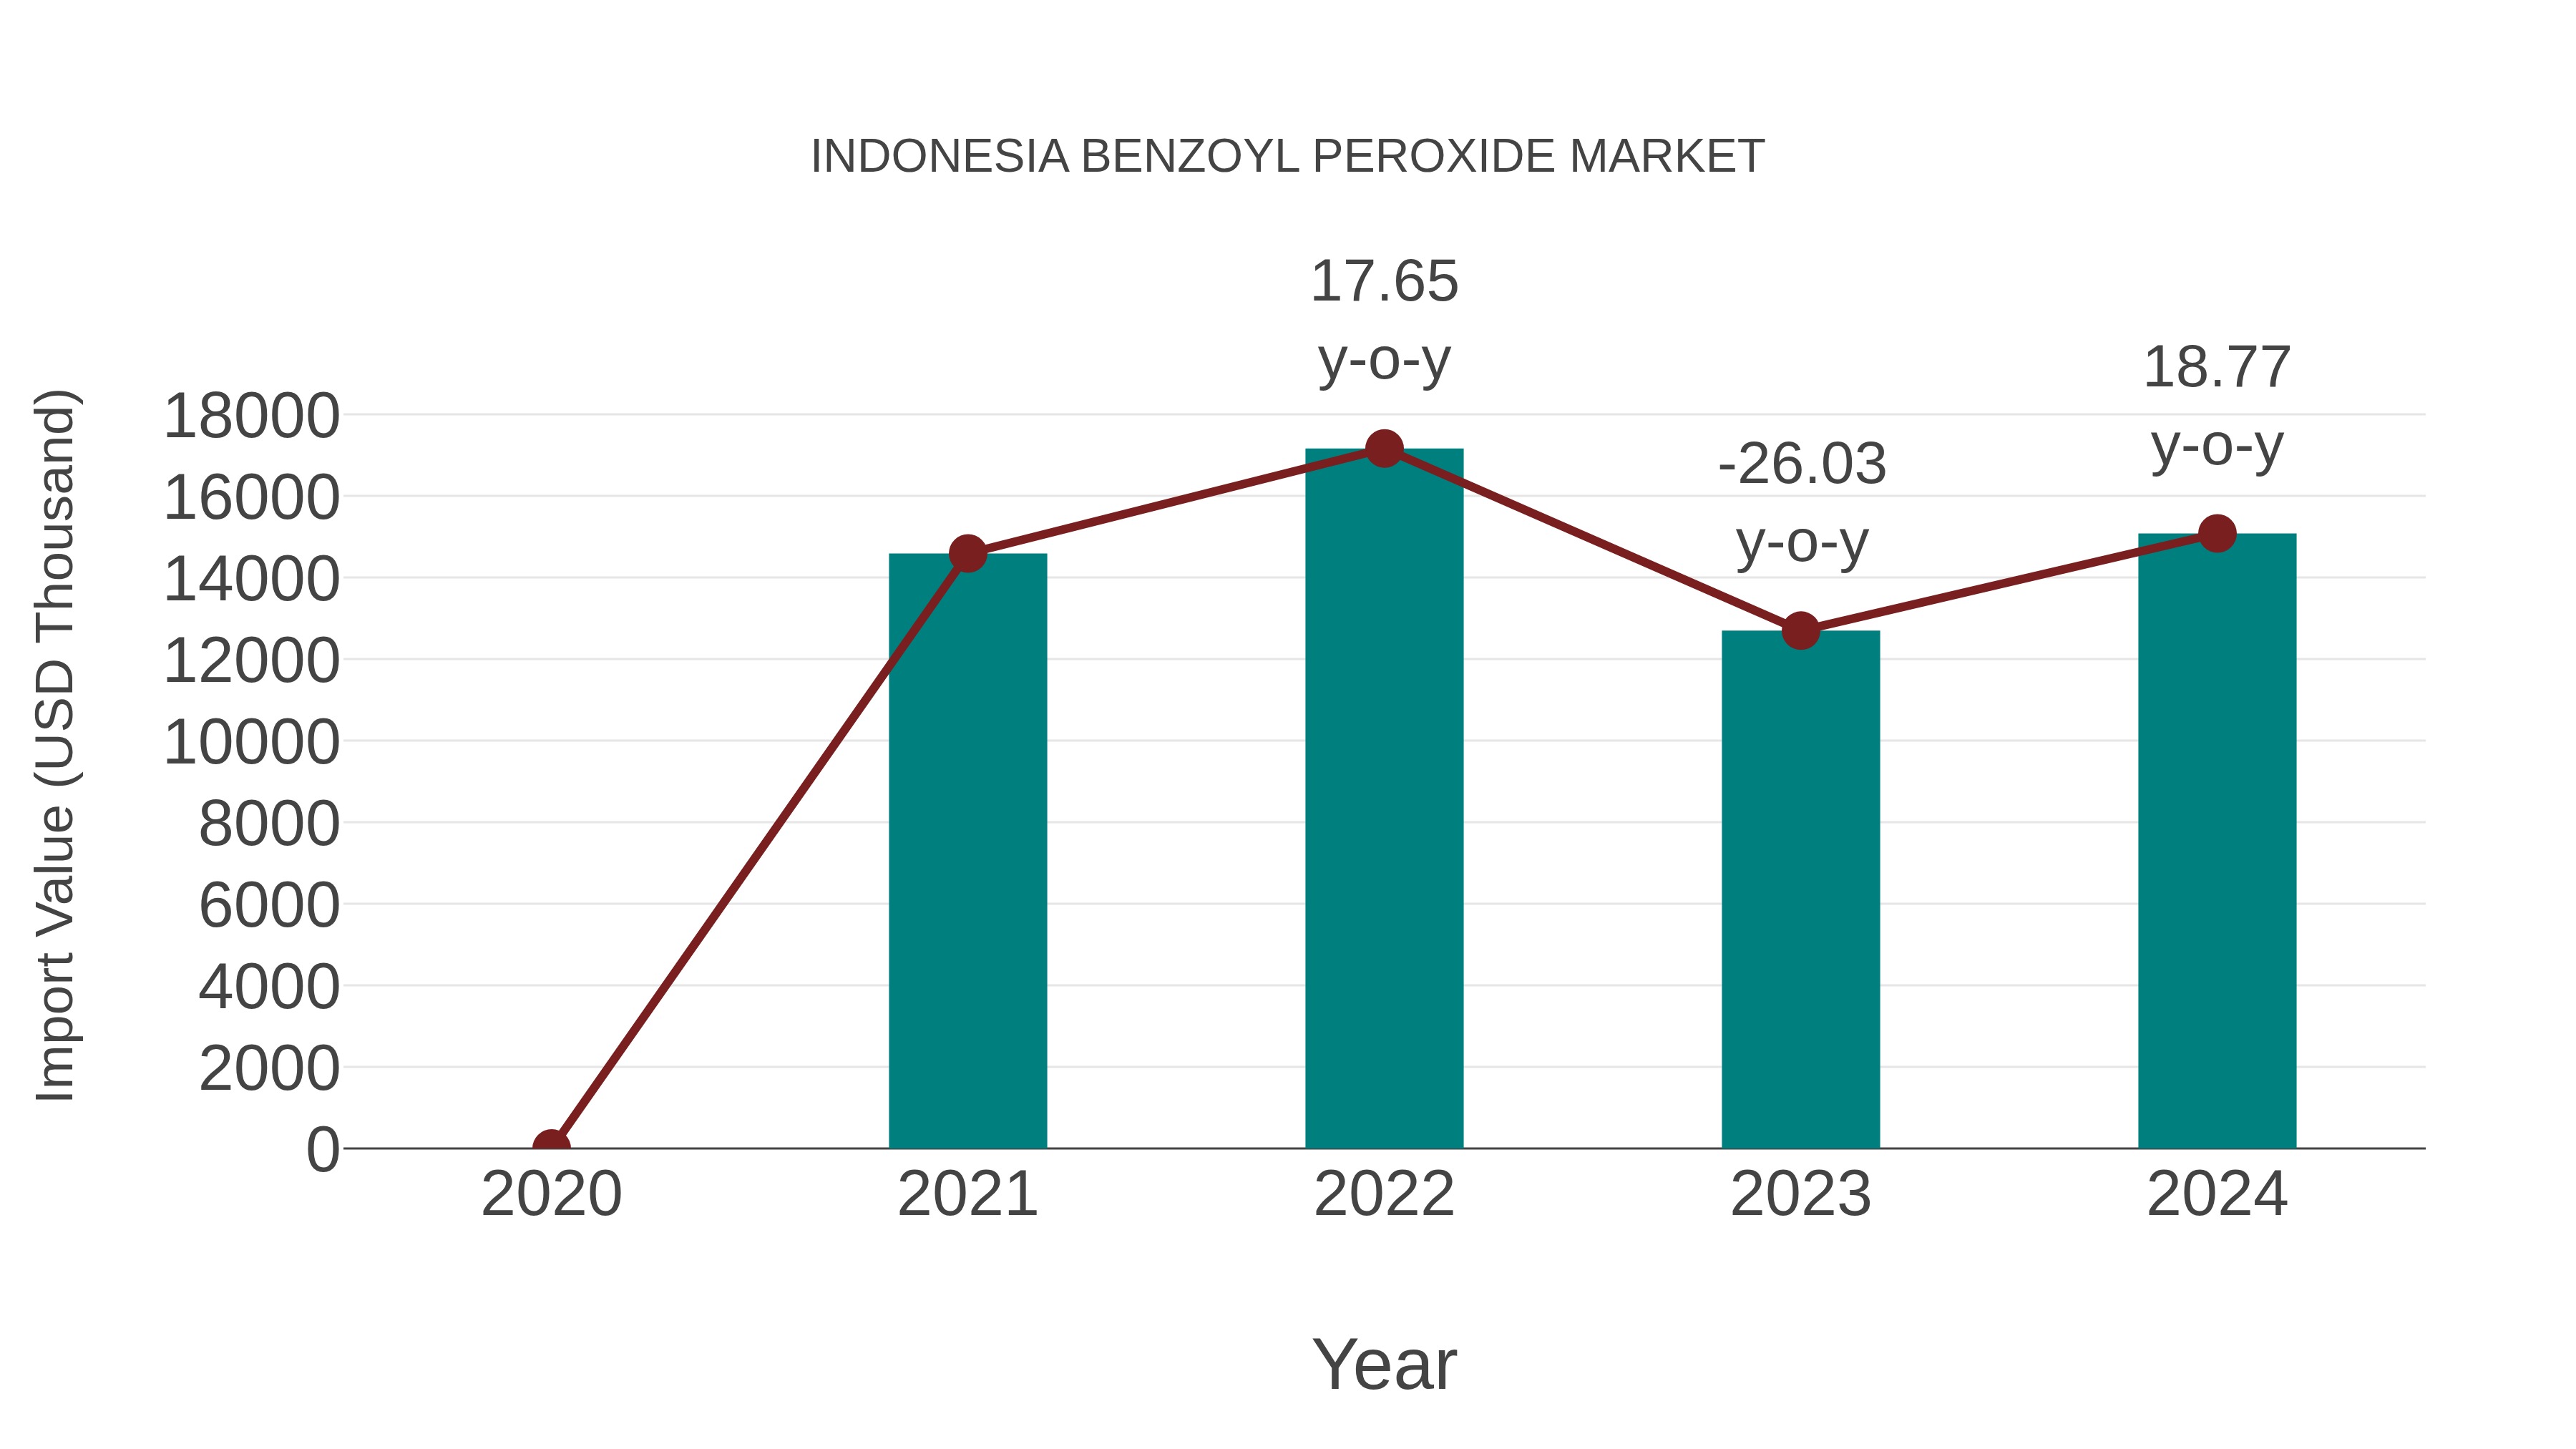
Indonesia Benzoyl Peroxide Market: Import Trend Analysis
Indonesia`s benzoyl peroxide market witnessed an 18.77% import growth rate from 2023 to 2024, with a compound annual growth rate (CAGR) of 1.11% from 2020 to 2024. This import momentum can be attributed to a notable demand shift towards skincare and pharmaceutical products, indicating market stability and consumer preference for benzoyl peroxide-based solutions during the period analyzed.
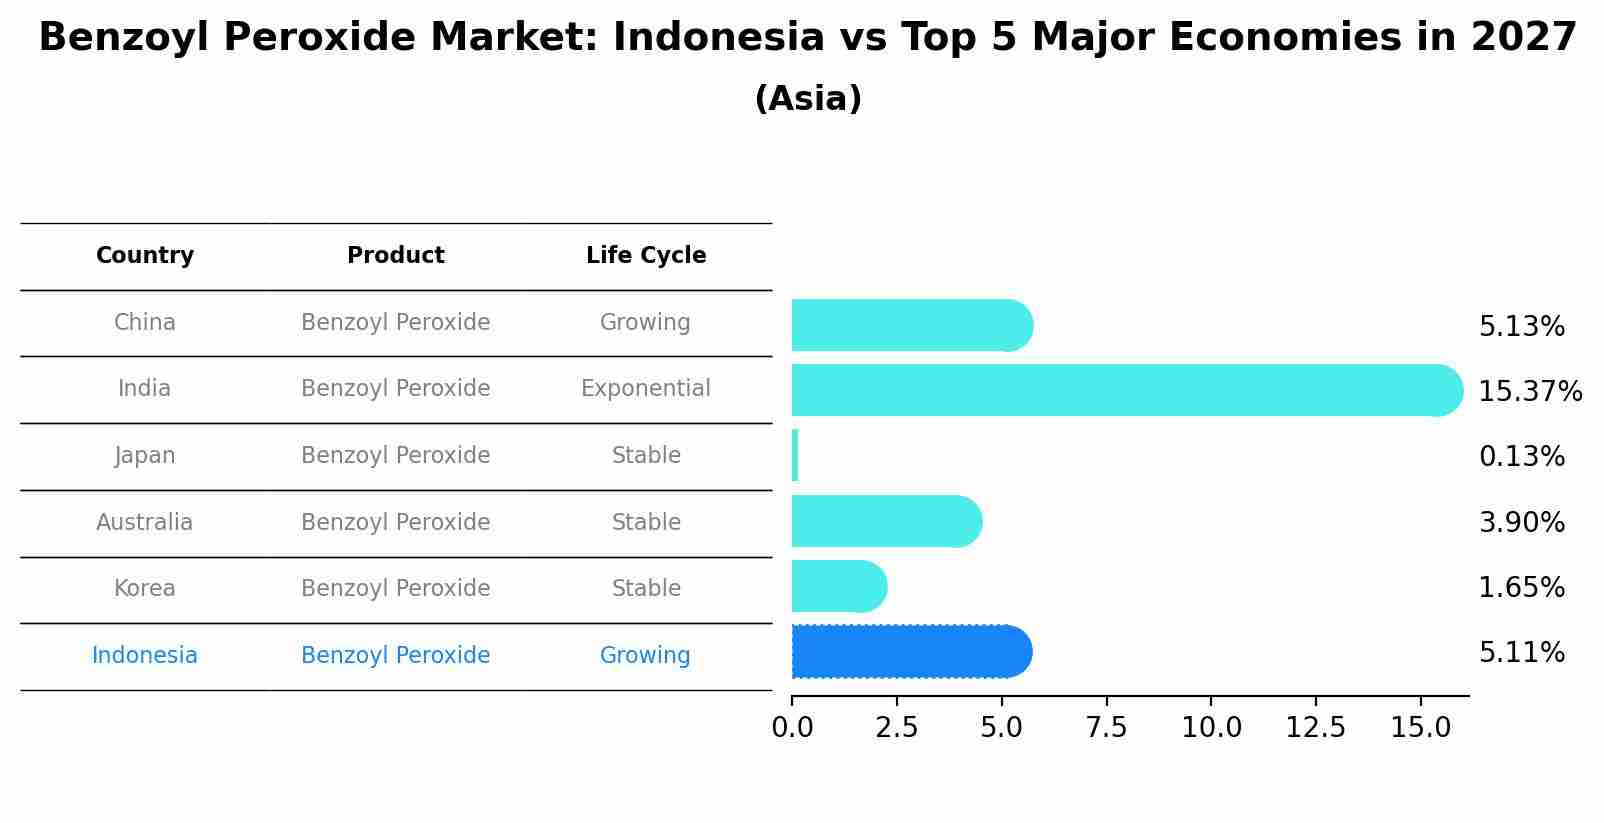
Benzoyl Peroxide Market: Indonesia vs Top 5 Major Economies in 2027 (Asia)
The Benzoyl Peroxide market in Indonesia is projected to grow at a growing growth rate of 5.11% by 2027, highlighting the country's increasing focus on advanced technologies within the Asia region, where China holds the dominant position, followed closely by India, Japan, Australia and South Korea, shaping overall regional demand.
Indonesia Benzoyl Peroxide Market Synopsis
The Indonesia benzoyl peroxide market was valued at USD xx million in 2025 and is projected to reach USD xx million by 2031, growing at a CAGR of xx% during the forecast period 2025-2031. The increasing usage of this material as an oxidation agent in various industries like food & beverages industry for bleaching flour; the pharmaceuticals sector for producing drugs; rubber industry for vulcanization process; and cosmetic industry for making soaps & detergents are propelling its sales across the country.
Drivers of the Market
The Indonesia Benzoyl Peroxide market is driven by the cosmetics and personal care industry, particularly in skincare products. The compound`s role in treating acne and its use as a bleaching agent for flour and hair contribute to its demand.
Challenges of the Market
Challenges in the Indonesia Benzoyl Peroxide market could include concerns about skin sensitivity and potential side effects in cosmetics and skincare products. Regulatory requirements for labeling and usage instructions may also impact its market growth.
COVID-19 Impact on the Market
The cosmetics and personal care industry, a major consumer of benzoyl peroxide, might have experienced shifts in demand patterns during the pandemic. Lockdowns, reduced social interactions, and economic uncertainty could have influenced consumer preferences for skincare products.
Key Players in the Market
Prominent participants in the Indonesia Benzoyl Peroxide market might include companies like PT. Lautan Luas Tbk and PT Prasidha Aneka Niaga Tbk. These entities could be involved in the production and distribution of Benzoyl Peroxide for cosmetic and industrial applications.
Key Highlights of the Report:
- Indonesia Benzoyl Peroxide Market Outlook
- Market Size of Indonesia Benzoyl Peroxide Market, 2025
- Forecast of Indonesia Benzoyl Peroxide Market, 2032
- Historical Data and Forecast of Indonesia Benzoyl Peroxide Revenues & Volume for the Period 2022-2032F
- Indonesia Benzoyl Peroxide Market Trend Evolution
- Indonesia Benzoyl Peroxide Market Drivers and Challenges
- Indonesia Benzoyl Peroxide Price Trends
- Indonesia Benzoyl Peroxide Porter's Five Forces
- Indonesia Benzoyl Peroxide Industry Life Cycle
- Historical Data and Forecast of Indonesia Benzoyl Peroxide Market Revenues & Volume By Type for the Period 2022-2032F
- Historical Data and Forecast of Indonesia Benzoyl Peroxide Market Revenues & Volume By 50% Benzoyl Peroxide Powder for the Period 2022-2032F
- Historical Data and Forecast of Indonesia Benzoyl Peroxide Market Revenues & Volume By 50% Benzoyl Peroxide Paste for the Period 2022-2032F
- Historical Data and Forecast of Indonesia Benzoyl Peroxide Market Revenues & Volume By Others for the Period 2022-2032F
- Historical Data and Forecast of Indonesia Benzoyl Peroxide Market Revenues & Volume By Application for the Period 2022-2032F
- Historical Data and Forecast of Indonesia Benzoyl Peroxide Market Revenues & Volume By Chemical and Plastics Industry for the Period 2022-2032F
- Historical Data and Forecast of Indonesia Benzoyl Peroxide Market Revenues & Volume By Building and Construction for the Period 2022-2032F
- Historical Data and Forecast of Indonesia Benzoyl Peroxide Market Revenues & Volume By Automotive and Transportation for the Period 2022-2032F
- Historical Data and Forecast of Indonesia Benzoyl Peroxide Market Revenues & Volume By Others for the Period 2022-2032F
- Indonesia Benzoyl Peroxide Import Export Trade Statistics
- Market Opportunity Assessment By Type
- Market Opportunity Assessment By Application
- Indonesia Benzoyl Peroxide Top Companies Market Share
- Indonesia Benzoyl Peroxide Competitive Benchmarking By Technical and Operational Parameters
- Indonesia Benzoyl Peroxide Company Profiles
- Indonesia Benzoyl Peroxide Key Strategic Recommendations
Indonesia Benzoyl Peroxide Market (2026-2032): FAQs
6Wresearch actively monitors the Indonesia Benzoyl Peroxide Market and publishes its comprehensive annual report, highlighting emerging trends, growth drivers, revenue analysis, and forecast outlook. Our insights help businesses to make data-backed strategic decisions with ongoing market dynamics. Our analysts track relevent industries related to the Indonesia Benzoyl Peroxide Market, allowing our clients with actionable intelligence and reliable forecasts tailored to emerging regional needs.
Yes, we provide customisation as per your requirements. To learn more, feel free to contact us on sales@6wresearch.com
1 Executive Summary |
2 Introduction |
2.1 Key Highlights of the Report |
2.2 Report Description |
2.3 Market Scope & Segmentation |
2.4 Research Methodology |
2.5 Assumptions |
3 Indonesia Benzoyl Peroxide Market Overview |
3.1 Indonesia Country Macro Economic Indicators |
3.2 Indonesia Benzoyl Peroxide Market Revenues & Volume, 2022 & 2032F |
3.3 Indonesia Benzoyl Peroxide Market - Industry Life Cycle |
3.4 Indonesia Benzoyl Peroxide Market - Porter's Five Forces |
3.5 Indonesia Benzoyl Peroxide Market Revenues & Volume Share, By Type, 2022 & 2032F |
3.6 Indonesia Benzoyl Peroxide Market Revenues & Volume Share, By Application, 2022 & 2032F |
4 Indonesia Benzoyl Peroxide Market Dynamics |
4.1 Impact Analysis |
4.2 Market Drivers |
4.2.1 Increasing awareness about skincare and acne treatment |
4.2.2 Growing demand for cosmetic and personal care products |
4.2.3 Rise in disposable income leading to higher spending on skincare products |
4.3 Market Restraints |
4.3.1 Stringent regulations on the use of benzoyl peroxide in skincare products |
4.3.2 Presence of alternative acne treatment options in the market |
5 Indonesia Benzoyl Peroxide Market Trends |
6 Indonesia Benzoyl Peroxide Market, By Types |
6.1 Indonesia Benzoyl Peroxide Market, By Type |
6.1.1 Overview and Analysis |
6.1.2 Indonesia Benzoyl Peroxide Market Revenues & Volume, By Type, 2022-2032F |
6.1.3 Indonesia Benzoyl Peroxide Market Revenues & Volume, By 50% Benzoyl Peroxide Powder, 2022-2032F |
6.1.4 Indonesia Benzoyl Peroxide Market Revenues & Volume, By 50% Benzoyl Peroxide Paste, 2022-2032F |
6.1.5 Indonesia Benzoyl Peroxide Market Revenues & Volume, By Others, 2022-2032F |
6.2 Indonesia Benzoyl Peroxide Market, By Application |
6.2.1 Overview and Analysis |
6.2.2 Indonesia Benzoyl Peroxide Market Revenues & Volume, By Chemical and Plastics Industry, 2022-2032F |
6.2.3 Indonesia Benzoyl Peroxide Market Revenues & Volume, By Building and Construction, 2022-2032F |
6.2.4 Indonesia Benzoyl Peroxide Market Revenues & Volume, By Automotive and Transportation, 2022-2032F |
6.2.5 Indonesia Benzoyl Peroxide Market Revenues & Volume, By Others, 2022-2032F |
7 Indonesia Benzoyl Peroxide Market Import-Export Trade Statistics |
7.1 Indonesia Benzoyl Peroxide Market Export to Major Countries |
7.2 Indonesia Benzoyl Peroxide Market Imports from Major Countries |
8 Indonesia Benzoyl Peroxide Market Key Performance Indicators |
8.1 Consumer satisfaction rate with benzoyl peroxide products |
8.2 Number of new product launches containing benzoyl peroxide |
8.3 Percentage of dermatologists recommending benzoyl peroxide for acne treatment |
9 Indonesia Benzoyl Peroxide Market - Opportunity Assessment |
9.1 Indonesia Benzoyl Peroxide Market Opportunity Assessment, By Type, 2022 & 2032F |
9.2 Indonesia Benzoyl Peroxide Market Opportunity Assessment, By Application, 2022 & 2032F |
10 Indonesia Benzoyl Peroxide Market - Competitive Landscape |
10.1 Indonesia Benzoyl Peroxide Market Revenue Share, By Companies, 2025 |
10.2 Indonesia Benzoyl Peroxide Market Competitive Benchmarking, By Operating and Technical Parameters |
11 Company Profiles |
12 Recommendations |
13 Disclaimer |
Export potential assessment - trade Analytics for 2030
Export potential enables firms to identify high-growth global markets with greater confidence by combining advanced trade intelligence with a structured quantitative methodology. The framework analyzes emerging demand trends and country-level import patterns while integrating macroeconomic and trade datasets such as GDP and population forecasts, bilateral import–export flows, tariff structures, elasticity differentials between developed and developing economies, geographic distance, and import demand projections. Using weighted trade values from 2020–2024 as the base period to project country-to-country export potential for 2030, these inputs are operationalized through calculated drivers such as gravity model parameters, tariff impact factors, and projected GDP per-capita growth. Through an analysis of hidden potentials, demand hotspots, and market conditions that are most favorable to success, this method enables firms to focus on target countries, maximize returns, and global expansion with data, backed by accuracy.
By factoring in the projected importer demand gap that is currently unmet and could be potential opportunity, it identifies the potential for the Exporter (Country) among 190 countries, against the general trade analysis, which identifies the biggest importer or exporter.
To discover high-growth global markets and optimize your business strategy:
Click Here
Pricing
- Single User License$ 1,995
- Department License$ 2,400
- Site License$ 3,120
- Global License$ 3,795

Search
Thought Leadership and Analyst Meet


Our Clients
Latest Reports
- France Thermally Conductive Filler Dispersants Market (2026-2032) | Challenges, Restraints, Value, Share, Size, segmentation, Analysis, Trends, Investment Opportunities, Outlook, Pricing, Demand, Forecast, Revenue, Companies, Growth, Drivers, Strategy, Insights, Competition
- Egypt Thermally Conductive Filler Dispersants Market (2026-2032) | Competition, Forecast, Strategy, Value, Insights, Outlook, Investment Opportunities, Pricing, Demand, Share, segmentation, Drivers, Size, Companies, Restraints, Growth, Trends, Revenue, Challenges, Analysis
- Czech Republic Thermally Conductive Filler Dispersants Market (2026-2032) | Forecast, Pricing, Analysis, Drivers, Insights, Size, Demand, Growth, Challenges, segmentation, Competition, Outlook, Trends, Investment Opportunities, Companies, Strategy, Revenue, Share, Value, Restraints
- Colombia Thermally Conductive Filler Dispersants Market (2026-2032) | segmentation, Trends, Share, Drivers, Strategy, Companies, Demand, Insights, Size, Challenges, Value, Competition, Analysis, Growth, Revenue, Restraints, Forecast, Pricing, Outlook, Investment Opportunities
- China Thermally Conductive Filler Dispersants Market (2026-2032) | Restraints, Investment Opportunities, Pricing, Companies, Share, Size, Challenges, Trends, Outlook, Value, Analysis, Competition, Revenue, Drivers, Forecast, Demand, Insights, Growth, Strategy, segmentation
- Chile Thermally Conductive Filler Dispersants Market (2026-2032) | Investment Opportunities, Trends, Value, Restraints, Share, Companies, Forecast, segmentation, Pricing, Challenges, Demand, Size, Analysis, Drivers, Outlook, Growth, Competition, Strategy, Revenue, Insights
- Cambodia Thermally Conductive Filler Dispersants Market (2026-2032) | Analysis, Share, Outlook, Strategy, Pricing, Demand, Size, Growth, segmentation, Insights, Revenue, Forecast, Challenges, Competition, Companies, Investment Opportunities, Trends, Restraints, Value, Drivers
- Brazil Thermally Conductive Filler Dispersants Market (2026-2032) | Restraints, Forecast, Competition, Size, Revenue, Value, Investment Opportunities, Trends, Insights, Outlook, Growth, Analysis, Drivers, segmentation, Pricing, Challenges, Strategy, Share, Companies, Demand
- Bangladesh Thermally Conductive Filler Dispersants Market (2026-2032) | Restraints, Trends, Analysis, Competition, Insights, Forecast, Value, Investment Opportunities, Pricing, Share, Demand, Outlook, Revenue, segmentation, Companies, Drivers, Growth, Size, Challenges, Strategy
- Bahrain Thermally Conductive Filler Dispersants Market (2026-2032) | Trends, Outlook, Pricing, Demand, Value, Competition, Forecast, Growth, segmentation, Revenue, Companies, Analysis, Insights, Size, Drivers, Challenges, Strategy, Investment Opportunities, Share, Restraints
Industry Events and Analyst Meet

HIMTEX 2026

India Refining Summit 2026

India EV Show 2026

EV tech India Expo 2026

Auto Tech Asia 2026
Whitepaper
- Middle East & Africa Commercial Security Market Click here to view more.
- Middle East & Africa Fire Safety Systems & Equipment Market Click here to view more.
- GCC Drone Market Click here to view more.
- Middle East Lighting Fixture Market Click here to view more.
- GCC Physical & Perimeter Security Market Click here to view more.
6WResearch In News
- Doha a strategic location for EV manufacturing hub: IPA Qatar
- Demand for luxury TVs surging in the GCC, says Samsung
- Empowering Growth: The Thriving Journey of Bangladesh’s Cable Industry
- Demand for luxury TVs surging in the GCC, says Samsung
- Video call with a traditional healer? Once unthinkable, it’s now common in South Africa
- Intelligent Buildings To Smooth GCC’s Path To Net Zero