Indonesia Cake Mixes Market (2026-2032) Outlook | Value, Trends, Analysis, Companies, Revenue, Industry, Forecast, Size, Growth & Share
Market Forecast By Flavor (Chocolate, Vanilla, Fruit, Others), By Distribution Channel (Online, Offline) And Competitive Landscape
| Product Code: ETC085307 | Publication Date: Jul 2023 | Updated Date: Mar 2026 | Product Type: Report | |
| Publisher: 6Wresearch | Author: Ravi Bhandari | No. of Pages: 70 | No. of Figures: 35 | No. of Tables: 5 |
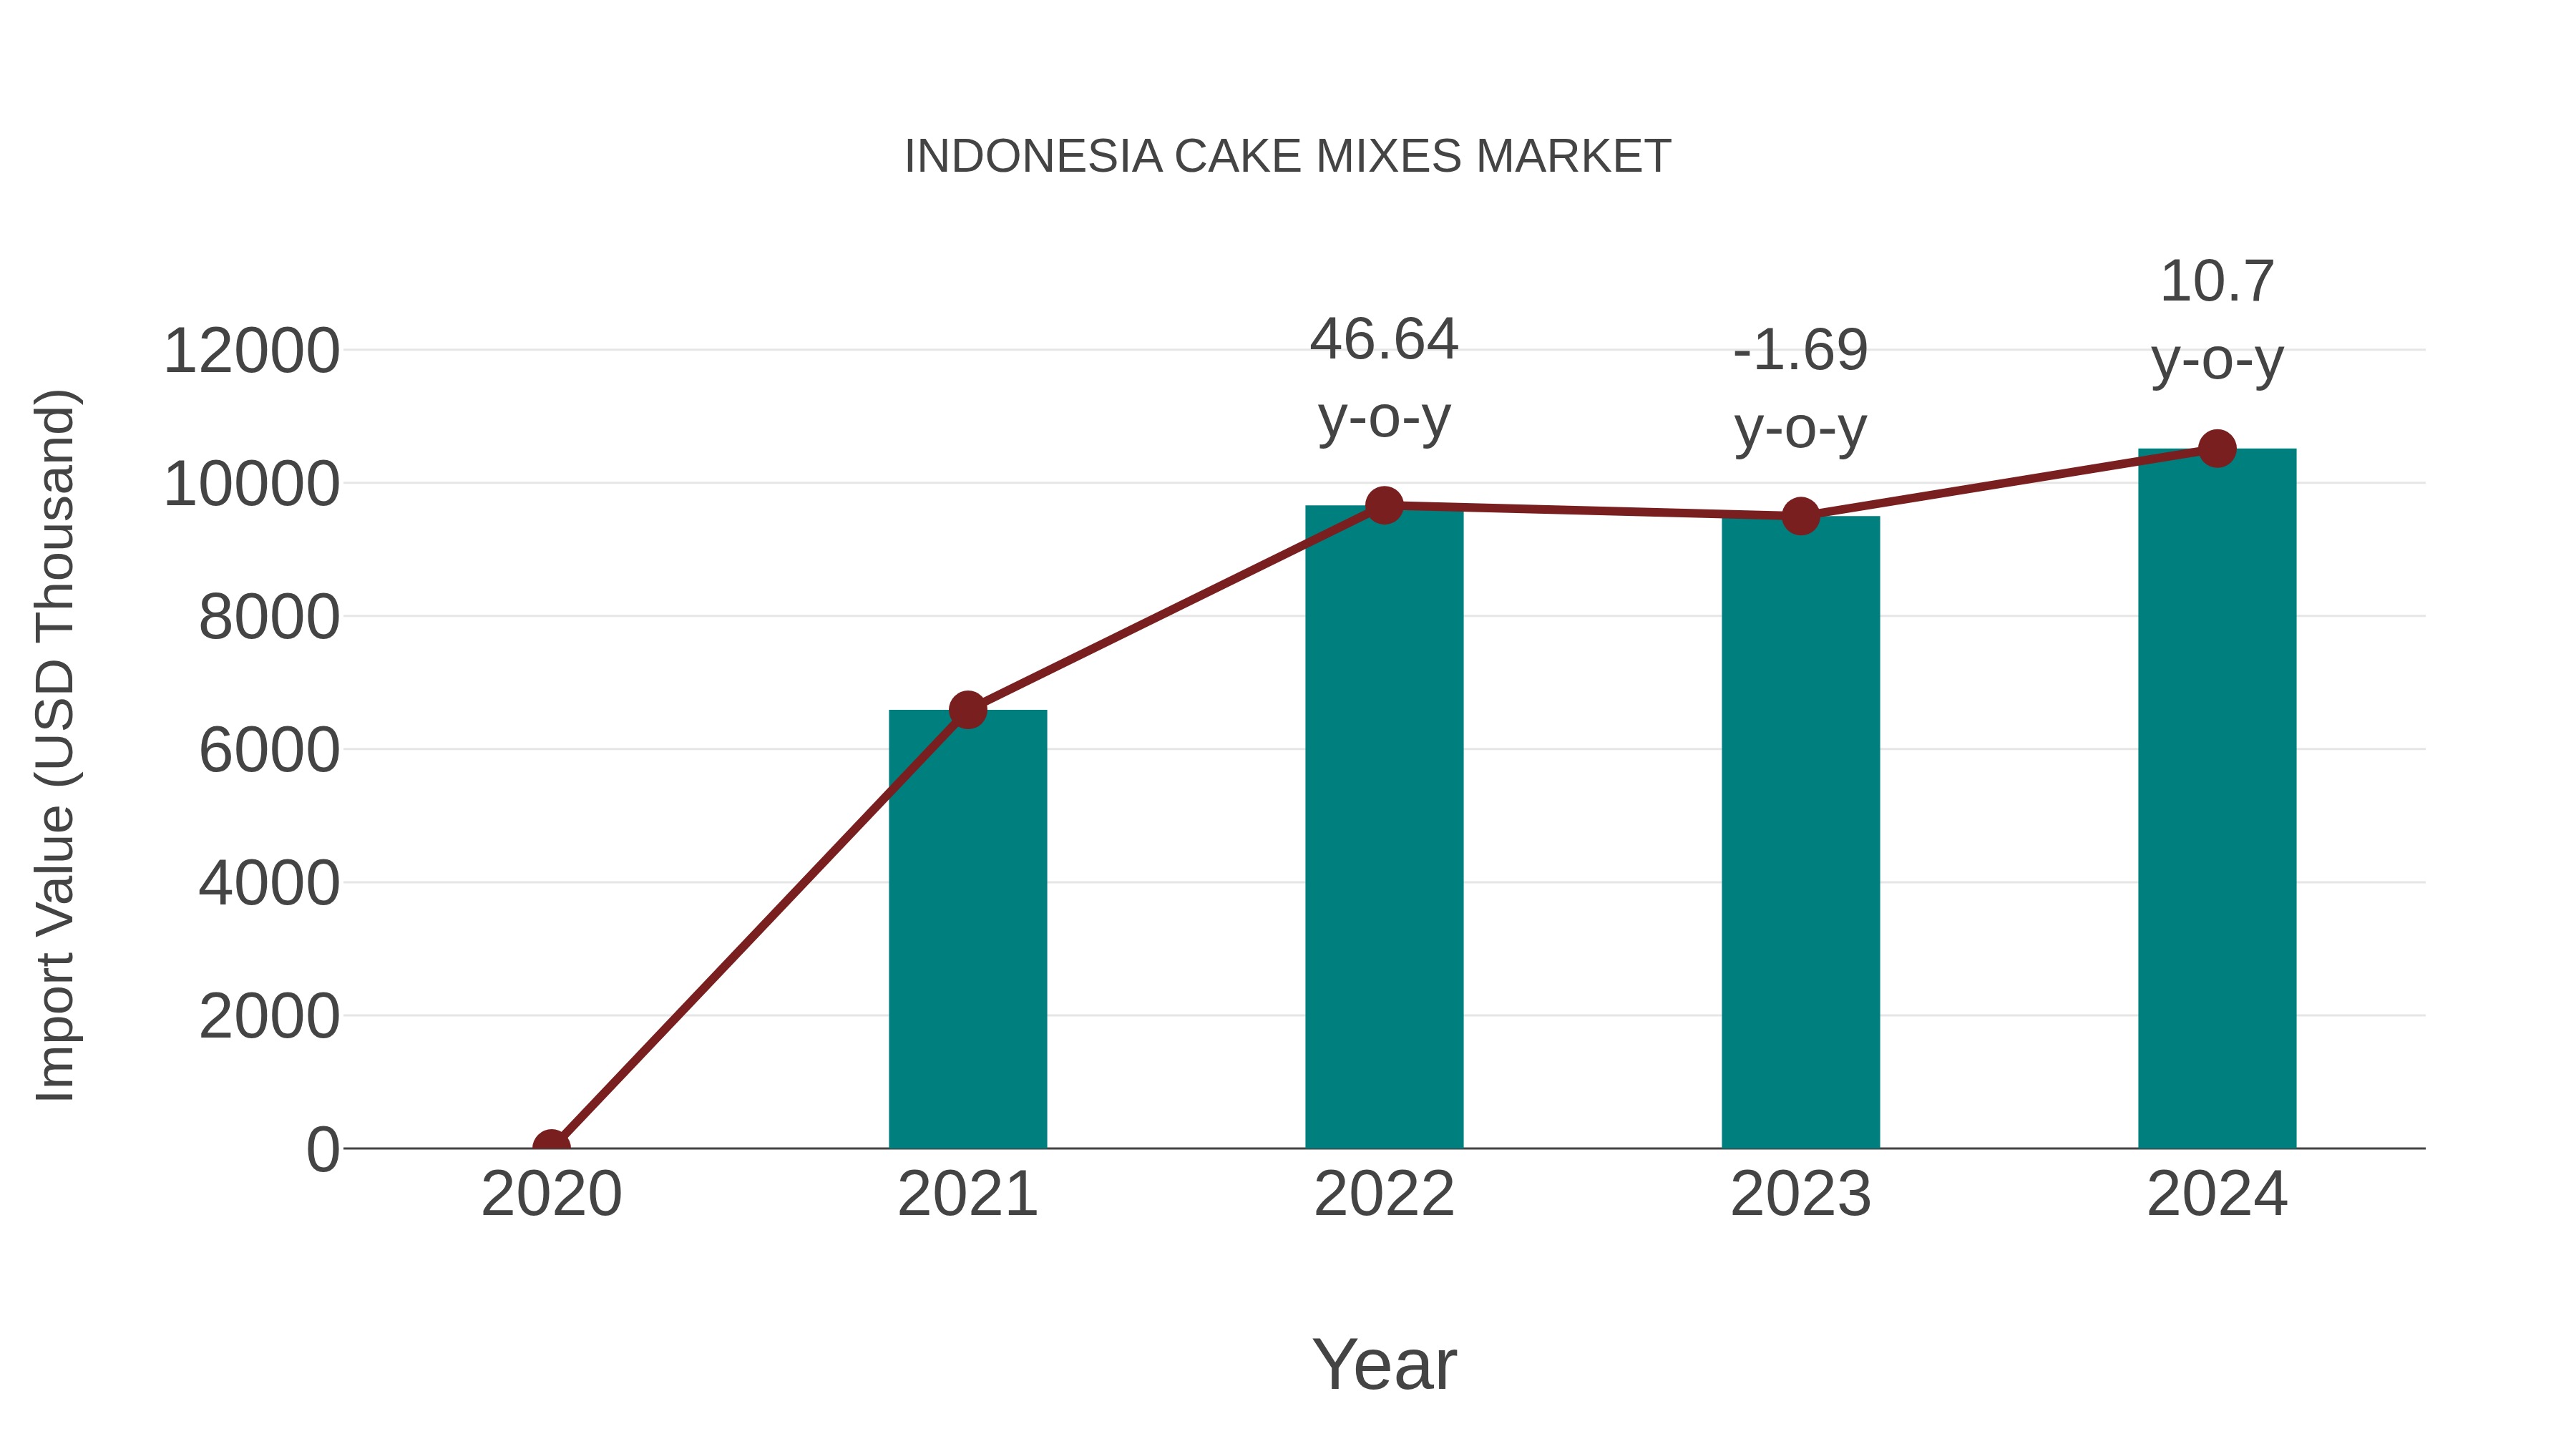
Indonesia Cake Mixes Market: Import Trend Analysis
In the Indonesia cake mixes market, the import trend showed a notable growth rate of 10.7% from 2023 to 2024, with a compound annual growth rate (CAGR) of 16.86% for the period 2020-2024. This import momentum can be attributed to increasing consumer demand for diverse cake options, reflecting a shift towards convenience and variety in baked goods consumption.
Indonesia Cake Mixes MarketSynopsis
The Indonesia cake mixes market is expected to witness a healthy growth during the forecast period. This can be attributed to various factors such as increasing disposable incomes, rising urbanization and changing lifestyles of consumers that have resulted in an increase in demand for convenience food products. Moreover, strong distribution networks of key players, aggressive marketing strategies adopted by some leading brands and availability of different flavors are further contributing to the growth of this market. The COVID-19 pandemic has led to significant disruptions in global supply chains resulting in increased delays or shortfalls in production and delivery schedules across all industries including food & beverage sector.
Market Trends
There has been an increasing trend towards premium cakes mixes with higher quality ingredients being used for baking purposes. Additionally, new flavors such as red velvet cake mix are gaining popularity among consumers due to their unique taste profile. Furthermore, companies are also offering sugar free versions which appeal to health conscious customers looking for healthier options without compromising on taste.
Market Drivers
Growth in snacking occasion occasions, Increasing awareness about health benefits.
COVID-19 Impact on the Market
Due to lockdowns imposed by government across country, there was decline sales recorded during 2025 owing disruption caused pandemic followed closure retail outlets manufacturers could not sell their product through conventional channels. However, shift digital platforms allowed industry capitalize newer opportunities order make up difference between reduced sales brick mortar stores e-commerce platform emerged out winner situation allowing customer still access these products home comfort safety own space.
Challenges of the Market
Unfavorable economic conditions, Availability counterfeit low cost productshampering its profitability margins significantly.
Industry Key Players
The key players operating India Cake Mixes Market include Nestle SA (Switzerland), Kraft Heinz Company (US), General Mills Inc (US) J M Smucker Company(US) Conagra Brands Incorporation.
Key Highlights of the Report:
- Indonesia Cake Mixes Market Outlook
- Market Size of Indonesia Cake Mixes Market, 2025
- Forecast of Indonesia Cake Mixes Market, 2032
- Historical Data and Forecast of Indonesia Cake Mixes Revenues & Volume for the Period 2022-2032F
- Indonesia Cake Mixes Market Trend Evolution
- Indonesia Cake Mixes Market Drivers and Challenges
- Indonesia Cake Mixes Price Trends
- Indonesia Cake Mixes Porter's Five Forces
- Indonesia Cake Mixes Industry Life Cycle
- Historical Data and Forecast of Indonesia Cake Mixes Market Revenues & Volume By Flavor for the Period 2022-2032F
- Historical Data and Forecast of Indonesia Cake Mixes Market Revenues & Volume By Chocolate for the Period 2022-2032F
- Historical Data and Forecast of Indonesia Cake Mixes Market Revenues & Volume By Vanilla for the Period 2022-2032F
- Historical Data and Forecast of Indonesia Cake Mixes Market Revenues & Volume By Fruit for the Period 2022-2032F
- Historical Data and Forecast of Indonesia Cake Mixes Market Revenues & Volume By Others for the Period 2022-2032F
- Historical Data and Forecast of Indonesia Cake Mixes Market Revenues & Volume By Distribution Channel for the Period 2022-2032F
- Historical Data and Forecast of Indonesia Cake Mixes Market Revenues & Volume By Online for the Period 2022-2032F
- Historical Data and Forecast of Indonesia Cake Mixes Market Revenues & Volume By Offline for the Period 2022-2032F
- Indonesia Cake Mixes Import Export Trade Statistics
- Market Opportunity Assessment By Flavor
- Market Opportunity Assessment By Distribution Channel
- Indonesia Cake Mixes Top Companies Market Share
- Indonesia Cake Mixes Competitive Benchmarking By Technical and Operational Parameters
- Indonesia Cake Mixes Company Profiles
- Indonesia Cake Mixes Key Strategic Recommendations
Indonesia Cake Mixes Market (2026-2032): FAQs
6Wresearch actively monitors the Indonesia Cake Mixes Market and publishes its comprehensive annual report, highlighting emerging trends, growth drivers, revenue analysis, and forecast outlook. Our insights help businesses to make data-backed strategic decisions with ongoing market dynamics. Our analysts track relevent industries related to the Indonesia Cake Mixes Market, allowing our clients with actionable intelligence and reliable forecasts tailored to emerging regional needs.
Yes, we provide customisation as per your requirements. To learn more, feel free to contact us on sales@6wresearch.com
1 Executive Summary |
2 Introduction |
2.1 Key Highlights of the Report |
2.2 Report Description |
2.3 Market Scope & Segmentation |
2.4 Research Methodology |
2.5 Assumptions |
3 Indonesia Cake Mixes Market Overview |
3.1 Indonesia Country Macro Economic Indicators |
3.2 Indonesia Cake Mixes Market Revenues & Volume, 2022 & 2032F |
3.3 Indonesia Cake Mixes Market - Industry Life Cycle |
3.4 Indonesia Cake Mixes Market - Porter's Five Forces |
3.5 Indonesia Cake Mixes Market Revenues & Volume Share, By Flavor, 2022 & 2032F |
3.6 Indonesia Cake Mixes Market Revenues & Volume Share, By Distribution Channel, 2022 & 2032F |
4 Indonesia Cake Mixes Market Dynamics |
4.1 Impact Analysis |
4.2 Market Drivers |
4.2.1 Increasing disposable income of consumers in Indonesia leading to higher spending on convenience food products like cake mixes. |
4.2.2 Growing trend of home baking and DIY culture among consumers in Indonesia. |
4.2.3 Expansion of modern retail channels such as supermarkets and hypermarkets offering a wide variety of cake mix products. |
4.3 Market Restraints |
4.3.1 Price sensitivity among Indonesian consumers may limit the adoption of premium cake mix products. |
4.3.2 Limited awareness and penetration of cake mixes in certain regions of Indonesia. |
4.3.3 Competition from traditional homemade cakes and local bakeries could hinder the growth of the cake mixes market. |
5 Indonesia Cake Mixes Market Trends |
6 Indonesia Cake Mixes Market, By Types |
6.1 Indonesia Cake Mixes Market, By Flavor |
6.1.1 Overview and Analysis |
6.1.2 Indonesia Cake Mixes Market Revenues & Volume, By Flavor, 2022-2032F |
6.1.3 Indonesia Cake Mixes Market Revenues & Volume, By Chocolate, 2022-2032F |
6.1.4 Indonesia Cake Mixes Market Revenues & Volume, By Vanilla, 2022-2032F |
6.1.5 Indonesia Cake Mixes Market Revenues & Volume, By Fruit, 2022-2032F |
6.1.6 Indonesia Cake Mixes Market Revenues & Volume, By Others, 2022-2032F |
6.2 Indonesia Cake Mixes Market, By Distribution Channel |
6.2.1 Overview and Analysis |
6.2.2 Indonesia Cake Mixes Market Revenues & Volume, By Online, 2022-2032F |
6.2.3 Indonesia Cake Mixes Market Revenues & Volume, By Offline, 2022-2032F |
7 Indonesia Cake Mixes Market Import-Export Trade Statistics |
7.1 Indonesia Cake Mixes Market Export to Major Countries |
7.2 Indonesia Cake Mixes Market Imports from Major Countries |
8 Indonesia Cake Mixes Market Key Performance Indicators |
8.1 Number of households purchasing cake mixes in Indonesia. |
8.2 Frequency of cake mix purchases per household. |
8.3 Online search volume for cake mix recipes and products in Indonesia. |
8.4 Number of new product launches and innovations in the cake mixes market. |
8.5 Participation rates in cake baking workshops or classes. |
9 Indonesia Cake Mixes Market - Opportunity Assessment |
9.1 Indonesia Cake Mixes Market Opportunity Assessment, By Flavor, 2022 & 2032F |
9.2 Indonesia Cake Mixes Market Opportunity Assessment, By Distribution Channel, 2022 & 2032F |
10 Indonesia Cake Mixes Market - Competitive Landscape |
10.1 Indonesia Cake Mixes Market Revenue Share, By Companies, 2025 |
10.2 Indonesia Cake Mixes Market Competitive Benchmarking, By Operating and Technical Parameters |
11 Company Profiles |
12 Recommendations |
13 Disclaimer |
Export potential assessment - trade Analytics for 2030
Export potential enables firms to identify high-growth global markets with greater confidence by combining advanced trade intelligence with a structured quantitative methodology. The framework analyzes emerging demand trends and country-level import patterns while integrating macroeconomic and trade datasets such as GDP and population forecasts, bilateral import–export flows, tariff structures, elasticity differentials between developed and developing economies, geographic distance, and import demand projections. Using weighted trade values from 2020–2024 as the base period to project country-to-country export potential for 2030, these inputs are operationalized through calculated drivers such as gravity model parameters, tariff impact factors, and projected GDP per-capita growth. Through an analysis of hidden potentials, demand hotspots, and market conditions that are most favorable to success, this method enables firms to focus on target countries, maximize returns, and global expansion with data, backed by accuracy.
By factoring in the projected importer demand gap that is currently unmet and could be potential opportunity, it identifies the potential for the Exporter (Country) among 190 countries, against the general trade analysis, which identifies the biggest importer or exporter.
To discover high-growth global markets and optimize your business strategy:
Click Here
Pricing
- Single User License$ 1,995
- Department License$ 2,400
- Site License$ 3,120
- Global License$ 3,795

Search
Thought Leadership and Analyst Meet


Our Clients
Latest Reports
- United Kingdom (UK) Long-term Care Insurance Market (2026-2032) | Growth, Share, Consumer Insights, Drivers, Opportunities, Competition, Pricing Analysis, Segments, Restraints, Companies, Competitive, Value, Outlook, Size, Demand, Analysis, Challenges, Strategic Insights, Investment Trends, Revenue, Trends, Supply, Forecast
- United Kingdom (UK) Long Term Care Market (2026-2032) | Companies, Outlook, Analysis, Trends, Value, Revenue, Segmentation, Share, Forecast, Competitive Landscape, Growth, Size & Forecast
- Iraq Insulation and Waterproofing Market (2026-2032) | Outlook, Drivers, Growth, Size, Share, Industry, Revenue, Trends, Demand, Competitive, Strategic Insights, Opportunities, Segments, Companies, Challenges, Strategy, Consumer Insights, Analysis, Investment Trends, Value, Segmentation, Forecast, Restraints
- India Switchgear Market Outlook (2026 - 2032) | Size, Share, Trends, Growth, Revenue, Forecast, Analysis, Value, Outlook
- Pakistan Contraceptive Implants Market (2025-2031) | Demand, Growth, Size, Share, Industry, Pricing Analysis, Competitive, Strategic Insights, Strategy, Consumer Insights, Analysis, Investment Trends, Opportunities, Revenue, Segments, Value, Segmentation, Supply, Forecast, Restraints, Outlook, Competition, Drivers, Trends, Companies, Challenges
- Sri Lanka Packaging Market (2026-2032) | Outlook, Competition, Drivers, Trends, Demand, Pricing Analysis, Competitive, Strategic Insights, Companies, Challenges, Strategy, Consumer Insights, Analysis, Investment Trends, Opportunities, Growth, Size, Share, Industry, Revenue, Segments, Value, Segmentation, Supply, Forecast, Restraints
- India Kids Watches Market (2026-2032) | Strategy, Consumer Insights, Analysis, Investment Trends, Opportunities, Growth, Size, Share, Industry, Revenue, Segments, Value, Segmentation, Supply, Forecast, Restraints, Outlook, Competition, Drivers, Trends, Demand, Pricing Analysis, Competitive, Strategic Insights, Companies, Challenges
- Saudi Arabia Core Assurance Service Market (2025-2031) | Strategy, Consumer Insights, Analysis, Investment Trends, Opportunities, Growth, Size, Share, Industry, Revenue, Segments, Value, Segmentation, Supply, Forecast, Restraints, Outlook, Competition, Drivers, Trends, Demand, Pricing Analysis, Competitive, Strategic Insights, Companies, Challenges
- Romania Uninterruptible Power Supply (UPS) Market (2026-2032) | Industry, Analysis, Revenue, Size, Forecast, Outlook, Value, Trends, Share, Growth & Companies
- Saudi Arabia Car Window Tinting Film, Paint Protection Film (PPF), and Ceramic Coating Market (2025-2031) | Strategy, Consumer Insights, Analysis, Investment Trends, Opportunities, Growth, Size, Share, Industry, Revenue, Segments, Value, Segmentation, Supply, Forecast, Restraints, Outlook, Competition, Drivers, Trends, Demand, Pricing Analysis, Competitive, Strategic Insights, Companies, Challenges
Industry Events and Analyst Meet

India EV Show 2026

EV tech India Expo 2026

Auto Tech Asia 2026

Battery Tech India 2026

Smart Production Solutions Guangzhou 2026
Whitepaper
- Middle East & Africa Commercial Security Market Click here to view more.
- Middle East & Africa Fire Safety Systems & Equipment Market Click here to view more.
- GCC Drone Market Click here to view more.
- Middle East Lighting Fixture Market Click here to view more.
- GCC Physical & Perimeter Security Market Click here to view more.
6WResearch In News
- Doha a strategic location for EV manufacturing hub: IPA Qatar
- Demand for luxury TVs surging in the GCC, says Samsung
- Empowering Growth: The Thriving Journey of Bangladesh’s Cable Industry
- Demand for luxury TVs surging in the GCC, says Samsung
- Video call with a traditional healer? Once unthinkable, it’s now common in South Africa
- Intelligent Buildings To Smooth GCC’s Path To Net Zero