Indonesia Caustic potash Market (2026-2032) Outlook | Revenue, Size, Forecast, Industry, Analysis, Value, Growth, Trends, Share & Companies
Market Forecast By Form (Solid, Liquid), By Grade (Industrial, Reagent, Pharmaceutical), By End-users (Potassium Carbonate, Potassium Phosphates, Potassium Soaps and Detergents, Liquid Fertilizers, Agricultural Chemicals, Others) And Competitive Landscape
| Product Code: ETC088067 | Publication Date: Jul 2023 | Updated Date: Mar 2026 | Product Type: Report | |
| Publisher: 6Wresearch | Author: Ravi Bhandari | No. of Pages: 70 | No. of Figures: 35 | No. of Tables: 5 |
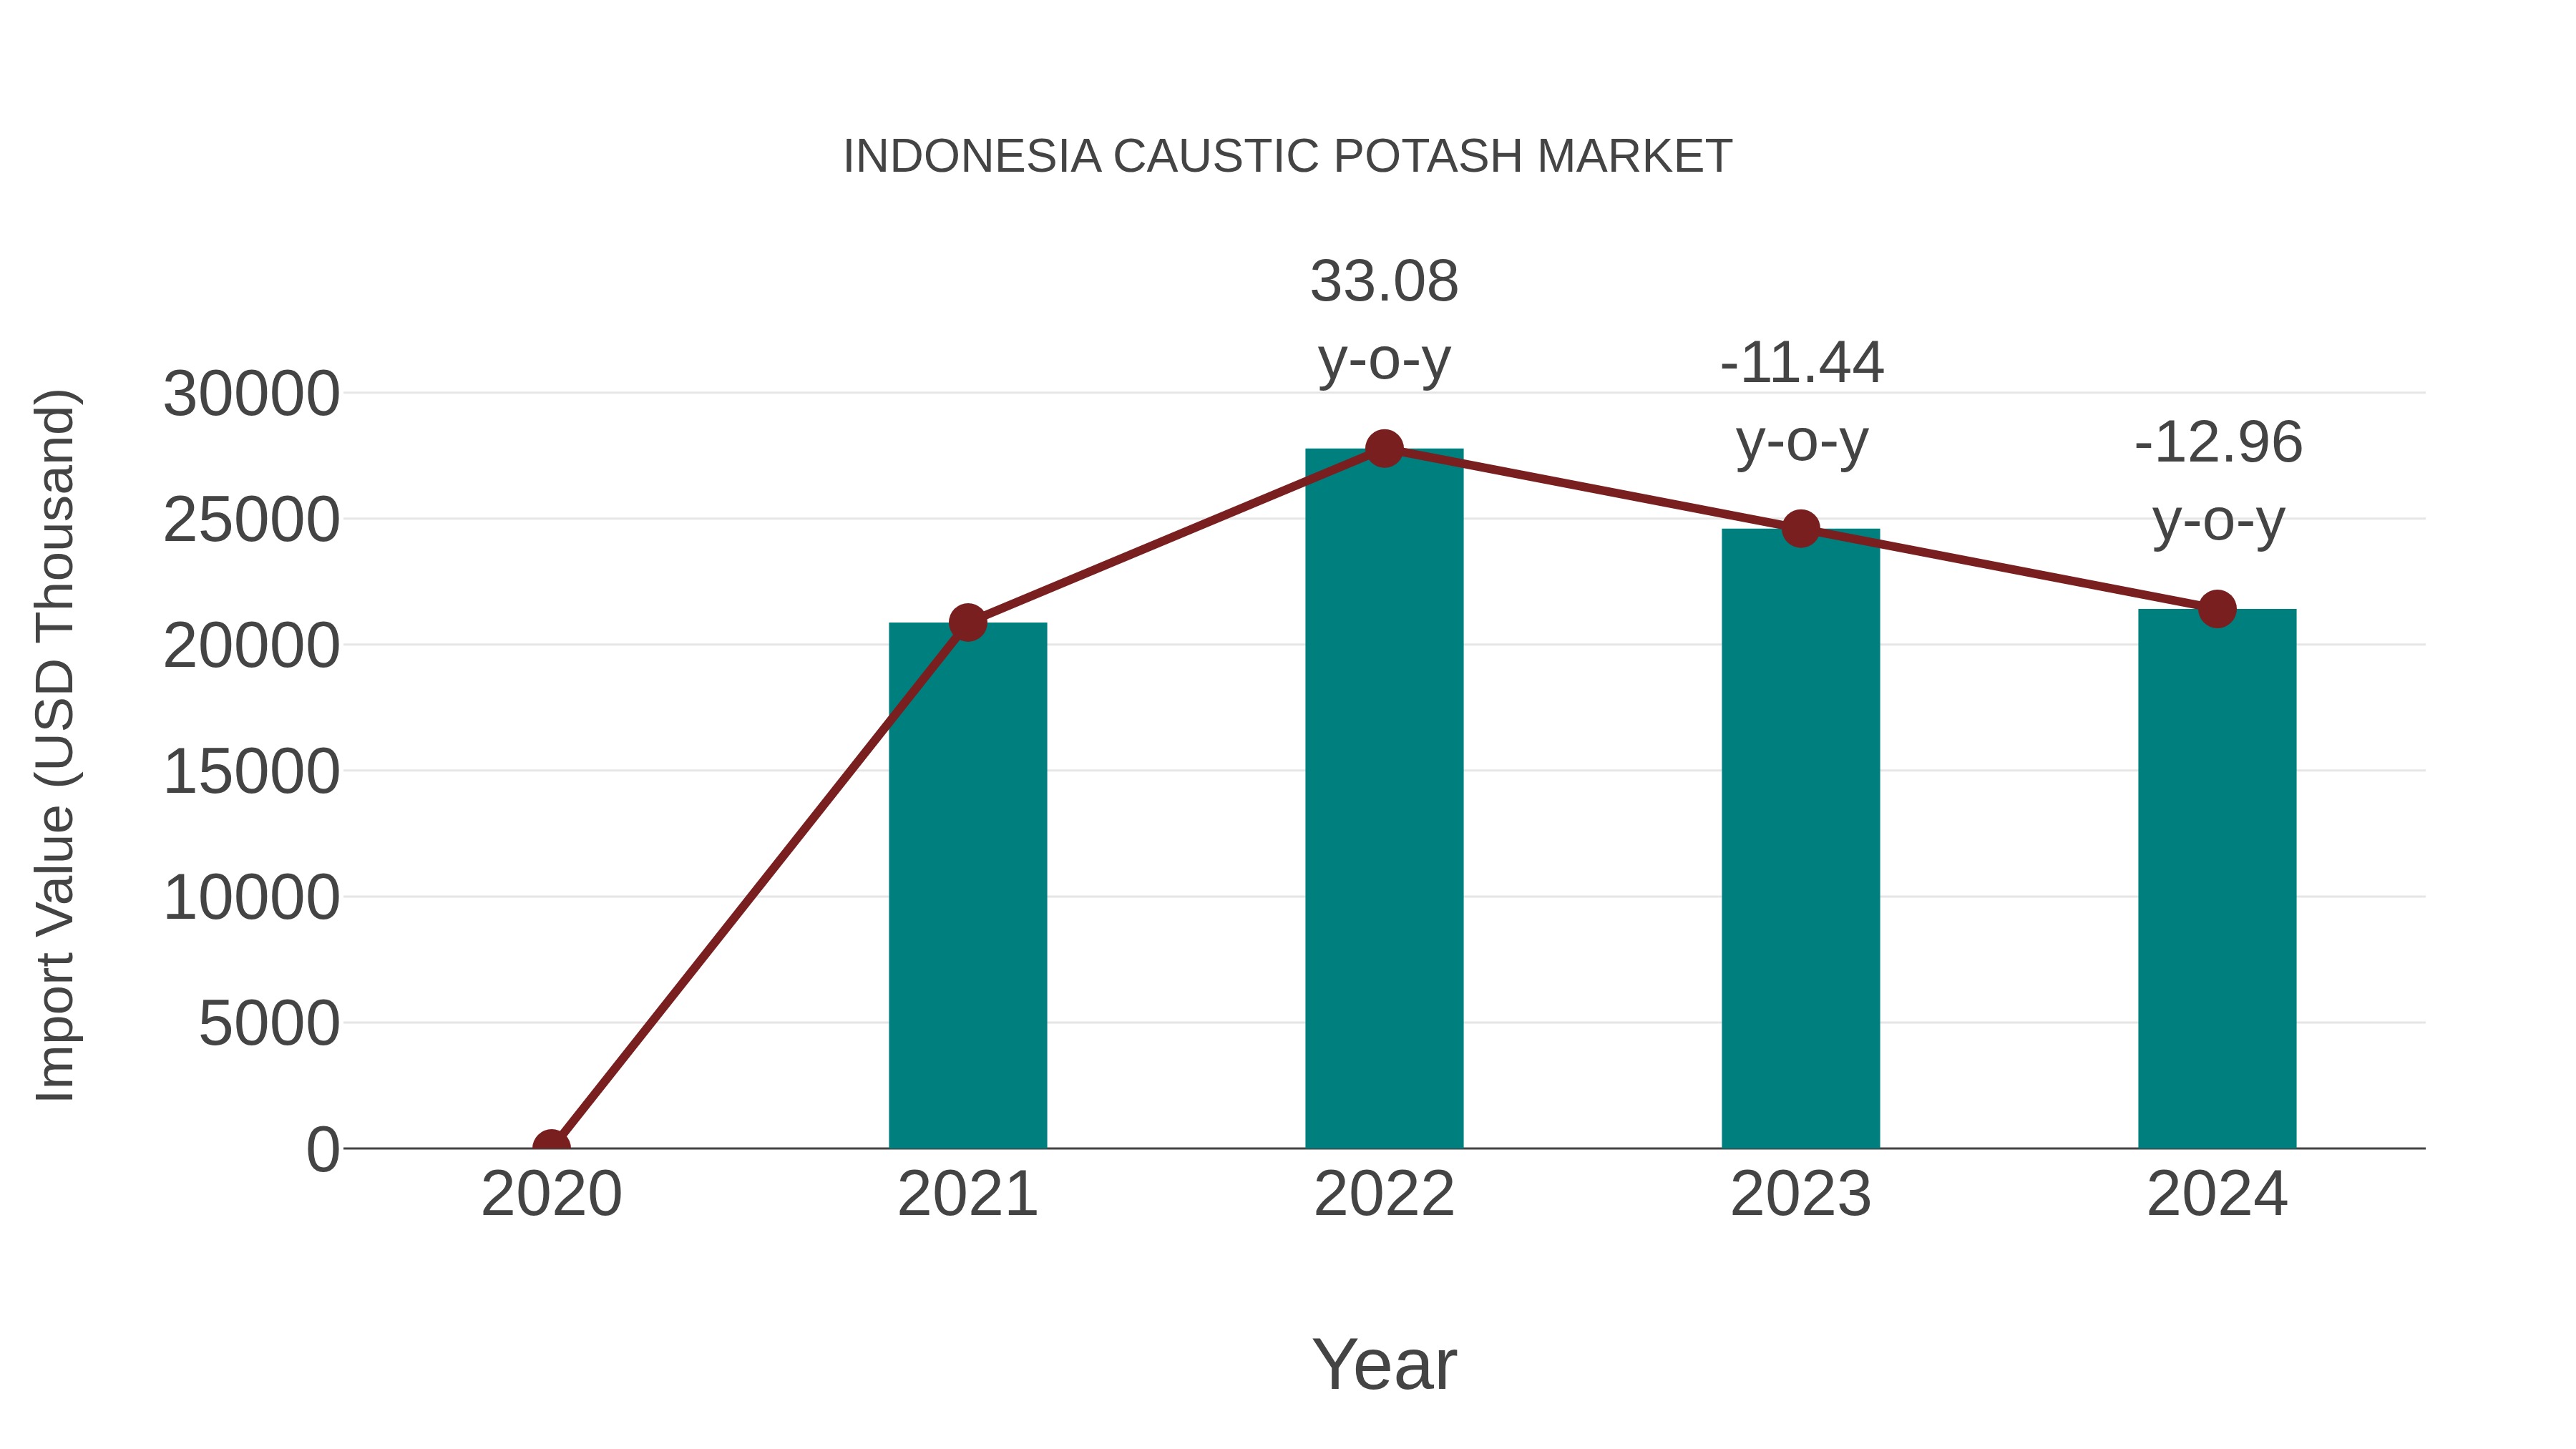
Indonesia Caustic Potash Market: Import Trend Analysis
Indonesia`s import trend for caustic potash in 2024 experienced a decline of -12.96% compared to the previous year, with a compound annual growth rate (CAGR) of 0.85% from 2020 to 2024. This negative growth can be attributed to shifts in market demand or changes in trade policies affecting import momentum.
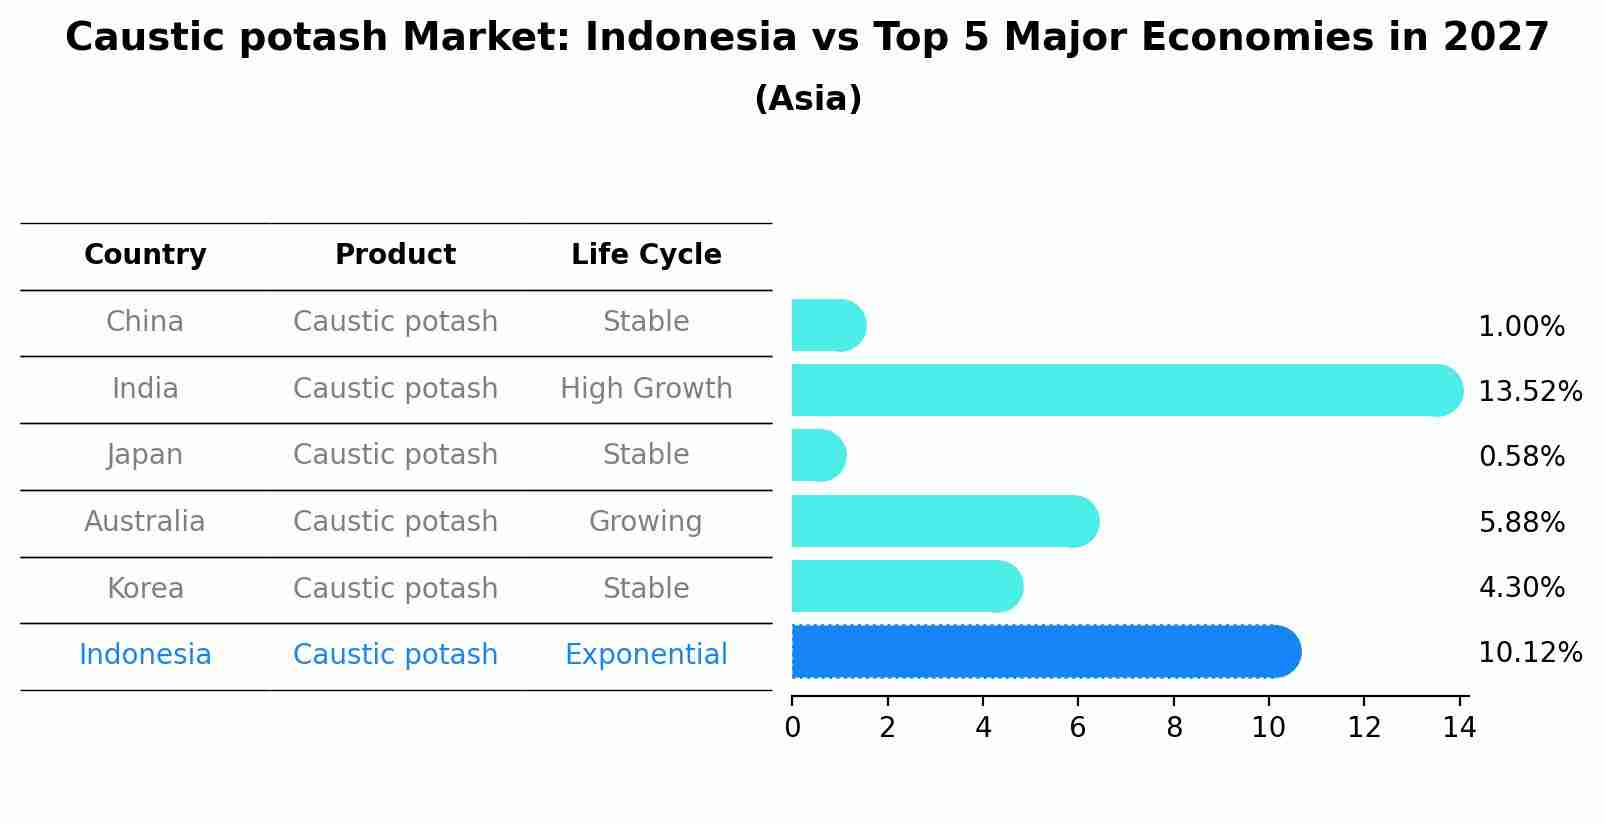
Caustic potash Market: Indonesia vs Top 5 Major Economies in 2027 (Asia)
In the Asia region, the Caustic potash market in Indonesia is projected to expand at a high growth rate of 10.12% by 2027. The largest economy is China, followed by India, Japan, Australia and South Korea.
Indonesia Caustic potash MarketSynopsis
Indonesia is the largest producer of caustic potash in Southeast Asia, accounting for around two-thirds of total regional production. The country produces large quantities of potassium hydroxide (KOH) and sodium hydroxide (NaOH). Caustic potash is used extensively in various industries such as papermaking, food processing, detergent & soaps manufacturing, pharmaceuticals, water treatment plants and others.
Market Trends
The demand for caustic potash has been growing steadily over recent years due to the increasing use of this chemical in a wide range of industries. The growth can be attributed to its versatile properties which makes it ideal for a variety of applications including bleaching agents, cleaning solvents and other industrial uses. Moreover, the rising popularity of green chemistry has prompted an increased usage of bio-based products that are made with natural ingredients such as caustic potash instead traditional chemicals derived from petroleum or synthetic sources. This trend will likely drive further growth in the industry going forward.
Market Drivers
Growing demand from downstream industries like pulp & paper making and pharmaceuticals is one key factor driving the market for Indonesia caustic potash market. Additionally, Indonesia strong presence within ASEAN countries also raises their competitive advantage compared to other producers in Asia Pacific region given its strategic location along major shipping routes connecting eastern economies with western ones creating favorable export opportunities across markets leading to higher sales volumes being achieved by Indonesia companies producing caustic potashes.
COVID-19 Impact on the Market
Due to COVID-19 pandemic situation global trade activities have drastically decreased affecting negatively on overall economic activity globally causing decline on many sectors including agrochemical sector where most raw materials necessary for production process were imported from abroad yet since February 2025 border closures at high levels have led decrease imports thus resulting lower supply available hence drop off prices occurred during first quarter however despite weakened economy situation some fertilizer manufacturing companies still experienced increase profits level since they benefited from lower material costs while selling same amount final product. Thus consequences were not uniform across all segments but rather varied accordingly depending upon particular company?s business model. Hence future prospects remain unclear regarding impact COVID-19 could bring about onto industry especially whether recovering or further weakening likely occur amongst different subsectors over upcoming year.
Challenges of the Market
Indonesia caustic potash market is facing several challenges, such as increasing competition from low-cost suppliers in China and India, a weak domestic demand due to economic slowdown, and rising raw material costs. Additionally, the country also faces an unfavorable import duty structure for caustic potash imports which has resulted in increased operating costs for local players.
Industry Key Players
The major key players operating in Indonesia caustic potash market are PT Pupuk Kalimantan Timur (PKT), Petrokimia Gresik (PGR), PT Indorama Ventures Polychem Tbk., Dharma Surya Wisesa Tbk., Eka Kimya Tekstil ve End?striyel Malzemeleri Sanayi Ve Ticaret A?., BHN Group holding company of Kertas Kraft Aceh Ispat Perdana Pvt Ltd,.and Propan Raya Chemicals Pte Ltd., among others.
Key Highlights of the Report:
- Indonesia Caustic potash Market Outlook
- Market Size of Indonesia Caustic potash Market, 2025
- Forecast of Indonesia Caustic potash Market, 2032
- Historical Data and Forecast of Indonesia Caustic potash Revenues & Volume for the Period 2022-2032F
- Indonesia Caustic potash Market Trend Evolution
- Indonesia Caustic potash Market Drivers and Challenges
- Indonesia Caustic potash Price Trends
- Indonesia Caustic potash Porter's Five Forces
- Indonesia Caustic potash Industry Life Cycle
- Historical Data and Forecast of Indonesia Caustic potash Market Revenues & Volume By Form for the Period 2022-2032F
- Historical Data and Forecast of Indonesia Caustic potash Market Revenues & Volume By Solid for the Period 2022-2032F
- Historical Data and Forecast of Indonesia Caustic potash Market Revenues & Volume By Liquid for the Period 2022-2032F
- Historical Data and Forecast of Indonesia Caustic potash Market Revenues & Volume By Grade for the Period 2022-2032F
- Historical Data and Forecast of Indonesia Caustic potash Market Revenues & Volume By Industrial for the Period 2022-2032F
- Historical Data and Forecast of Indonesia Caustic potash Market Revenues & Volume By Reagent for the Period 2022-2032F
- Historical Data and Forecast of Indonesia Caustic potash Market Revenues & Volume By Pharmaceutical for the Period 2022-2032F
- Historical Data and Forecast of Indonesia Caustic potash Market Revenues & Volume By End-users for the Period 2022-2032F
- Historical Data and Forecast of Indonesia Caustic potash Market Revenues & Volume By Potassium Carbonate for the Period 2022-2032F
- Historical Data and Forecast of Indonesia Caustic potash Market Revenues & Volume By Potassium Phosphates for the Period 2022-2032F
- Historical Data and Forecast of Indonesia Caustic potash Market Revenues & Volume By Potassium Soaps and Detergents for the Period 2022-2032F
- Historical Data and Forecast of Indonesia Caustic potash Market Revenues & Volume By Liquid Fertilizers for the Period 2022-2032F
- Historical Data and Forecast of Indonesia Caustic potash Market Revenues & Volume By Agricultural Chemicals for the Period 2022-2032F
- Historical Data and Forecast of Indonesia Caustic potash Market Revenues & Volume By Others for the Period 2022-2032F
- Indonesia Caustic potash Import Export Trade Statistics
- Market Opportunity Assessment By Form
- Market Opportunity Assessment By Grade
- Market Opportunity Assessment By End-users
- Indonesia Caustic potash Top Companies Market Share
- Indonesia Caustic potash Competitive Benchmarking By Technical and Operational Parameters
- Indonesia Caustic potash Company Profiles
- Indonesia Caustic potash Key Strategic Recommendations
Indonesia Caustic potash Market (2026-2032): FAQs
6Wresearch actively monitors the Indonesia Caustic potash Market and publishes its comprehensive annual report, highlighting emerging trends, growth drivers, revenue analysis, and forecast outlook. Our insights help businesses to make data-backed strategic decisions with ongoing market dynamics. Our analysts track relevent industries related to the Indonesia Caustic potash Market, allowing our clients with actionable intelligence and reliable forecasts tailored to emerging regional needs.
Yes, we provide customisation as per your requirements. To learn more, feel free to contact us on sales@6wresearch.com
1 Executive Summary |
2 Introduction |
2.1 Key Highlights of the Report |
2.2 Report Description |
2.3 Market Scope & Segmentation |
2.4 Research Methodology |
2.5 Assumptions |
3 Indonesia Caustic potash Market Overview |
3.1 Indonesia Country Macro Economic Indicators |
3.2 Indonesia Caustic potash Market Revenues & Volume, 2022 & 2032F |
3.3 Indonesia Caustic potash Market - Industry Life Cycle |
3.4 Indonesia Caustic potash Market - Porter's Five Forces |
3.5 Indonesia Caustic potash Market Revenues & Volume Share, By Form, 2022 & 2032F |
3.6 Indonesia Caustic potash Market Revenues & Volume Share, By Grade, 2022 & 2032F |
3.7 Indonesia Caustic potash Market Revenues & Volume Share, By End-users, 2022 & 2032F |
4 Indonesia Caustic potash Market Dynamics |
4.1 Impact Analysis |
4.2 Market Drivers |
4.2.1 Increasing demand for caustic potash in various industries such as agriculture, chemical, and food processing. |
4.2.2 Growing population and urbanization leading to higher consumption of products that require caustic potash. |
4.2.3 Government initiatives to promote domestic manufacturing and industrial growth. |
4.3 Market Restraints |
4.3.1 Fluctuating prices of raw materials used in caustic potash production. |
4.3.2 Environmental concerns and regulations related to the manufacturing process. |
4.3.3 Competition from alternative products or substitutes in the market. |
5 Indonesia Caustic potash Market Trends |
6 Indonesia Caustic potash Market, By Types |
6.1 Indonesia Caustic potash Market, By Form |
6.1.1 Overview and Analysis |
6.1.2 Indonesia Caustic potash Market Revenues & Volume, By Form, 2022-2032F |
6.1.3 Indonesia Caustic potash Market Revenues & Volume, By Solid, 2022-2032F |
6.1.4 Indonesia Caustic potash Market Revenues & Volume, By Liquid, 2022-2032F |
6.2 Indonesia Caustic potash Market, By Grade |
6.2.1 Overview and Analysis |
6.2.2 Indonesia Caustic potash Market Revenues & Volume, By Industrial, 2022-2032F |
6.2.3 Indonesia Caustic potash Market Revenues & Volume, By Reagent, 2022-2032F |
6.2.4 Indonesia Caustic potash Market Revenues & Volume, By Pharmaceutical, 2022-2032F |
6.3 Indonesia Caustic potash Market, By End-users |
6.3.1 Overview and Analysis |
6.3.2 Indonesia Caustic potash Market Revenues & Volume, By Potassium Carbonate, 2022-2032F |
6.3.3 Indonesia Caustic potash Market Revenues & Volume, By Potassium Phosphates, 2022-2032F |
6.3.4 Indonesia Caustic potash Market Revenues & Volume, By Potassium Soaps and Detergents, 2022-2032F |
6.3.5 Indonesia Caustic potash Market Revenues & Volume, By Liquid Fertilizers, 2022-2032F |
6.3.6 Indonesia Caustic potash Market Revenues & Volume, By Agricultural Chemicals, 2022-2032F |
6.3.7 Indonesia Caustic potash Market Revenues & Volume, By Others, 2022-2032F |
7 Indonesia Caustic potash Market Import-Export Trade Statistics |
7.1 Indonesia Caustic potash Market Export to Major Countries |
7.2 Indonesia Caustic potash Market Imports from Major Countries |
8 Indonesia Caustic potash Market Key Performance Indicators |
8.1 Production capacity utilization rate. |
8.2 Average selling price trends. |
8.3 Research and development investments in new caustic potash applications. |
8.4 Export/import volumes and trends. |
8.5 Operational efficiency metrics such as energy consumption per unit of caustic potash produced. |
9 Indonesia Caustic potash Market - Opportunity Assessment |
9.1 Indonesia Caustic potash Market Opportunity Assessment, By Form, 2022 & 2032F |
9.2 Indonesia Caustic potash Market Opportunity Assessment, By Grade, 2022 & 2032F |
9.3 Indonesia Caustic potash Market Opportunity Assessment, By End-users, 2022 & 2032F |
10 Indonesia Caustic potash Market - Competitive Landscape |
10.1 Indonesia Caustic potash Market Revenue Share, By Companies, 2025 |
10.2 Indonesia Caustic potash Market Competitive Benchmarking, By Operating and Technical Parameters |
11 Company Profiles |
12 Recommendations |
13 Disclaimer |
Export potential assessment - trade Analytics for 2030
Export potential enables firms to identify high-growth global markets with greater confidence by combining advanced trade intelligence with a structured quantitative methodology. The framework analyzes emerging demand trends and country-level import patterns while integrating macroeconomic and trade datasets such as GDP and population forecasts, bilateral import–export flows, tariff structures, elasticity differentials between developed and developing economies, geographic distance, and import demand projections. Using weighted trade values from 2020–2024 as the base period to project country-to-country export potential for 2030, these inputs are operationalized through calculated drivers such as gravity model parameters, tariff impact factors, and projected GDP per-capita growth. Through an analysis of hidden potentials, demand hotspots, and market conditions that are most favorable to success, this method enables firms to focus on target countries, maximize returns, and global expansion with data, backed by accuracy.
By factoring in the projected importer demand gap that is currently unmet and could be potential opportunity, it identifies the potential for the Exporter (Country) among 190 countries, against the general trade analysis, which identifies the biggest importer or exporter.
To discover high-growth global markets and optimize your business strategy:
Click Here
Pricing
- Single User License$ 1,995
- Department License$ 2,400
- Site License$ 3,120
- Global License$ 3,795

Search
Thought Leadership and Analyst Meet


Our Clients
Latest Reports
- United Kingdom (UK) Long-term Care Insurance Market (2026-2032) | Growth, Share, Consumer Insights, Drivers, Opportunities, Competition, Pricing Analysis, Segments, Restraints, Companies, Competitive, Value, Outlook, Size, Demand, Analysis, Challenges, Strategic Insights, Investment Trends, Revenue, Trends, Supply, Forecast
- United Kingdom (UK) Long Term Care Market (2026-2032) | Companies, Outlook, Analysis, Trends, Value, Revenue, Segmentation, Share, Forecast, Competitive Landscape, Growth, Size & Forecast
- Iraq Insulation and Waterproofing Market (2026-2032) | Outlook, Drivers, Growth, Size, Share, Industry, Revenue, Trends, Demand, Competitive, Strategic Insights, Opportunities, Segments, Companies, Challenges, Strategy, Consumer Insights, Analysis, Investment Trends, Value, Segmentation, Forecast, Restraints
- India Switchgear Market Outlook (2026 - 2032) | Size, Share, Trends, Growth, Revenue, Forecast, Analysis, Value, Outlook
- Pakistan Contraceptive Implants Market (2025-2031) | Demand, Growth, Size, Share, Industry, Pricing Analysis, Competitive, Strategic Insights, Strategy, Consumer Insights, Analysis, Investment Trends, Opportunities, Revenue, Segments, Value, Segmentation, Supply, Forecast, Restraints, Outlook, Competition, Drivers, Trends, Companies, Challenges
- Sri Lanka Packaging Market (2026-2032) | Outlook, Competition, Drivers, Trends, Demand, Pricing Analysis, Competitive, Strategic Insights, Companies, Challenges, Strategy, Consumer Insights, Analysis, Investment Trends, Opportunities, Growth, Size, Share, Industry, Revenue, Segments, Value, Segmentation, Supply, Forecast, Restraints
- India Kids Watches Market (2026-2032) | Strategy, Consumer Insights, Analysis, Investment Trends, Opportunities, Growth, Size, Share, Industry, Revenue, Segments, Value, Segmentation, Supply, Forecast, Restraints, Outlook, Competition, Drivers, Trends, Demand, Pricing Analysis, Competitive, Strategic Insights, Companies, Challenges
- Saudi Arabia Core Assurance Service Market (2025-2031) | Strategy, Consumer Insights, Analysis, Investment Trends, Opportunities, Growth, Size, Share, Industry, Revenue, Segments, Value, Segmentation, Supply, Forecast, Restraints, Outlook, Competition, Drivers, Trends, Demand, Pricing Analysis, Competitive, Strategic Insights, Companies, Challenges
- Romania Uninterruptible Power Supply (UPS) Market (2026-2032) | Industry, Analysis, Revenue, Size, Forecast, Outlook, Value, Trends, Share, Growth & Companies
- Saudi Arabia Car Window Tinting Film, Paint Protection Film (PPF), and Ceramic Coating Market (2025-2031) | Strategy, Consumer Insights, Analysis, Investment Trends, Opportunities, Growth, Size, Share, Industry, Revenue, Segments, Value, Segmentation, Supply, Forecast, Restraints, Outlook, Competition, Drivers, Trends, Demand, Pricing Analysis, Competitive, Strategic Insights, Companies, Challenges
Industry Events and Analyst Meet

India EV Show 2026

EV tech India Expo 2026

Auto Tech Asia 2026

Battery Tech India 2026

Smart Production Solutions Guangzhou 2026
Whitepaper
- Middle East & Africa Commercial Security Market Click here to view more.
- Middle East & Africa Fire Safety Systems & Equipment Market Click here to view more.
- GCC Drone Market Click here to view more.
- Middle East Lighting Fixture Market Click here to view more.
- GCC Physical & Perimeter Security Market Click here to view more.
6WResearch In News
- Doha a strategic location for EV manufacturing hub: IPA Qatar
- Demand for luxury TVs surging in the GCC, says Samsung
- Empowering Growth: The Thriving Journey of Bangladesh’s Cable Industry
- Demand for luxury TVs surging in the GCC, says Samsung
- Video call with a traditional healer? Once unthinkable, it’s now common in South Africa
- Intelligent Buildings To Smooth GCC’s Path To Net Zero