Indonesia Chlorine Market (2026-2032) Outlook | Share, Forecast, Value, Growth, Companies, Analysis, Trends, Revenue, Size & Industry
Market Forecast By Application (EDC/PVC, Isocyanates and Oxygenates, Chloromethanes, Solvents and Epichlorohydrin, Inorganic Chemicals, Other Applications), By End-user Industry (Water Treatment, Pharmaceutical, Chemicals, Paper and Pulp, Plastic, Pesticides, Other End-user Industries) And Competitive Landscape
| Product Code: ETC191260 | Publication Date: Jul 2023 | Updated Date: Mar 2026 | Product Type: Market Research Report | |
| Publisher: 6Wresearch | Author: Ravi Bhandari | No. of Pages: 60 | No. of Figures: 40 | No. of Tables: 7 |
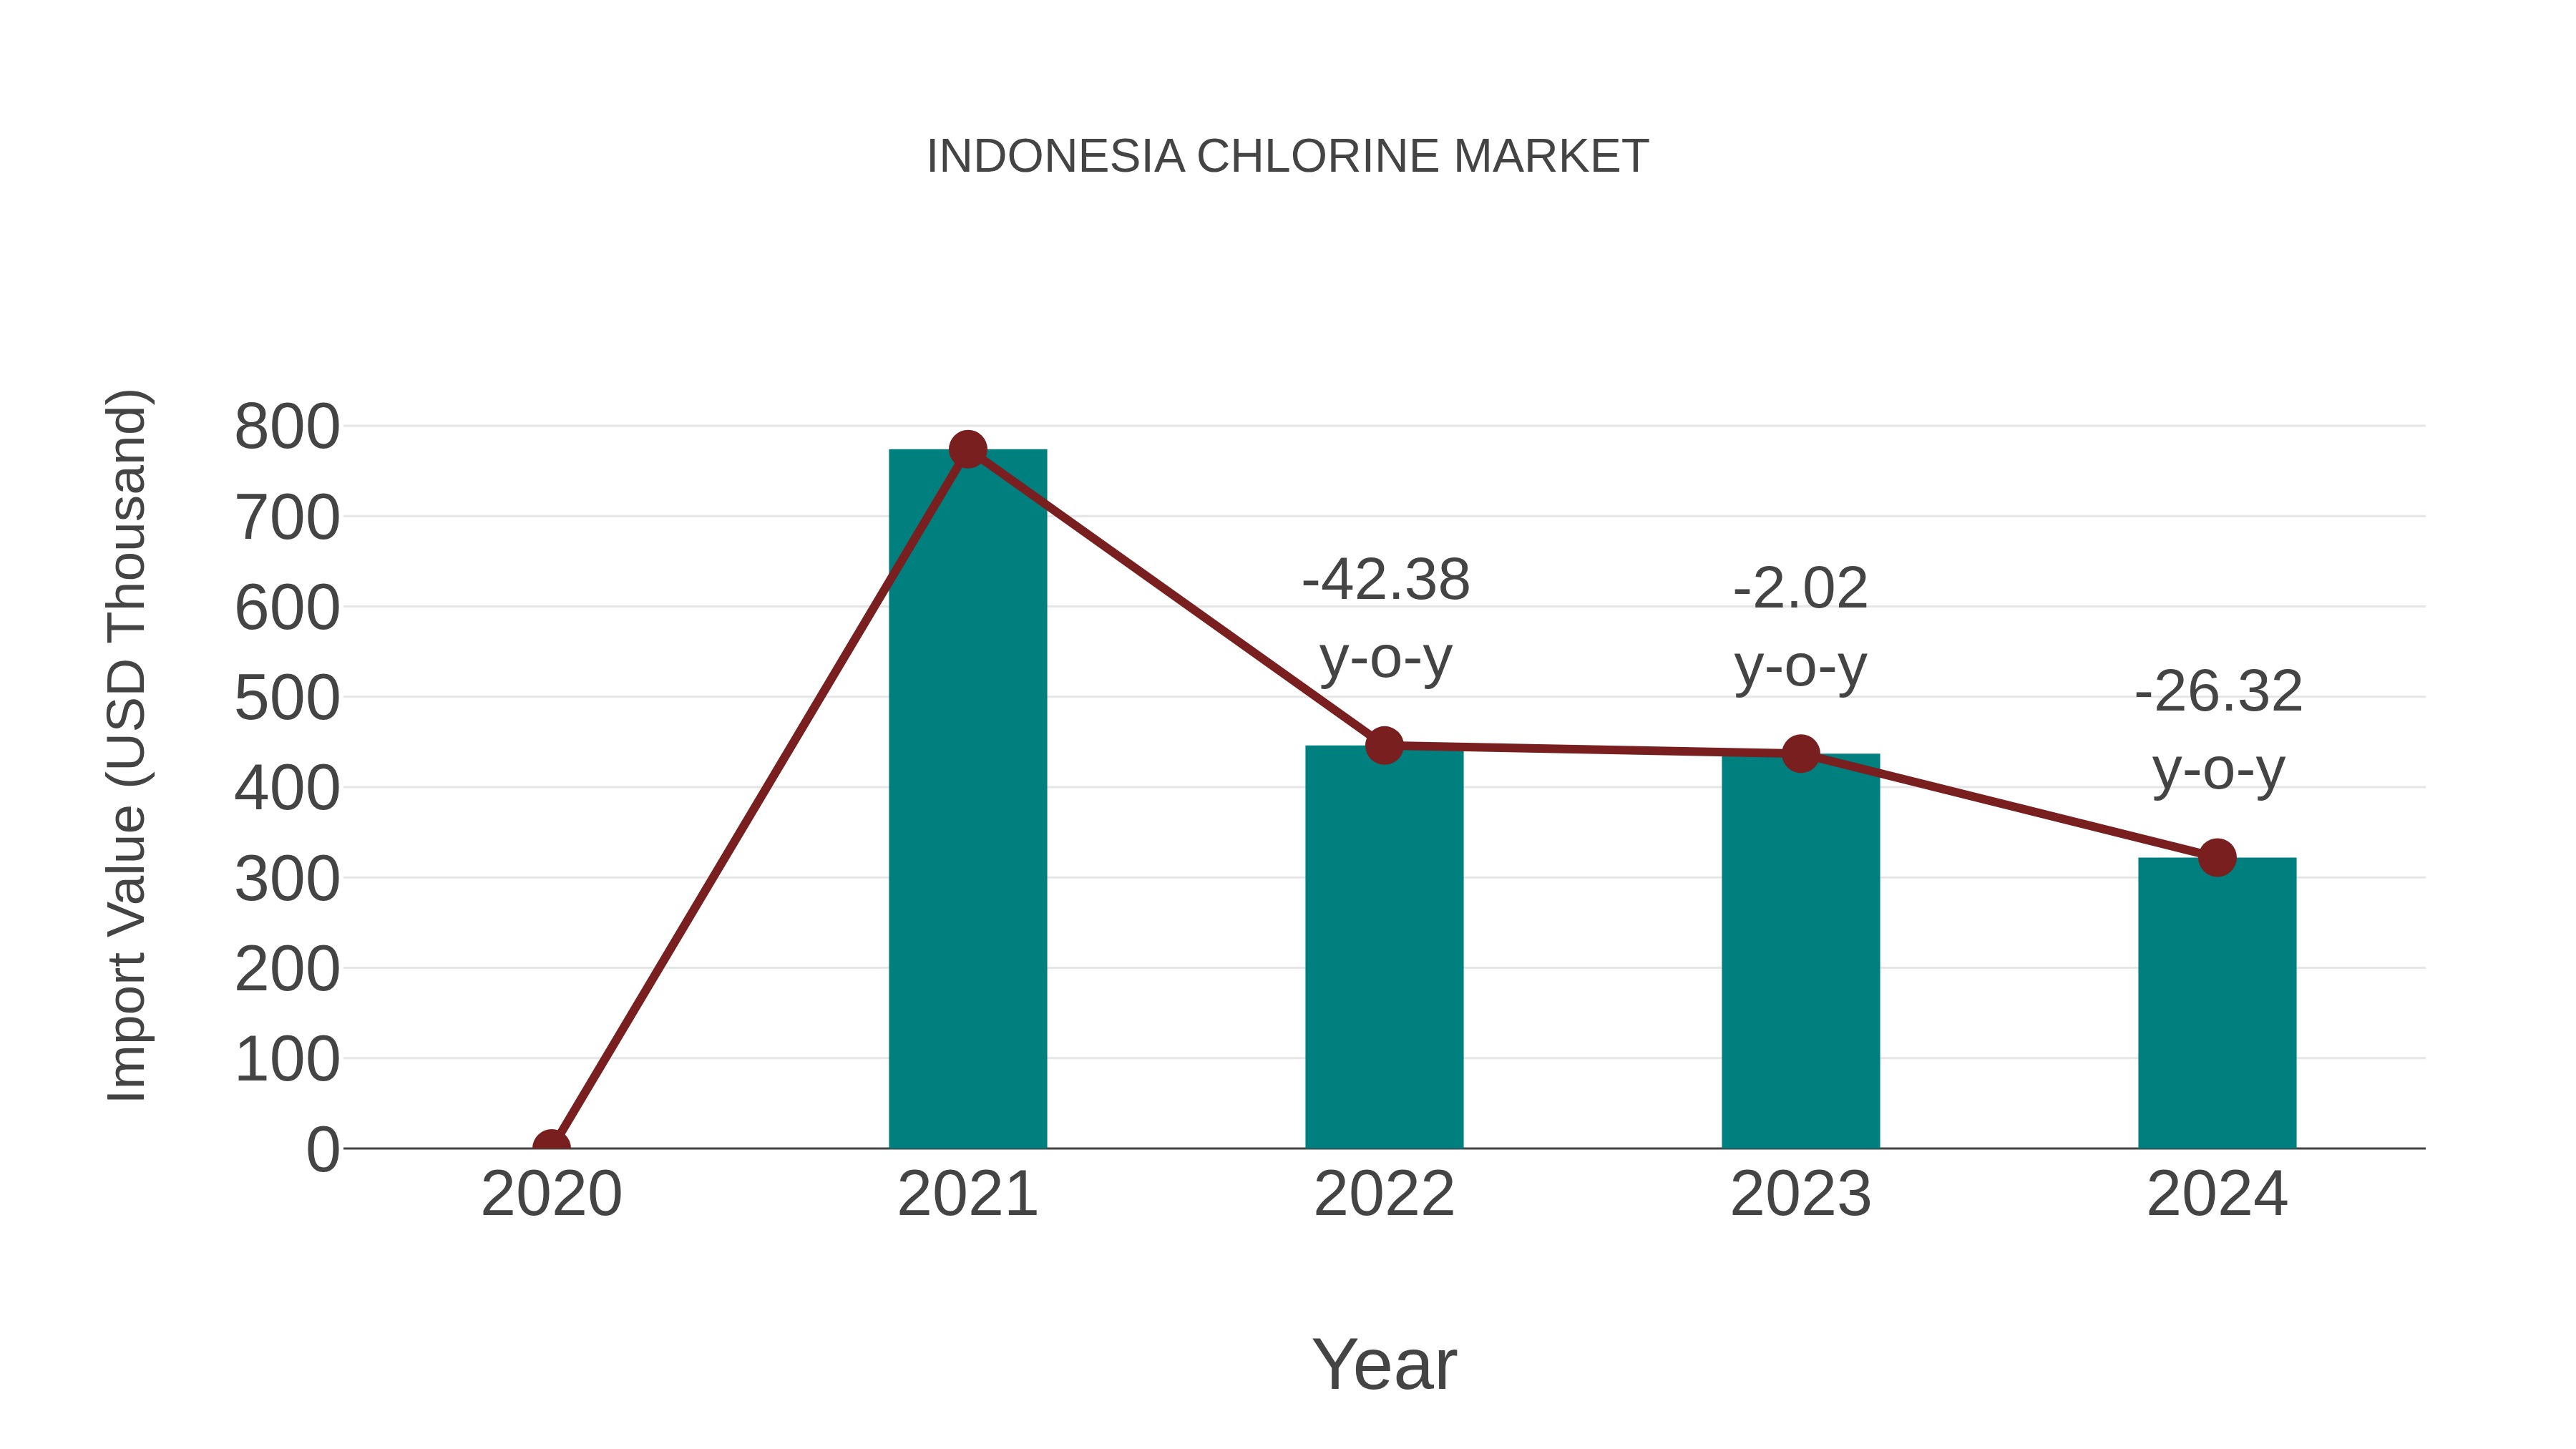
Indonesia Chlorine Market: Import Trend Analysis
Indonesia`s import trend for the chlorine market experienced a notable decline from 2023 to 2024, with a growth rate of -26.32%. The compound annual growth rate (CAGR) for the period of 2020-2024 stood at -25.35%. This significant decrease could be attributed to shifts in demand dynamics or changes in trade policies affecting market stability.
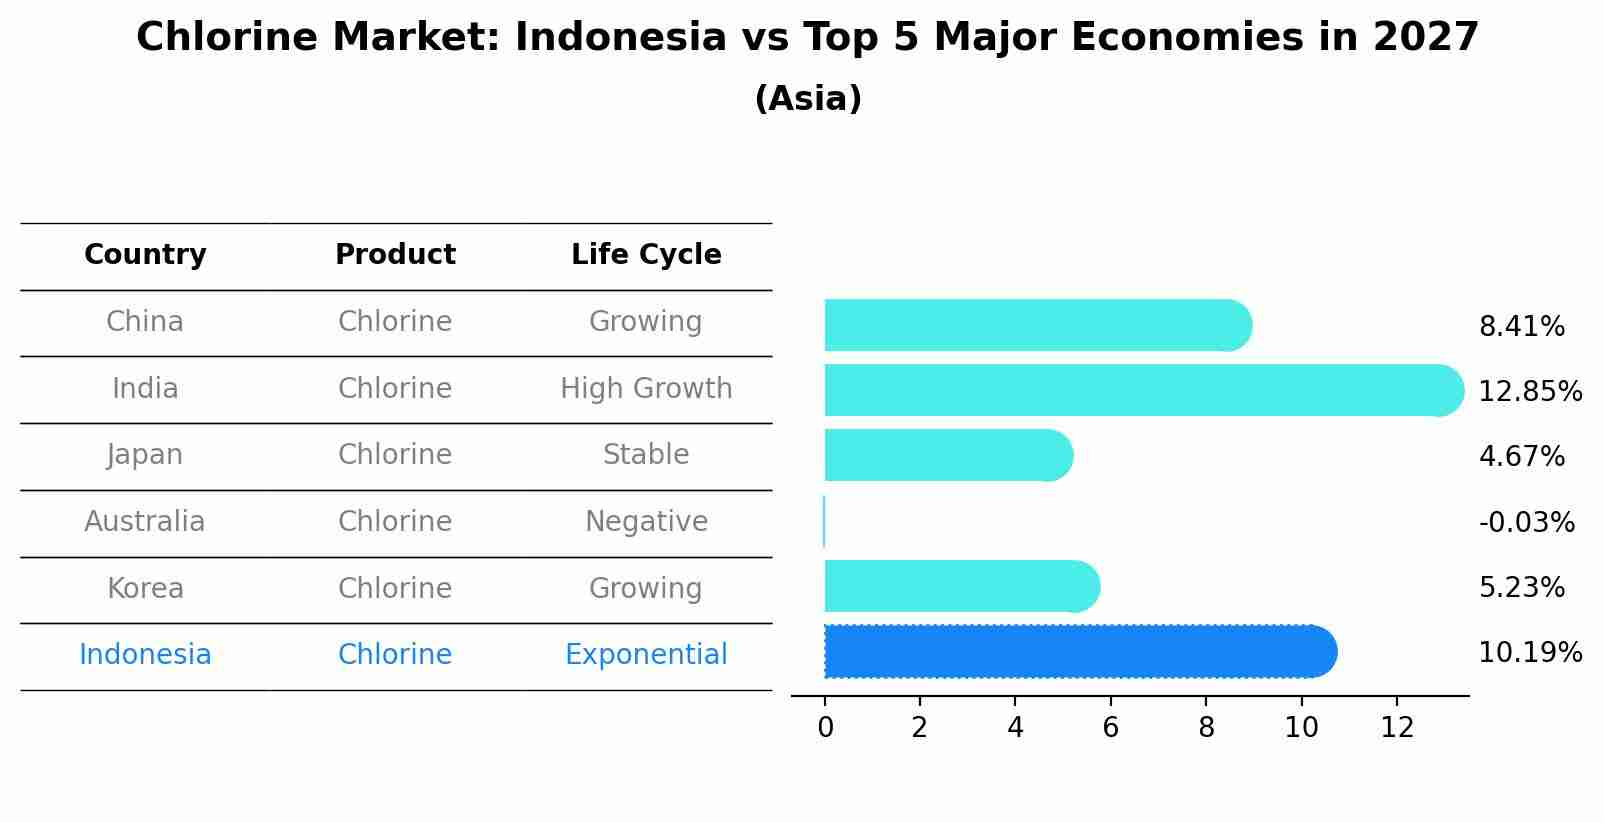
Chlorine Market: Indonesia vs Top 5 Major Economies in 2027 (Asia)
In the Asia region, the Chlorine market in Indonesia is projected to expand at a high growth rate of 10.19% by 2027. The largest economy is China, followed by India, Japan, Australia and South Korea.
Indonesia Chlorine Market Synopsis
The Indonesia chlorine market is an emerging market in Southeast Asia with a high potential for growth. The country has abundant sources of raw materials and natural resources, which are used to produce various chlorinated products. Moreover, the country`s chemical industry has been undergoing rapid expansion due to its strategic location and favorable economic conditions such as low labor cost and easy access to global markets. This has further encouraged local and foreign investments into the sector.
Market Trends
The major trend that is driving the Indonesia chlorine market is increasing demand from industries such as food processing, water treatment, pharmaceuticals, rubber production etc., thus boosting its growth prospects in these sectors. Furthermore technological advances have enabled manufacturers to produce high-quality chlorine using modern techniques at competitive prices thereby increasing their profitability margins significantly. Additionally government initiatives such as tax incentives are encouraging companies to set up new factories while also attracting more foreign investors into this space thereby creating lucrative opportunities for Companies operating in this domain.
Market Drivers
Abundant Raw Materials & Natural Resources: Indonesia offers abundant sources of raw material including an ample supply of natural gas which can be used to manufacture chlorinated products like dichloroethane or trichloromethane amongst others through electrolysis or other methods. This helps reduce overall costs associated with producing chlorine based chemicals since they don`t require any additional procurement of resources when manufacturing them domestically compared with importing them from abroad. Growing Industrialization & Economic Growth: In recent years there has been a surge in industrial activity across Indonesia thanks largely due to steady economic growth rates experienced within this region over time coupled with favourable policies implemented by the government towards investments made into industrial sectors like petrochemicals among others; both of which have helped drive up demand for chlorinated items significantly.
COVID-19 Impact on the Market
Due To COVID-19 pandemic many Chlorine producers had seen significant dip in sales volumes during 2025 mainly because lockdowns imposed globally had resulted in shutdowns/disruptions along entire value chain leading up till end user level consequently pushing down prices caused by excess supply situation developing during period. However sale volumes slowly started recovering from 2nd half 2025 onwards once lockdown restrictions were relaxed little bit.
Challenges of the Market
challenge faced by players operating within Indonesia Chlorine Market pertains stricter environmental regulations being imposed on Companies owing to rise concerns around environmental pollution both air & ground pollution levels led primarily through
Industry Key Players
Some of the key players in Indonesia chlorine market include Akzo Nobel NV (Netherlands), BASF SE (Germany), Solvay SA (Belgium), Kemira Oyj (Finland) and DOW Chemical Company (U.S.). These companies are mainly engaged in producing chloralkali products used by various end-user industries such as food & beverages, cosmetics, electronics & electrical equipment manufacturing etc.
Key Highlights of the Report:
- Indonesia Chlorine Market Outlook
- Market Size of Indonesia Chlorine Market, 2025
- Forecast of Indonesia Chlorine Market, 2032
- Historical Data and Forecast of Indonesia Chlorine Revenues & Volume for the Period 2022-2032F
- Indonesia Chlorine Market Trend Evolution
- Indonesia Chlorine Market Drivers and Challenges
- Indonesia Chlorine Price Trends
- Indonesia Chlorine Porter's Five Forces
- Indonesia Chlorine Industry Life Cycle
- Historical Data and Forecast of Indonesia Chlorine Market Revenues & Volume By Application for the Period 2022-2032F
- Historical Data and Forecast of Indonesia Chlorine Market Revenues & Volume By EDC/PVC for the Period 2022-2032F
- Historical Data and Forecast of Indonesia Chlorine Market Revenues & Volume By Isocyanates and Oxygenates for the Period 2022-2032F
- Historical Data and Forecast of Indonesia Chlorine Market Revenues & Volume By Chloromethanes for the Period 2022-2032F
- Historical Data and Forecast of Indonesia Chlorine Market Revenues & Volume By Solvents and Epichlorohydrin for the Period 2022-2032F
- Historical Data and Forecast of Indonesia Chlorine Market Revenues & Volume By Inorganic Chemicals for the Period 2022-2032F
- Historical Data and Forecast of Indonesia Chlorine Market Revenues & Volume By Other Applications for the Period 2022-2032F
- Historical Data and Forecast of Indonesia Chlorine Market Revenues & Volume By End-user Industry for the Period 2022-2032F
- Historical Data and Forecast of Indonesia Chlorine Market Revenues & Volume By Water Treatment for the Period 2022-2032F
- Historical Data and Forecast of Indonesia Chlorine Market Revenues & Volume By Pharmaceutical for the Period 2022-2032F
- Historical Data and Forecast of Indonesia Chlorine Market Revenues & Volume By Chemicals for the Period 2022-2032F
- Historical Data and Forecast of Indonesia Chlorine Market Revenues & Volume By Paper and Pulp for the Period 2022-2032F
- Historical Data and Forecast of Indonesia Chlorine Market Revenues & Volume By Plastic for the Period 2022-2032F
- Historical Data and Forecast of Indonesia Chlorine Market Revenues & Volume By Pesticides for the Period 2022-2032F
- Historical Data and Forecast of Indonesia Chlorine Market Revenues & Volume By Other End-user Industries for the Period 2022-2032F
- Indonesia Chlorine Import Export Trade Statistics
- Market Opportunity Assessment By Application
- Market Opportunity Assessment By End-user Industry
- Indonesia Chlorine Top Companies Market Share
- Indonesia Chlorine Competitive Benchmarking By Technical and Operational Parameters
- Indonesia Chlorine Company Profiles
- Indonesia Chlorine Key Strategic Recommendations
Indonesia Chlorine Market (2026-2032): FAQs
6Wresearch actively monitors the Indonesia Chlorine Market and publishes its comprehensive annual report, highlighting emerging trends, growth drivers, revenue analysis, and forecast outlook. Our insights help businesses to make data-backed strategic decisions with ongoing market dynamics. Our analysts track relevent industries related to the Indonesia Chlorine Market, allowing our clients with actionable intelligence and reliable forecasts tailored to emerging regional needs.
Yes, we provide customisation as per your requirements. To learn more, feel free to contact us on sales@6wresearch.com
1 Executive Summary |
2 Introduction |
2.1 Key Highlights of the Report |
2.2 Report Description |
2.3 Market Scope & Segmentation |
2.4 Research Methodology |
2.5 Assumptions |
3 Indonesia Chlorine Market Overview |
3.1 Indonesia Country Macro Economic Indicators |
3.2 Indonesia Chlorine Market Revenues & Volume, 2022 & 2032F |
3.3 Indonesia Chlorine Market - Industry Life Cycle |
3.4 Indonesia Chlorine Market - Porter's Five Forces |
3.5 Indonesia Chlorine Market Revenues & Volume Share, By Application, 2022 & 2032F |
3.6 Indonesia Chlorine Market Revenues & Volume Share, By End-user Industry, 2022 & 2032F |
4 Indonesia Chlorine Market Dynamics |
4.1 Impact Analysis |
4.2 Market Drivers |
4.2.1 Increasing demand for chlorine in water treatment, especially in Indonesia where clean water supply is a significant concern. |
4.2.2 Growth in the chemical industry in Indonesia, leading to higher consumption of chlorine in manufacturing processes. |
4.2.3 Rising awareness about the importance of hygiene and sanitation, driving the demand for chlorine-based disinfectants. |
4.3 Market Restraints |
4.3.1 Fluctuating prices of raw materials used in chlorine production, impacting the overall cost and profitability. |
4.3.2 Stringent regulations and environmental concerns regarding the handling and disposal of chlorine products. |
5 Indonesia Chlorine Market Trends |
6 Indonesia Chlorine Market, By Types |
6.1 Indonesia Chlorine Market, By Application |
6.1.1 Overview and Analysis |
6.1.2 Indonesia Chlorine Market Revenues & Volume, By Application, 2022-2032F |
6.1.3 Indonesia Chlorine Market Revenues & Volume, By EDC/PVC, 2022-2032F |
6.1.4 Indonesia Chlorine Market Revenues & Volume, By Isocyanates and Oxygenates, 2022-2032F |
6.1.5 Indonesia Chlorine Market Revenues & Volume, By Chloromethanes, 2022-2032F |
6.1.6 Indonesia Chlorine Market Revenues & Volume, By Solvents and Epichlorohydrin, 2022-2032F |
6.1.7 Indonesia Chlorine Market Revenues & Volume, By Inorganic Chemicals, 2022-2032F |
6.1.8 Indonesia Chlorine Market Revenues & Volume, By Other Applications, 2022-2032F |
6.2 Indonesia Chlorine Market, By End-user Industry |
6.2.1 Overview and Analysis |
6.2.2 Indonesia Chlorine Market Revenues & Volume, By Water Treatment, 2022-2032F |
6.2.3 Indonesia Chlorine Market Revenues & Volume, By Pharmaceutical, 2022-2032F |
6.2.4 Indonesia Chlorine Market Revenues & Volume, By Chemicals, 2022-2032F |
6.2.5 Indonesia Chlorine Market Revenues & Volume, By Paper and Pulp, 2022-2032F |
6.2.6 Indonesia Chlorine Market Revenues & Volume, By Plastic, 2022-2032F |
6.2.7 Indonesia Chlorine Market Revenues & Volume, By Pesticides, 2022-2032F |
7 Indonesia Chlorine Market Import-Export Trade Statistics |
7.1 Indonesia Chlorine Market Export to Major Countries |
7.2 Indonesia Chlorine Market Imports from Major Countries |
8 Indonesia Chlorine Market Key Performance Indicators |
8.1 Number of water treatment projects using chlorine in Indonesia. |
8.2 Adoption rate of chlorine-based products in different industries. |
8.3 Investment in research and development for chlorine-related technologies. |
8.4 Percentage of compliance with environmental regulations related to chlorine usage. |
8.5 Number of new applications or innovations utilizing chlorine in Indonesia. |
9 Indonesia Chlorine Market - Opportunity Assessment |
9.1 Indonesia Chlorine Market Opportunity Assessment, By Application, 2022 & 2032F |
9.2 Indonesia Chlorine Market Opportunity Assessment, By End-user Industry, 2022 & 2032F |
10 Indonesia Chlorine Market - Competitive Landscape |
10.1 Indonesia Chlorine Market Revenue Share, By Companies, 2025 |
10.2 Indonesia Chlorine Market Competitive Benchmarking, By Operating and Technical Parameters |
11 Company Profiles |
12 Recommendations |
13 Disclaimer |
Export potential assessment - trade Analytics for 2030
Export potential enables firms to identify high-growth global markets with greater confidence by combining advanced trade intelligence with a structured quantitative methodology. The framework analyzes emerging demand trends and country-level import patterns while integrating macroeconomic and trade datasets such as GDP and population forecasts, bilateral import–export flows, tariff structures, elasticity differentials between developed and developing economies, geographic distance, and import demand projections. Using weighted trade values from 2020–2024 as the base period to project country-to-country export potential for 2030, these inputs are operationalized through calculated drivers such as gravity model parameters, tariff impact factors, and projected GDP per-capita growth. Through an analysis of hidden potentials, demand hotspots, and market conditions that are most favorable to success, this method enables firms to focus on target countries, maximize returns, and global expansion with data, backed by accuracy.
By factoring in the projected importer demand gap that is currently unmet and could be potential opportunity, it identifies the potential for the Exporter (Country) among 190 countries, against the general trade analysis, which identifies the biggest importer or exporter.
To discover high-growth global markets and optimize your business strategy:
Click Here
Pricing
- Single User License$ 1,995
- Department License$ 2,400
- Site License$ 3,120
- Global License$ 3,795

Search
Thought Leadership and Analyst Meet


Our Clients
Related Reports
- United Kingdom (UK) Long-term Care Insurance Market (2026-2032) | Growth, Share, Consumer Insights, Drivers, Opportunities, Competition, Pricing Analysis, Segments, Restraints, Companies, Competitive, Value, Outlook, Size, Demand, Analysis, Challenges, Strategic Insights, Investment Trends, Revenue, Trends, Supply, Forecast
- United Kingdom (UK) Long Term Care Market (2026-2032) | Companies, Outlook, Analysis, Trends, Value, Revenue, Segmentation, Share, Forecast, Competitive Landscape, Growth, Size & Forecast
- Iraq Insulation and Waterproofing Market (2026-2032) | Outlook, Drivers, Growth, Size, Share, Industry, Revenue, Trends, Demand, Competitive, Strategic Insights, Opportunities, Segments, Companies, Challenges, Strategy, Consumer Insights, Analysis, Investment Trends, Value, Segmentation, Forecast, Restraints
- India Switchgear Market Outlook (2026 - 2032) | Size, Share, Trends, Growth, Revenue, Forecast, Analysis, Value, Outlook
- Pakistan Contraceptive Implants Market (2025-2031) | Demand, Growth, Size, Share, Industry, Pricing Analysis, Competitive, Strategic Insights, Strategy, Consumer Insights, Analysis, Investment Trends, Opportunities, Revenue, Segments, Value, Segmentation, Supply, Forecast, Restraints, Outlook, Competition, Drivers, Trends, Companies, Challenges
- Sri Lanka Packaging Market (2026-2032) | Outlook, Competition, Drivers, Trends, Demand, Pricing Analysis, Competitive, Strategic Insights, Companies, Challenges, Strategy, Consumer Insights, Analysis, Investment Trends, Opportunities, Growth, Size, Share, Industry, Revenue, Segments, Value, Segmentation, Supply, Forecast, Restraints
- India Kids Watches Market (2026-2032) | Strategy, Consumer Insights, Analysis, Investment Trends, Opportunities, Growth, Size, Share, Industry, Revenue, Segments, Value, Segmentation, Supply, Forecast, Restraints, Outlook, Competition, Drivers, Trends, Demand, Pricing Analysis, Competitive, Strategic Insights, Companies, Challenges
- Saudi Arabia Core Assurance Service Market (2025-2031) | Strategy, Consumer Insights, Analysis, Investment Trends, Opportunities, Growth, Size, Share, Industry, Revenue, Segments, Value, Segmentation, Supply, Forecast, Restraints, Outlook, Competition, Drivers, Trends, Demand, Pricing Analysis, Competitive, Strategic Insights, Companies, Challenges
- Romania Uninterruptible Power Supply (UPS) Market (2026-2032) | Industry, Analysis, Revenue, Size, Forecast, Outlook, Value, Trends, Share, Growth & Companies
- Saudi Arabia Car Window Tinting Film, Paint Protection Film (PPF), and Ceramic Coating Market (2025-2031) | Strategy, Consumer Insights, Analysis, Investment Trends, Opportunities, Growth, Size, Share, Industry, Revenue, Segments, Value, Segmentation, Supply, Forecast, Restraints, Outlook, Competition, Drivers, Trends, Demand, Pricing Analysis, Competitive, Strategic Insights, Companies, Challenges
Industry Events and Analyst Meet

India EV Show 2026

EV tech India Expo 2026

Auto Tech Asia 2026

Battery Tech India 2026

Smart Production Solutions Guangzhou 2026
Whitepaper
- Middle East & Africa Commercial Security Market Click here to view more.
- Middle East & Africa Fire Safety Systems & Equipment Market Click here to view more.
- GCC Drone Market Click here to view more.
- Middle East Lighting Fixture Market Click here to view more.
- GCC Physical & Perimeter Security Market Click here to view more.
6WResearch In News
- Doha a strategic location for EV manufacturing hub: IPA Qatar
- Demand for luxury TVs surging in the GCC, says Samsung
- Empowering Growth: The Thriving Journey of Bangladesh’s Cable Industry
- Demand for luxury TVs surging in the GCC, says Samsung
- Video call with a traditional healer? Once unthinkable, it’s now common in South Africa
- Intelligent Buildings To Smooth GCC’s Path To Net Zero