Indonesia Cleaning Mops Market (2024-2030) Outlook | Share, Analysis, Trends, Industry, Forecast, Size, Growth, Revenue, Value & Companies
Market Forecast By Product Type (Dry mops, Wet mops, Mops for pre-moisting, Hot mops, Syntho-mop, Microfiber mops), By End-User (Residential, Commercial, Industrial), By Distribution Channel (Online channel, Offline channel) And Competitive Landscape
| Product Code: ETC127883 | Publication Date: Jul 2023 | Updated Date: Jan 2026 | Product Type: Report | |
| Publisher: 6Wresearch | Author: Ravi Bhandari | No. of Pages: 70 | No. of Figures: 35 | No. of Tables: 5 |
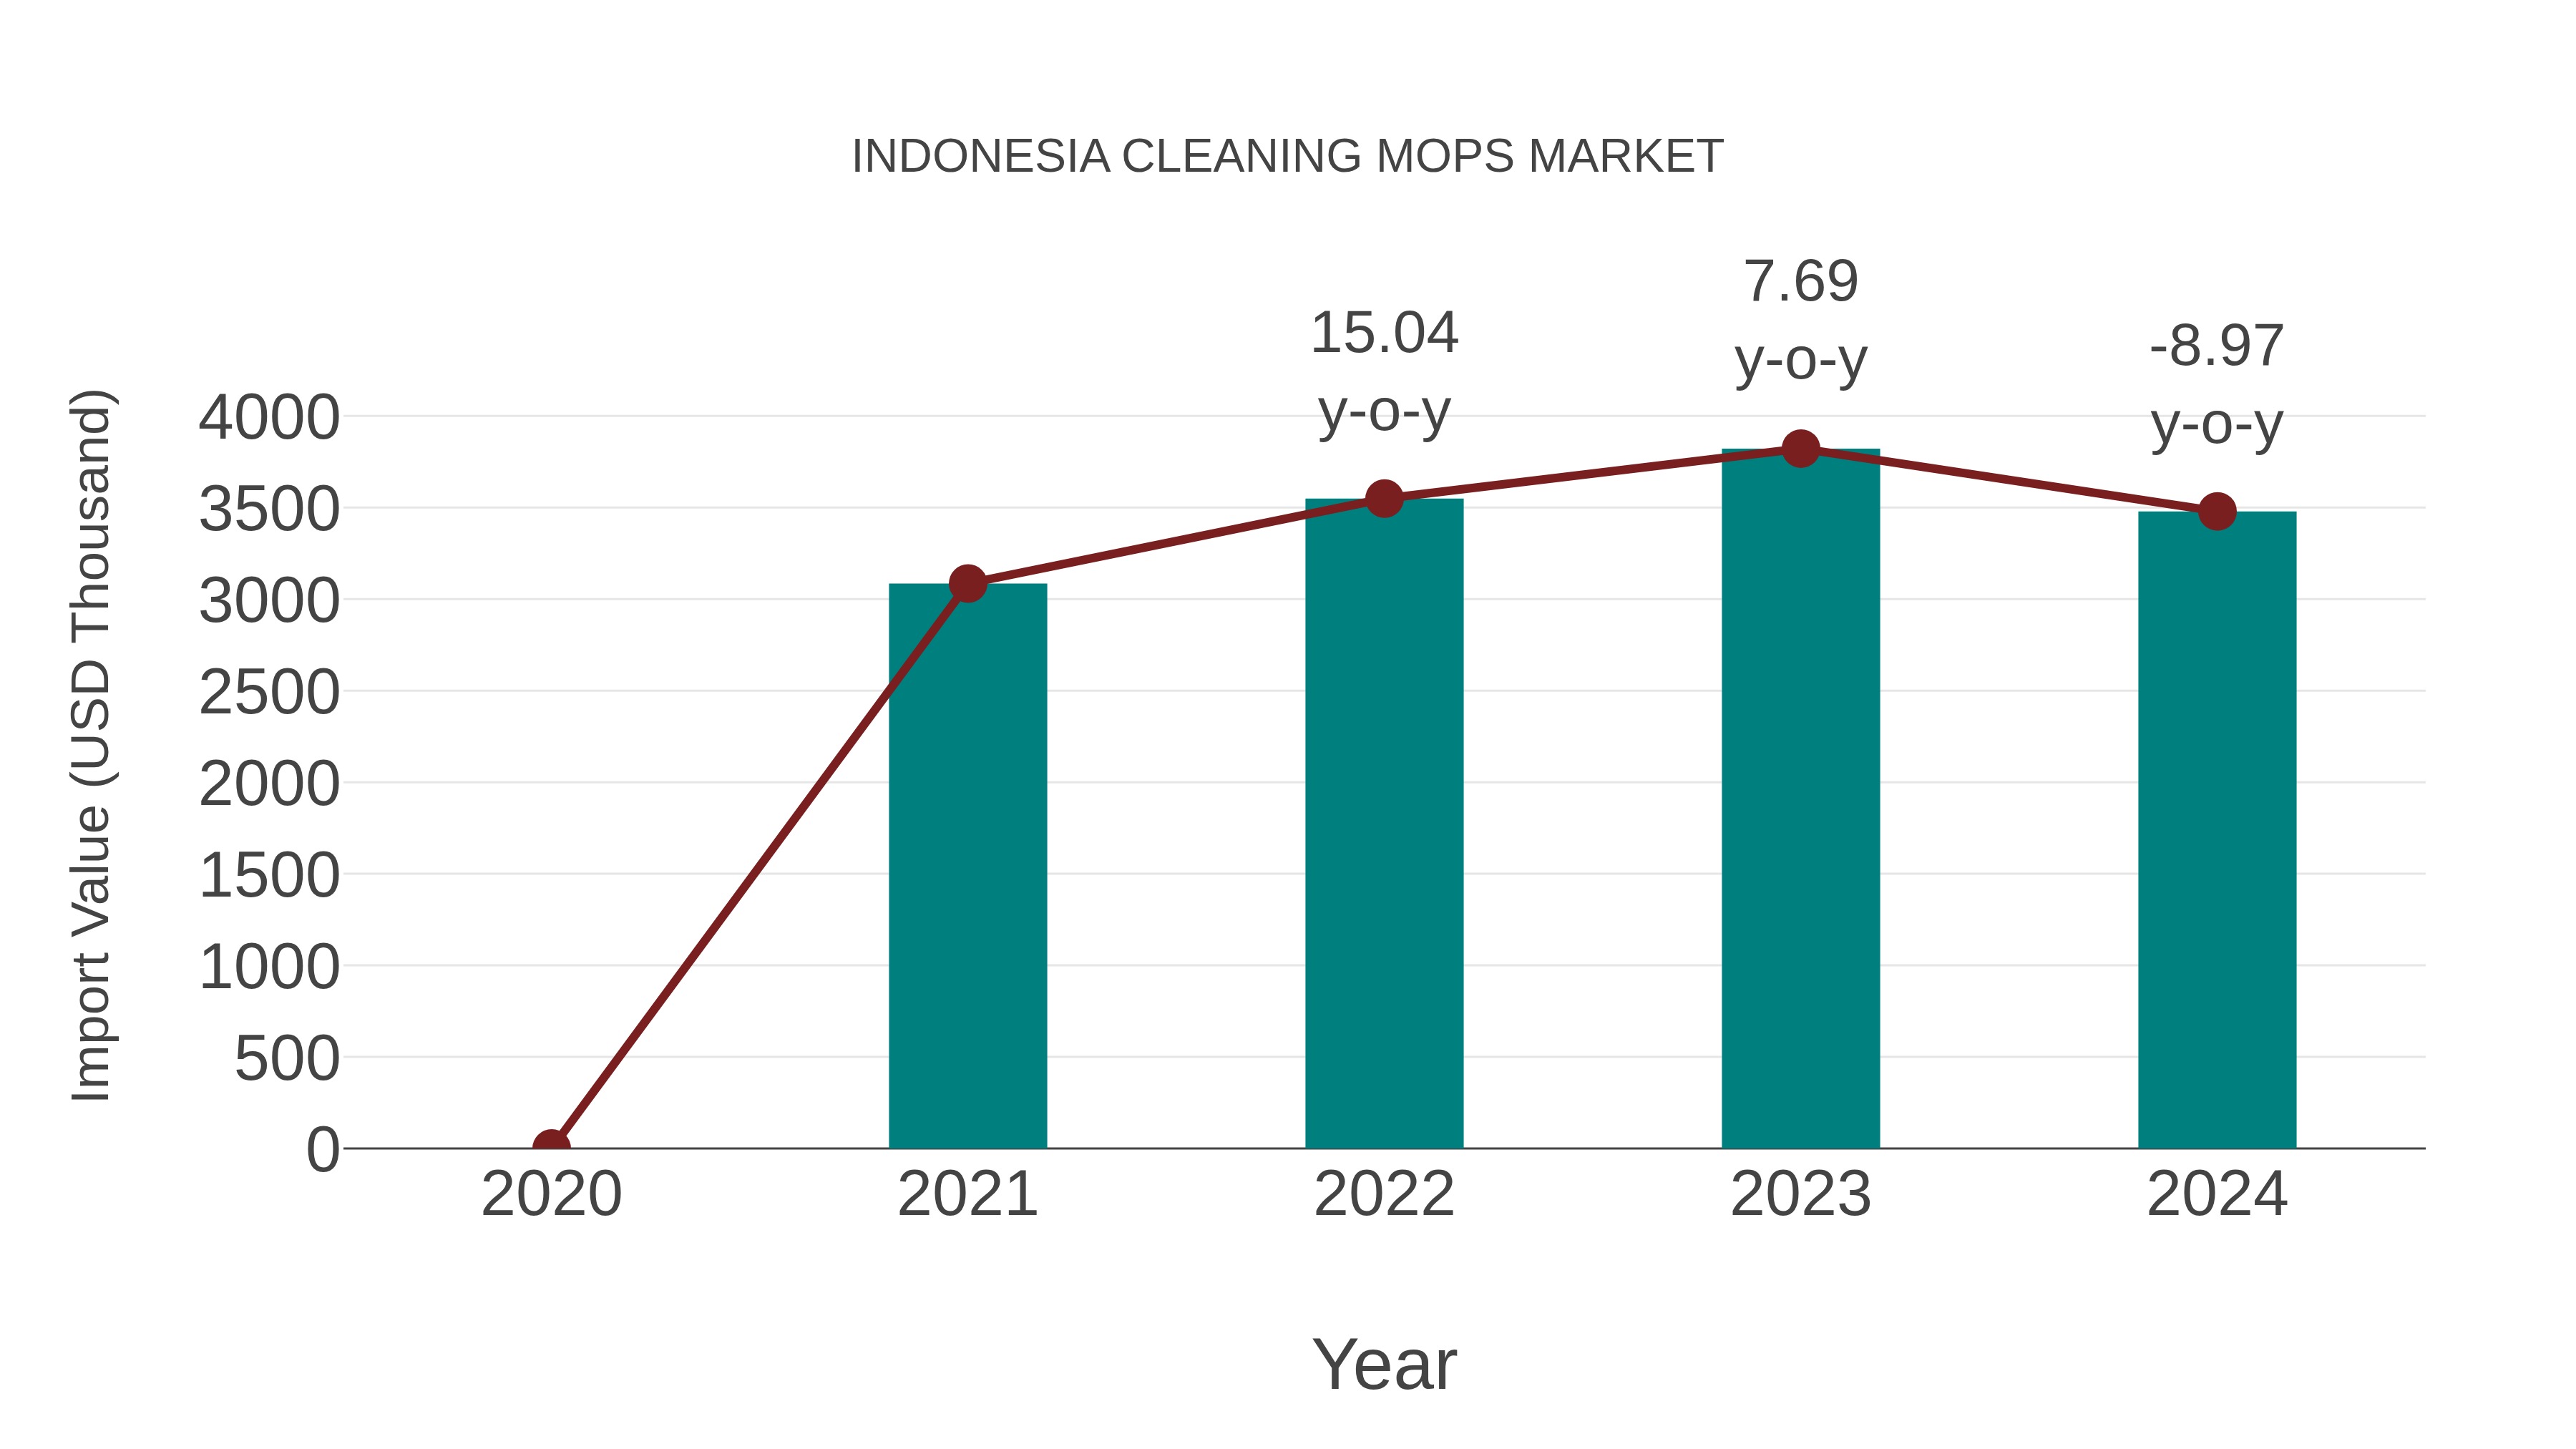
Indonesia Cleaning Mops Market: Import Trend Analysis
In the Indonesia cleaning mops market, the import trend experienced a decline from 2023 to 2024, with a growth rate of -8.97%. However, the compound annual growth rate (CAGR) for the period 2020-2024 stood at 4.09%. This negative import momentum in 2024 could be attributed to shifts in consumer preferences or changes in trade policies impacting market stability.
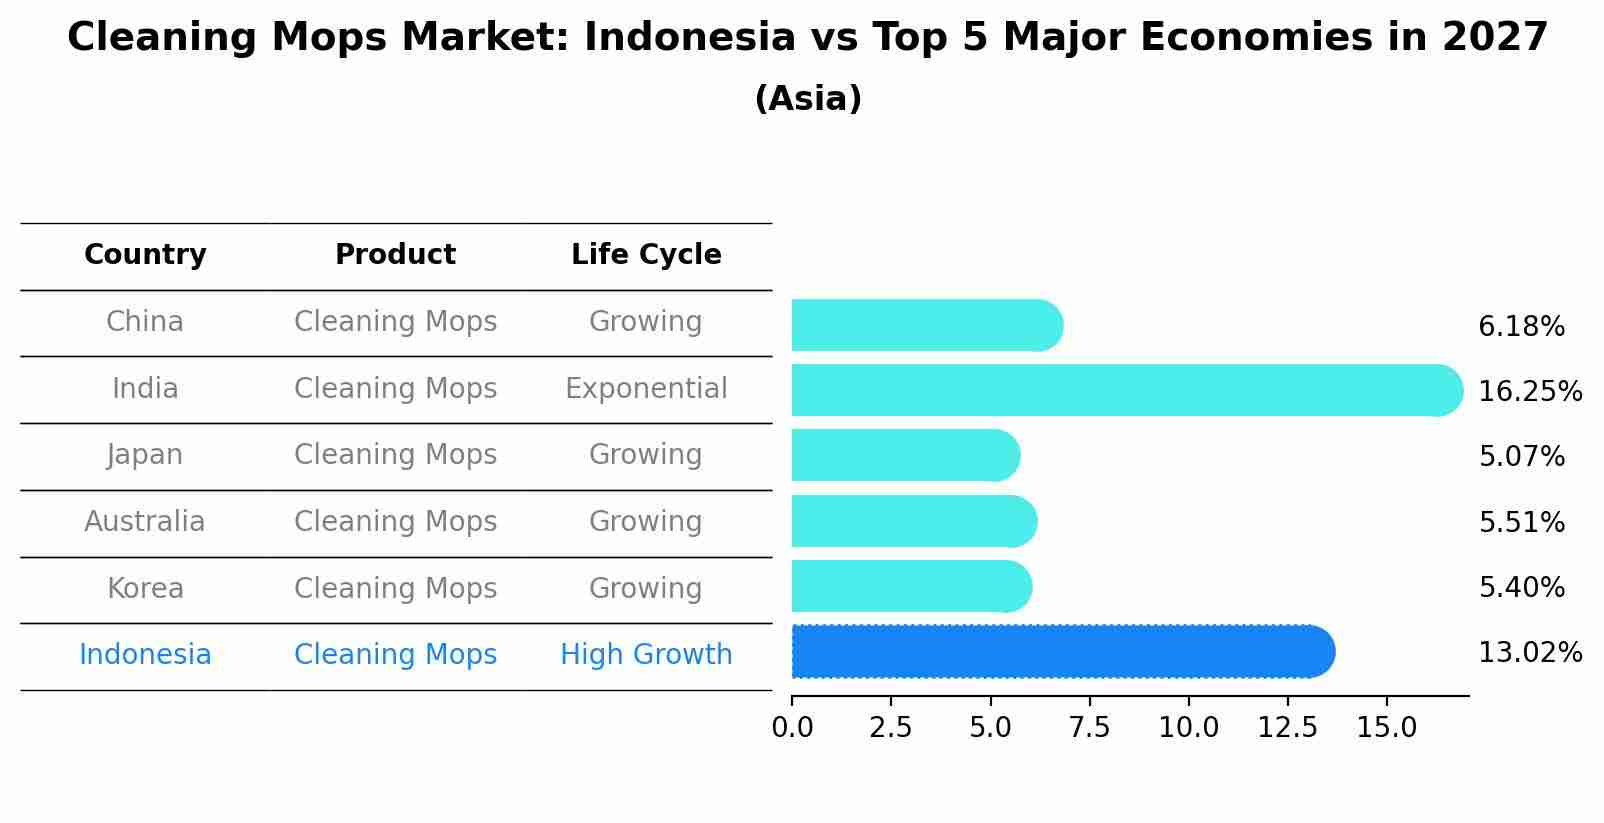
Cleaning Mops Market: Indonesia vs Top 5 Major Economies in 2027 (Asia)
By 2027, Indonesia's Cleaning Mops market is forecasted to achieve a high growth rate of 13.02%, with China leading the Asia region, followed by India, Japan, Australia and South Korea.
Indonesia Cleaning Mops Market Synopsis
Indonesia Cleaning Mops Market is projected to grow since Indonesia is a rapidly growing market for cleaning mops. The country`s population growth, increasing urbanization, rising consumer spending on home products and the increasing trend of micro-apartment living are major drivers of this rise in demand. Furthermore, Indonesia hospitality sector has been growing steadily due to increased tourism and business investments; creating additional demand for cleaning mops from hotels and other establishments.
Challenges Facing the Market
The main challenge affecting the Indonesia cleaning mop market is the availability of counterfeit goods as well as poor quality local brands which have resulted in high pricing pressure from consumers who seek low cost alternatives to branded products. In addition, there is limited access to advanced technology such as automatic mopping robots that are being used in international markets, constraining development of the industry domestically.
Key Market Players
Major players operating in the Indonesia Cleaning Mop Market include 3M Company (U.S.), Unilever (U.K.), SC Johnson & Son Inc.(US), K?rcher International GmbH(Germany) and Dyson Ltd.(UK).
Key Highlights of the Report:
- Indonesia Cleaning Mops Market Outlook
- Market Size of Indonesia Cleaning Mops Market, 2020
- Forecast of Indonesia Cleaning Mops Market, 2027
- Historical Data and Forecast of Indonesia Cleaning Mops Revenues & Volume for the Period 2023 - 2027
- Indonesia Cleaning Mops Market Trend Evolution
- Indonesia Cleaning Mops Market Drivers and Challenges
- Indonesia Cleaning Mops Price Trends
- Indonesia Cleaning Mops Porter's Five Forces
- Indonesia Cleaning Mops Industry Life Cycle
- Historical Data and Forecast of Indonesia Cleaning Mops Market Revenues & Volume By Product Type for the Period 2023 - 2027
- Historical Data and Forecast of Indonesia Cleaning Mops Market Revenues & Volume By Dry mops for the Period 2023 - 2027
- Historical Data and Forecast of Indonesia Cleaning Mops Market Revenues & Volume By Wet mops for the Period 2023 - 2027
- Historical Data and Forecast of Indonesia Cleaning Mops Market Revenues & Volume By Mops for pre-moisting for the Period 2023 - 2027
- Historical Data and Forecast of Indonesia Cleaning Mops Market Revenues & Volume By Hot mops for the Period 2023 - 2027
- Historical Data and Forecast of Indonesia Cleaning Mops Market Revenues & Volume By Syntho-mop for the Period 2023 - 2027
- Historical Data and Forecast of Indonesia Cleaning Mops Market Revenues & Volume By Microfiber mops for the Period 2023 - 2027
- Historical Data and Forecast of Indonesia Cleaning Mops Market Revenues & Volume By End-User for the Period 2023 - 2027
- Historical Data and Forecast of Indonesia Cleaning Mops Market Revenues & Volume By Residential for the Period 2023 - 2027
- Historical Data and Forecast of Indonesia Cleaning Mops Market Revenues & Volume By Commercial for the Period 2023 - 2027
- Historical Data and Forecast of Indonesia Cleaning Mops Market Revenues & Volume By Industrial for the Period 2023 - 2027
- Historical Data and Forecast of Indonesia Cleaning Mops Market Revenues & Volume By Distribution Channel for the Period 2023 - 2027
- Historical Data and Forecast of Indonesia Cleaning Mops Market Revenues & Volume By Online channel for the Period 2023 - 2027
- Historical Data and Forecast of Indonesia Cleaning Mops Market Revenues & Volume By Offline channel for the Period 2023 - 2027
- Indonesia Cleaning Mops Import Export Trade Statistics
- Market Opportunity Assessment By Product Type
- Market Opportunity Assessment By End-User
- Market Opportunity Assessment By Distribution Channel
- Indonesia Cleaning Mops Top Companies Market Share
- Indonesia Cleaning Mops Competitive Benchmarking By Technical and Operational Parameters
- Indonesia Cleaning Mops Company Profiles
- Indonesia Cleaning Mops Key Strategic Recommendations
Frequently Asked Questions About the Market Study (FAQs):
6Wresearch actively monitors the Indonesia Cleaning Mops Market and publishes its comprehensive annual report, highlighting emerging trends, growth drivers, revenue analysis, and forecast outlook. Our insights help businesses to make data-backed strategic decisions with ongoing market dynamics. Our analysts track relevent industries related to the Indonesia Cleaning Mops Market, allowing our clients with actionable intelligence and reliable forecasts tailored to emerging regional needs.
Yes, we provide customisation as per your requirements. To learn more, feel free to contact us on sales@6wresearch.com
Indonesia Cleaning Mops |
1 Executive Summary |
2 Introduction |
2.1 Key Highlights of the Report |
2.2 Report Description |
2.3 Market Scope & Segmentation |
2.4 Research Methodology |
2.5 Assumptions |
3 Indonesia Cleaning Mops Market Overview |
3.1 Indonesia Country Macro Economic Indicators |
3.2 Indonesia Cleaning Mops Market Revenues & Volume, 2020 & 2027F |
3.3 Indonesia Cleaning Mops Market - Industry Life Cycle |
3.4 Indonesia Cleaning Mops Market - Porter's Five Forces |
3.5 Indonesia Cleaning Mops Market Revenues & Volume Share, By Product Type, 2020 & 2027F |
3.6 Indonesia Cleaning Mops Market Revenues & Volume Share, By End-User, 2020 & 2027F |
3.7 Indonesia Cleaning Mops Market Revenues & Volume Share, By Distribution Channel, 2020 & 2027F |
4 Indonesia Cleaning Mops Market Dynamics |
4.1 Impact Analysis |
4.2 Market Drivers |
4.2.1 Increasing awareness about hygiene and cleanliness among Indonesian households |
4.2.2 Growing urbanization leading to smaller living spaces which increase the demand for convenient cleaning tools like mops |
4.2.3 Rising disposable income levels in Indonesia driving the adoption of advanced cleaning products |
4.3 Market Restraints |
4.3.1 Competition from alternative cleaning tools such as vacuum cleaners and cleaning services |
4.3.2 Price sensitivity among consumers in Indonesia |
4.3.3 Lack of awareness about the benefits of using specific types of mops for different surfaces |
5 Indonesia Cleaning Mops Market Trends |
6 Indonesia Cleaning Mops Market, By Types |
6.1 Indonesia Cleaning Mops Market, By Product Type |
6.1.1 Overview and Analysis |
6.1.2 Indonesia Cleaning Mops Market Revenues & Volume, By Product Type, 2018 - 2027F |
6.1.3 Indonesia Cleaning Mops Market Revenues & Volume, By Dry mops, 2018 - 2027F |
6.1.4 Indonesia Cleaning Mops Market Revenues & Volume, By Wet mops, 2018 - 2027F |
6.1.5 Indonesia Cleaning Mops Market Revenues & Volume, By Mops for pre-moisting, 2018 - 2027F |
6.1.6 Indonesia Cleaning Mops Market Revenues & Volume, By Hot mops, 2018 - 2027F |
6.1.7 Indonesia Cleaning Mops Market Revenues & Volume, By Syntho-mop, 2018 - 2027F |
6.1.8 Indonesia Cleaning Mops Market Revenues & Volume, By Microfiber mops, 2018 - 2027F |
6.2 Indonesia Cleaning Mops Market, By End-User |
6.2.1 Overview and Analysis |
6.2.2 Indonesia Cleaning Mops Market Revenues & Volume, By Residential, 2018 - 2027F |
6.2.3 Indonesia Cleaning Mops Market Revenues & Volume, By Commercial, 2018 - 2027F |
6.2.4 Indonesia Cleaning Mops Market Revenues & Volume, By Industrial, 2018 - 2027F |
6.3 Indonesia Cleaning Mops Market, By Distribution Channel |
6.3.1 Overview and Analysis |
6.3.2 Indonesia Cleaning Mops Market Revenues & Volume, By Online channel, 2018 - 2027F |
6.3.3 Indonesia Cleaning Mops Market Revenues & Volume, By Offline channel, 2018 - 2027F |
7 Indonesia Cleaning Mops Market Import-Export Trade Statistics |
7.1 Indonesia Cleaning Mops Market Export to Major Countries |
7.2 Indonesia Cleaning Mops Market Imports from Major Countries |
8 Indonesia Cleaning Mops Market Key Performance Indicators |
8.1 Household penetration rate of cleaning mops in urban areas |
8.2 Growth in the sales of eco-friendly mops in Indonesia |
8.3 Number of new product launches and innovations in the cleaning mop market |
9 Indonesia Cleaning Mops Market - Opportunity Assessment |
9.1 Indonesia Cleaning Mops Market Opportunity Assessment, By Product Type, 2020 & 2027F |
9.2 Indonesia Cleaning Mops Market Opportunity Assessment, By End-User, 2020 & 2027F |
9.3 Indonesia Cleaning Mops Market Opportunity Assessment, By Distribution Channel, 2020 & 2027F |
10 Indonesia Cleaning Mops Market - Competitive Landscape |
10.1 Indonesia Cleaning Mops Market Revenue Share, By Companies, 2020 |
10.2 Indonesia Cleaning Mops Market Competitive Benchmarking, By Operating and Technical Parameters |
11 Company Profiles |
12 Recommendations |
13 Disclaimer |
Export potential assessment - trade Analytics for 2030
Export potential enables firms to identify high-growth global markets with greater confidence by combining advanced trade intelligence with a structured quantitative methodology. The framework analyzes emerging demand trends and country-level import patterns while integrating macroeconomic and trade datasets such as GDP and population forecasts, bilateral import–export flows, tariff structures, elasticity differentials between developed and developing economies, geographic distance, and import demand projections. Using weighted trade values from 2020–2024 as the base period to project country-to-country export potential for 2030, these inputs are operationalized through calculated drivers such as gravity model parameters, tariff impact factors, and projected GDP per-capita growth. Through an analysis of hidden potentials, demand hotspots, and market conditions that are most favorable to success, this method enables firms to focus on target countries, maximize returns, and global expansion with data, backed by accuracy.
By factoring in the projected importer demand gap that is currently unmet and could be potential opportunity, it identifies the potential for the Exporter (Country) among 190 countries, against the general trade analysis, which identifies the biggest importer or exporter.
To discover high-growth global markets and optimize your business strategy:
Click Here
Pricing
- Single User License$ 1,995
- Department License$ 2,400
- Site License$ 3,120
- Global License$ 3,795

Search
Thought Leadership and Analyst Meet


Our Clients
Related Reports
- India Switchgear Market Outlook (2026 - 2032) | Size, Share, Trends, Growth, Revenue, Forecast, Analysis, Value, Outlook
- Pakistan Contraceptive Implants Market (2025-2031) | Demand, Growth, Size, Share, Industry, Pricing Analysis, Competitive, Strategic Insights, Strategy, Consumer Insights, Analysis, Investment Trends, Opportunities, Revenue, Segments, Value, Segmentation, Supply, Forecast, Restraints, Outlook, Competition, Drivers, Trends, Companies, Challenges
- Sri Lanka Packaging Market (2026-2032) | Outlook, Competition, Drivers, Trends, Demand, Pricing Analysis, Competitive, Strategic Insights, Companies, Challenges, Strategy, Consumer Insights, Analysis, Investment Trends, Opportunities, Growth, Size, Share, Industry, Revenue, Segments, Value, Segmentation, Supply, Forecast, Restraints
- India Kids Watches Market (2026-2032) | Strategy, Consumer Insights, Analysis, Investment Trends, Opportunities, Growth, Size, Share, Industry, Revenue, Segments, Value, Segmentation, Supply, Forecast, Restraints, Outlook, Competition, Drivers, Trends, Demand, Pricing Analysis, Competitive, Strategic Insights, Companies, Challenges
- Saudi Arabia Core Assurance Service Market (2025-2031) | Strategy, Consumer Insights, Analysis, Investment Trends, Opportunities, Growth, Size, Share, Industry, Revenue, Segments, Value, Segmentation, Supply, Forecast, Restraints, Outlook, Competition, Drivers, Trends, Demand, Pricing Analysis, Competitive, Strategic Insights, Companies, Challenges
- Romania Uninterruptible Power Supply (UPS) Market (2026-2032) | Industry, Analysis, Revenue, Size, Forecast, Outlook, Value, Trends, Share, Growth & Companies
- Saudi Arabia Car Window Tinting Film, Paint Protection Film (PPF), and Ceramic Coating Market (2025-2031) | Strategy, Consumer Insights, Analysis, Investment Trends, Opportunities, Growth, Size, Share, Industry, Revenue, Segments, Value, Segmentation, Supply, Forecast, Restraints, Outlook, Competition, Drivers, Trends, Demand, Pricing Analysis, Competitive, Strategic Insights, Companies, Challenges
- South Africa Stationery Market (2025-2031) | Share, Size, Industry, Value, Growth, Revenue, Analysis, Trends, Segmentation & Outlook
- Afghanistan Rocking Chairs And Adirondack Chairs Market (2026-2032) | Size & Revenue, Competitive Landscape, Share, Segmentation, Industry, Value, Outlook, Analysis, Trends, Growth, Forecast, Companies
- Afghanistan Apparel Market (2026-2032) | Growth, Outlook, Industry, Segmentation, Forecast, Size, Companies, Trends, Value, Share, Analysis & Revenue
Industry Events and Analyst Meet

India EV Show 2026

EV tech India Expo 2026

Auto Tech Asia 2026

Battery Tech India 2026

Smart Production Solutions Guangzhou 2026
Whitepaper
- Middle East & Africa Commercial Security Market Click here to view more.
- Middle East & Africa Fire Safety Systems & Equipment Market Click here to view more.
- GCC Drone Market Click here to view more.
- Middle East Lighting Fixture Market Click here to view more.
- GCC Physical & Perimeter Security Market Click here to view more.
6WResearch In News
- Doha a strategic location for EV manufacturing hub: IPA Qatar
- Demand for luxury TVs surging in the GCC, says Samsung
- Empowering Growth: The Thriving Journey of Bangladesh’s Cable Industry
- Demand for luxury TVs surging in the GCC, says Samsung
- Video call with a traditional healer? Once unthinkable, it’s now common in South Africa
- Intelligent Buildings To Smooth GCC’s Path To Net Zero