Indonesia Expanded Clay Market (2025-2031) Outlook | Forecast, Share, Industry, Trends, Revenue, Growth, Companies, Size, Analysis & Value
Market Forecast By Types (Up to 250 kg/mA, 250-280 kg/mA, 280-330 kg/mA, 330-500 kg/mA, Above 500 kg/mA), By Applications (Residential Building, Commercial Building, Infrastructure, Others) And Competitive Landscape
| Product Code: ETC274588 | Publication Date: Aug 2023 | Updated Date: Feb 2026 | Product Type: Market Research Report | |
| Publisher: 6Wresearch | Author: Ravi Bhandari | No. of Pages: 75 | No. of Figures: 35 | No. of Tables: 20 |
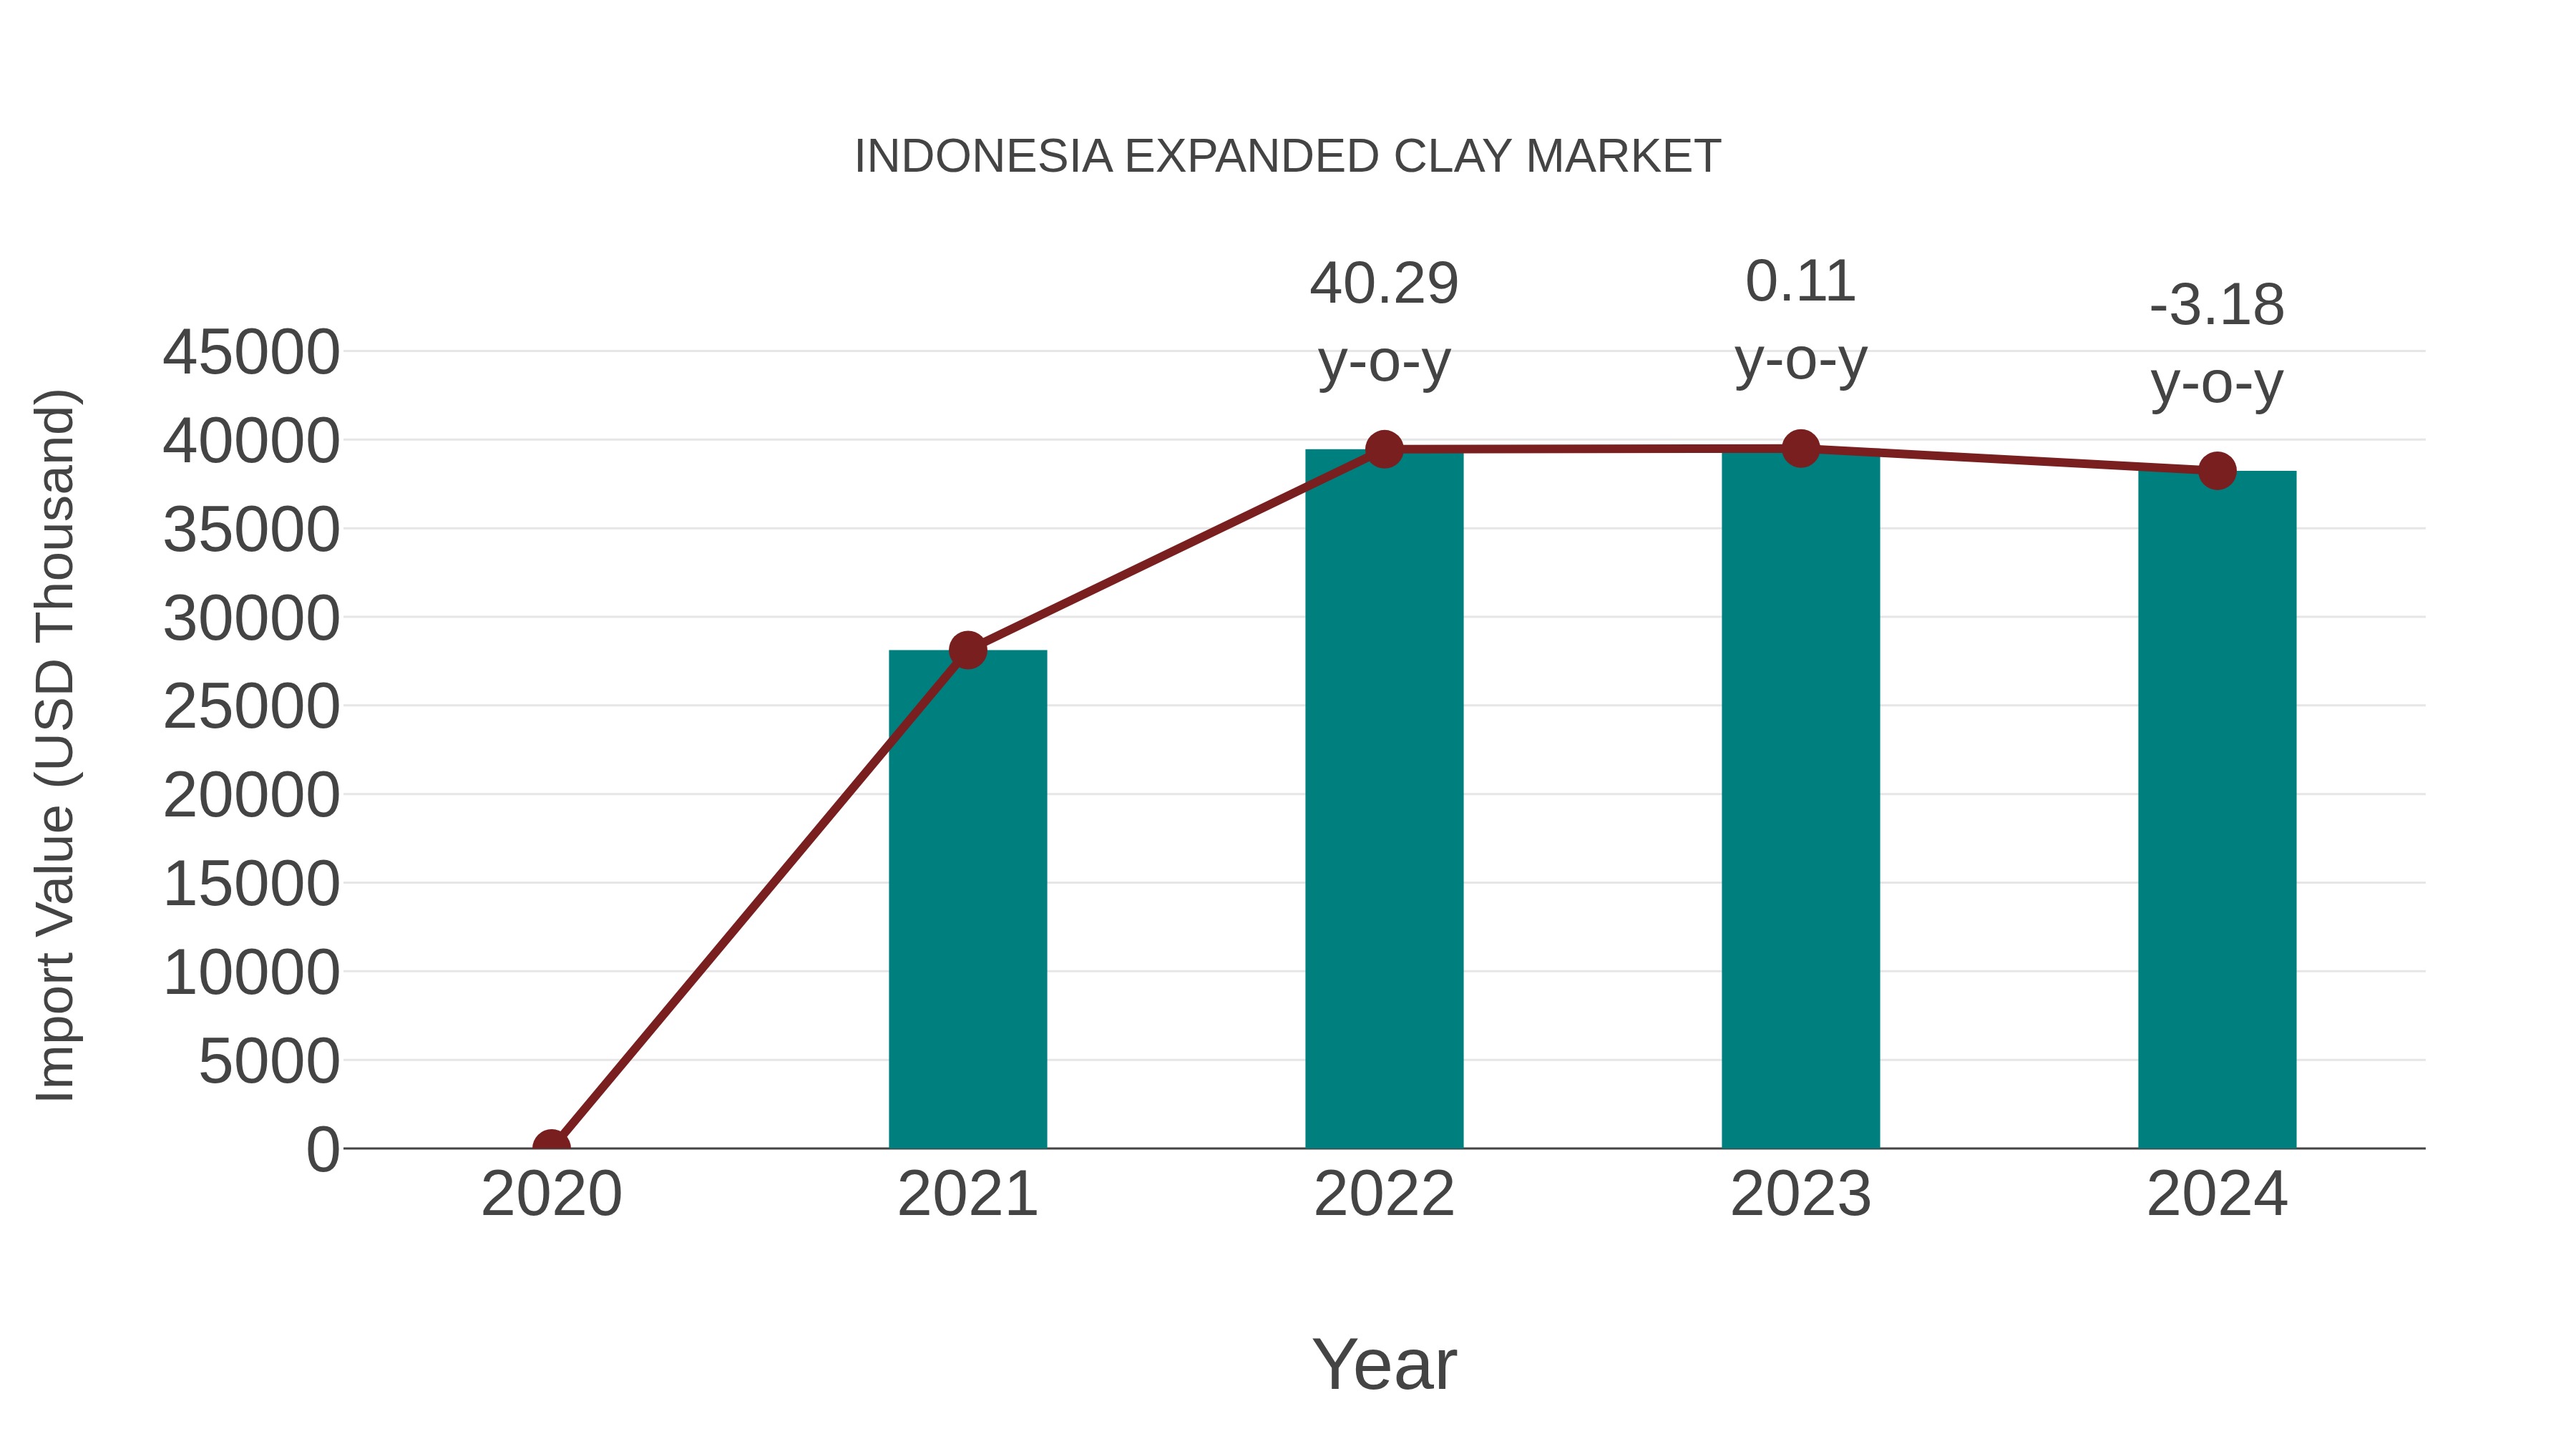
Indonesia Expanded Clay Market: Import Trend Analysis
In the Indonesia expanded clay market, the import trend experienced a -3.18% growth rate from 2023 to 2024, with a compound annual growth rate (CAGR) of 10.79% from 2020 to 2024. The decline in import momentum in 2024 could be attributed to shifts in demand dynamics or changes in trade policies affecting market stability.
Indonesia Expanded Clay Market Synopsis
The Indonesia expanded clay market size was estimated at USD 42 million in 2025 and is expected to grow with a CAGR of 5. 3% in the estimated years. The growing demand for lightweight concrete blocks across different segments including construction & infrastructure projects has been driving the market growth over past few years. Rising awareness regarding energy efficiency along with stringent regulations related to sustainable building practices are some other factors supporting overall industry progressions over decades ahead. Additionally, growing investments toward development of transport infrastructure coupled with rising focus on green buildings will propel product sales in future timeline.
Drivers of the Market
The demand for lightweight aggregate solutions in construction projects, such as lightweight concrete, drives the expanded clay market. The need for sustainable and energy-efficient building materials further boosts its growth.
Challenges of the Market
Raising awareness about expanded clay`s benefits, such as lightweight insulation and soil improvement, remains a challenge. Adapting to changing construction practices and material preferences is crucial.
COVID-19 Impact on the Market
The expanded clay market also felt the impact of COVID-19, primarily due to the slowdown in the construction sector. As the pandemic led to a decrease in construction activities, the demand for expanded clay as a lightweight aggregate in concrete and other construction applications declined. Market players faced challenges in maintaining production levels and fulfilling orders during the pandemic.
Key Highlights of the Report:
- Indonesia Expanded Clay Market Outlook
- Market Size of Indonesia Expanded Clay Market, 2024
- Forecast of Indonesia Expanded Clay Market, 2031
- Historical Data and Forecast of Indonesia Expanded Clay Revenues & Volume for the Period 2021-2031
- Indonesia Expanded Clay Market Trend Evolution
- Indonesia Expanded Clay Market Drivers and Challenges
- Indonesia Expanded Clay Price Trends
- Indonesia Expanded Clay Porter's Five Forces
- Indonesia Expanded Clay Industry Life Cycle
- Historical Data and Forecast of Indonesia Expanded Clay Market Revenues & Volume By Types for the Period 2021-2031
- Historical Data and Forecast of Indonesia Expanded Clay Market Revenues & Volume By Up to 250 kg/mA for the Period 2021-2031
- Historical Data and Forecast of Indonesia Expanded Clay Market Revenues & Volume By 250-280 kg/mA for the Period 2021-2031
- Historical Data and Forecast of Indonesia Expanded Clay Market Revenues & Volume By 280-330 kg/mA for the Period 2021-2031
- Historical Data and Forecast of Indonesia Expanded Clay Market Revenues & Volume By 330-500 kg/mA for the Period 2021-2031
- Historical Data and Forecast of Indonesia Expanded Clay Market Revenues & Volume By Above 500 kg/mA for the Period 2021-2031
- Historical Data and Forecast of Indonesia Expanded Clay Market Revenues & Volume By Applications for the Period 2021-2031
- Historical Data and Forecast of Indonesia Expanded Clay Market Revenues & Volume By Residential Building for the Period 2021-2031
- Historical Data and Forecast of Indonesia Expanded Clay Market Revenues & Volume By Commercial Building for the Period 2021-2031
- Historical Data and Forecast of Indonesia Expanded Clay Market Revenues & Volume By Infrastructure for the Period 2021-2031
- Historical Data and Forecast of Indonesia Expanded Clay Market Revenues & Volume By Others for the Period 2021-2031
- Indonesia Expanded Clay Import Export Trade Statistics
- Market Opportunity Assessment By Types
- Market Opportunity Assessment By Applications
- Indonesia Expanded Clay Top Companies Market Share
- Indonesia Expanded Clay Competitive Benchmarking By Technical and Operational Parameters
- Indonesia Expanded Clay Company Profiles
- Indonesia Expanded Clay Key Strategic Recommendations
Frequently Asked Questions About the Market Study (FAQs):
6Wresearch actively monitors the Indonesia Expanded Clay Market and publishes its comprehensive annual report, highlighting emerging trends, growth drivers, revenue analysis, and forecast outlook. Our insights help businesses to make data-backed strategic decisions with ongoing market dynamics. Our analysts track relevent industries related to the Indonesia Expanded Clay Market, allowing our clients with actionable intelligence and reliable forecasts tailored to emerging regional needs.
Yes, we provide customisation as per your requirements. To learn more, feel free to contact us on sales@6wresearch.com
1 Executive Summary |
2 Introduction |
2.1 Key Highlights of the Report |
2.2 Report Description |
2.3 Market Scope & Segmentation |
2.4 Research Methodology |
2.5 Assumptions |
3 Indonesia Expanded Clay Market Overview |
3.1 Indonesia Country Macro Economic Indicators |
3.2 Indonesia Expanded Clay Market Revenues & Volume, 2021 & 2031F |
3.3 Indonesia Expanded Clay Market - Industry Life Cycle |
3.4 Indonesia Expanded Clay Market - Porter's Five Forces |
3.5 Indonesia Expanded Clay Market Revenues & Volume Share, By Types, 2021 & 2031F |
3.6 Indonesia Expanded Clay Market Revenues & Volume Share, By Applications, 2021 & 2031F |
4 Indonesia Expanded Clay Market Dynamics |
4.1 Impact Analysis |
4.2 Market Drivers |
4.2.1 Growing construction industry in Indonesia, leading to increased demand for expanded clay in infrastructure projects. |
4.2.2 Government initiatives promoting sustainable construction practices, where expanded clay is used as a lightweight aggregate for concrete. |
4.2.3 Increasing urbanization and population growth driving the need for affordable housing solutions, where expanded clay can be used for insulation and lightweight concrete applications. |
4.3 Market Restraints |
4.3.1 Fluctuating prices of raw materials used in the production of expanded clay, impacting the overall cost and profitability. |
4.3.2 Competition from alternative lightweight aggregates like pumice, perlite, and vermiculite, affecting market penetration. |
4.3.3 Environmental concerns related to the mining and processing of clay, leading to regulatory challenges and potential restrictions. |
5 Indonesia Expanded Clay Market Trends |
6 Indonesia Expanded Clay Market, By Types |
6.1 Indonesia Expanded Clay Market, By Types |
6.1.1 Overview and Analysis |
6.1.2 Indonesia Expanded Clay Market Revenues & Volume, By Types, 2021-2031F |
6.1.3 Indonesia Expanded Clay Market Revenues & Volume, By Up to 250 kg/mA, 2021-2031F |
6.1.4 Indonesia Expanded Clay Market Revenues & Volume, By 250-280 kg/mA, 2021-2031F |
6.1.5 Indonesia Expanded Clay Market Revenues & Volume, By 280-330 kg/mA, 2021-2031F |
6.1.6 Indonesia Expanded Clay Market Revenues & Volume, By 330-500 kg/mA, 2021-2031F |
6.1.7 Indonesia Expanded Clay Market Revenues & Volume, By Above 500 kg/mA, 2021-2031F |
6.2 Indonesia Expanded Clay Market, By Applications |
6.2.1 Overview and Analysis |
6.2.2 Indonesia Expanded Clay Market Revenues & Volume, By Residential Building, 2021-2031F |
6.2.3 Indonesia Expanded Clay Market Revenues & Volume, By Commercial Building, 2021-2031F |
6.2.4 Indonesia Expanded Clay Market Revenues & Volume, By Infrastructure, 2021-2031F |
6.2.5 Indonesia Expanded Clay Market Revenues & Volume, By Others, 2021-2031F |
7 Indonesia Expanded Clay Market Import-Export Trade Statistics |
7.1 Indonesia Expanded Clay Market Export to Major Countries |
7.2 Indonesia Expanded Clay Market Imports from Major Countries |
8 Indonesia Expanded Clay Market Key Performance Indicators |
8.1 Adoption rate of expanded clay in new construction projects. |
8.2 Number of infrastructure projects utilizing expanded clay as a sustainable building material. |
8.3 Average percentage increase in the use of expanded clay in construction projects year-on-year. |
9 Indonesia Expanded Clay Market - Opportunity Assessment |
9.1 Indonesia Expanded Clay Market Opportunity Assessment, By Types, 2021 & 2031F |
9.2 Indonesia Expanded Clay Market Opportunity Assessment, By Applications, 2021 & 2031F |
10 Indonesia Expanded Clay Market - Competitive Landscape |
10.1 Indonesia Expanded Clay Market Revenue Share, By Companies, 2024 |
10.2 Indonesia Expanded Clay Market Competitive Benchmarking, By Operating and Technical Parameters |
11 Company Profiles |
12 Recommendations |
13 Disclaimer |
Export potential assessment - trade Analytics for 2030
Export potential enables firms to identify high-growth global markets with greater confidence by combining advanced trade intelligence with a structured quantitative methodology. The framework analyzes emerging demand trends and country-level import patterns while integrating macroeconomic and trade datasets such as GDP and population forecasts, bilateral import–export flows, tariff structures, elasticity differentials between developed and developing economies, geographic distance, and import demand projections. Using weighted trade values from 2020–2024 as the base period to project country-to-country export potential for 2030, these inputs are operationalized through calculated drivers such as gravity model parameters, tariff impact factors, and projected GDP per-capita growth. Through an analysis of hidden potentials, demand hotspots, and market conditions that are most favorable to success, this method enables firms to focus on target countries, maximize returns, and global expansion with data, backed by accuracy.
By factoring in the projected importer demand gap that is currently unmet and could be potential opportunity, it identifies the potential for the Exporter (Country) among 190 countries, against the general trade analysis, which identifies the biggest importer or exporter.
To discover high-growth global markets and optimize your business strategy:
Click Here
Pricing
- Single User License$ 1,995
- Department License$ 2,400
- Site License$ 3,120
- Global License$ 3,795

Search
Thought Leadership and Analyst Meet


Our Clients
Related Reports
- India Switchgear Market Outlook (2026 - 2032) | Size, Share, Trends, Growth, Revenue, Forecast, Analysis, Value, Outlook
- Pakistan Contraceptive Implants Market (2025-2031) | Demand, Growth, Size, Share, Industry, Pricing Analysis, Competitive, Strategic Insights, Strategy, Consumer Insights, Analysis, Investment Trends, Opportunities, Revenue, Segments, Value, Segmentation, Supply, Forecast, Restraints, Outlook, Competition, Drivers, Trends, Companies, Challenges
- Sri Lanka Packaging Market (2026-2032) | Outlook, Competition, Drivers, Trends, Demand, Pricing Analysis, Competitive, Strategic Insights, Companies, Challenges, Strategy, Consumer Insights, Analysis, Investment Trends, Opportunities, Growth, Size, Share, Industry, Revenue, Segments, Value, Segmentation, Supply, Forecast, Restraints
- India Kids Watches Market (2026-2032) | Strategy, Consumer Insights, Analysis, Investment Trends, Opportunities, Growth, Size, Share, Industry, Revenue, Segments, Value, Segmentation, Supply, Forecast, Restraints, Outlook, Competition, Drivers, Trends, Demand, Pricing Analysis, Competitive, Strategic Insights, Companies, Challenges
- Saudi Arabia Core Assurance Service Market (2025-2031) | Strategy, Consumer Insights, Analysis, Investment Trends, Opportunities, Growth, Size, Share, Industry, Revenue, Segments, Value, Segmentation, Supply, Forecast, Restraints, Outlook, Competition, Drivers, Trends, Demand, Pricing Analysis, Competitive, Strategic Insights, Companies, Challenges
- Romania Uninterruptible Power Supply (UPS) Market (2026-2032) | Industry, Analysis, Revenue, Size, Forecast, Outlook, Value, Trends, Share, Growth & Companies
- Saudi Arabia Car Window Tinting Film, Paint Protection Film (PPF), and Ceramic Coating Market (2025-2031) | Strategy, Consumer Insights, Analysis, Investment Trends, Opportunities, Growth, Size, Share, Industry, Revenue, Segments, Value, Segmentation, Supply, Forecast, Restraints, Outlook, Competition, Drivers, Trends, Demand, Pricing Analysis, Competitive, Strategic Insights, Companies, Challenges
- South Africa Stationery Market (2025-2031) | Share, Size, Industry, Value, Growth, Revenue, Analysis, Trends, Segmentation & Outlook
- Afghanistan Rocking Chairs And Adirondack Chairs Market (2026-2032) | Size & Revenue, Competitive Landscape, Share, Segmentation, Industry, Value, Outlook, Analysis, Trends, Growth, Forecast, Companies
- Afghanistan Apparel Market (2026-2032) | Growth, Outlook, Industry, Segmentation, Forecast, Size, Companies, Trends, Value, Share, Analysis & Revenue
Industry Events and Analyst Meet

EV tech India Expo 2026

Auto Tech Asia 2026

Battery Tech India 2026

Smart Production Solutions Guangzhou 2026

Stationery & Paper Expo Saudi Arabia 2026
Whitepaper
- Middle East & Africa Commercial Security Market Click here to view more.
- Middle East & Africa Fire Safety Systems & Equipment Market Click here to view more.
- GCC Drone Market Click here to view more.
- Middle East Lighting Fixture Market Click here to view more.
- GCC Physical & Perimeter Security Market Click here to view more.
6WResearch In News
- Doha a strategic location for EV manufacturing hub: IPA Qatar
- Demand for luxury TVs surging in the GCC, says Samsung
- Empowering Growth: The Thriving Journey of Bangladesh’s Cable Industry
- Demand for luxury TVs surging in the GCC, says Samsung
- Video call with a traditional healer? Once unthinkable, it’s now common in South Africa
- Intelligent Buildings To Smooth GCC’s Path To Net Zero