Indonesia Iron Oxides and Hydroxides Market (2026-2032) Outlook | Share, Forecast, Analysis, Companies, Revenue, Industry, Value, Size, Growth & Trends
Market Forecast By Color (Black, Brown, Red, Yellow, Others), By End Use Industries (Construction, Paper, Plastics, Paints and coatings, Automobiles), By Type (Natural, Synthetic), By Applications (Cosmetic, Healthcare, Pharmaceutical, Manufacturing, Mining and mineral processing) And Competitive Landscape
| Product Code: ETC197020 | Publication Date: Jul 2023 | Updated Date: Jun 2026 | Product Type: Market Research Report | |
| Publisher: 6Wresearch | Author: Ravi Bhandari | No. of Pages: 60 | No. of Figures: 40 | No. of Tables: 7 |
Indonesia Iron Oxides and Hydroxides Market Size, Share & Growth Rate
The Indonesia Iron Oxides and Hydroxides Market was estimated at USD 393 Million in 2025 and is projected to reach USD 522 Million by 2032, growing at a CAGR of 4.1% from 2026 to 2032. This growth trajectory can be attributed to the increasing industrialization in the Asia Pacific region, particularly within Indonesia, and the heightened demand from key sectors, notably paints and coatings. Additionally, the availability of abundant natural resources such as bauxite ore and limestone is bolstering production capacity, positioning Indonesia as a vital player in the global market.
Indonesia Iron Oxides and Hydroxides Market Growth Rate Analysis (2021-2032)
In the Indonesia Iron Oxides and Hydroxides market, growth has shown a promising upward trajectory, notably recovering from a slight decline of 0.5% in 2021. Strong demand from the construction and coatings sectors contributed to a remarkable 4.8% increase in 2022, accelerating further to 5.8% in 2023. This upward momentum is projected to continue, with growth rates averaging around 5.5% through 2032. Key drivers include increasing infrastructure investments and a global shift towards sustainable practices, spurring consumer demand for eco-friendly materials. Technological advancements in production methods are also enhancing supply capabilities, positioning Indonesia as a competitive player in the regional market for iron oxides and hydroxides.
Indonesia Iron Oxides and Hydroxides Market Year-wise Growth Rate and Key Drivers
This graph highlights how the Indonesia Iron Oxides and Hydroxides Market has steadily grown over the past five years, supported by major growth factors.
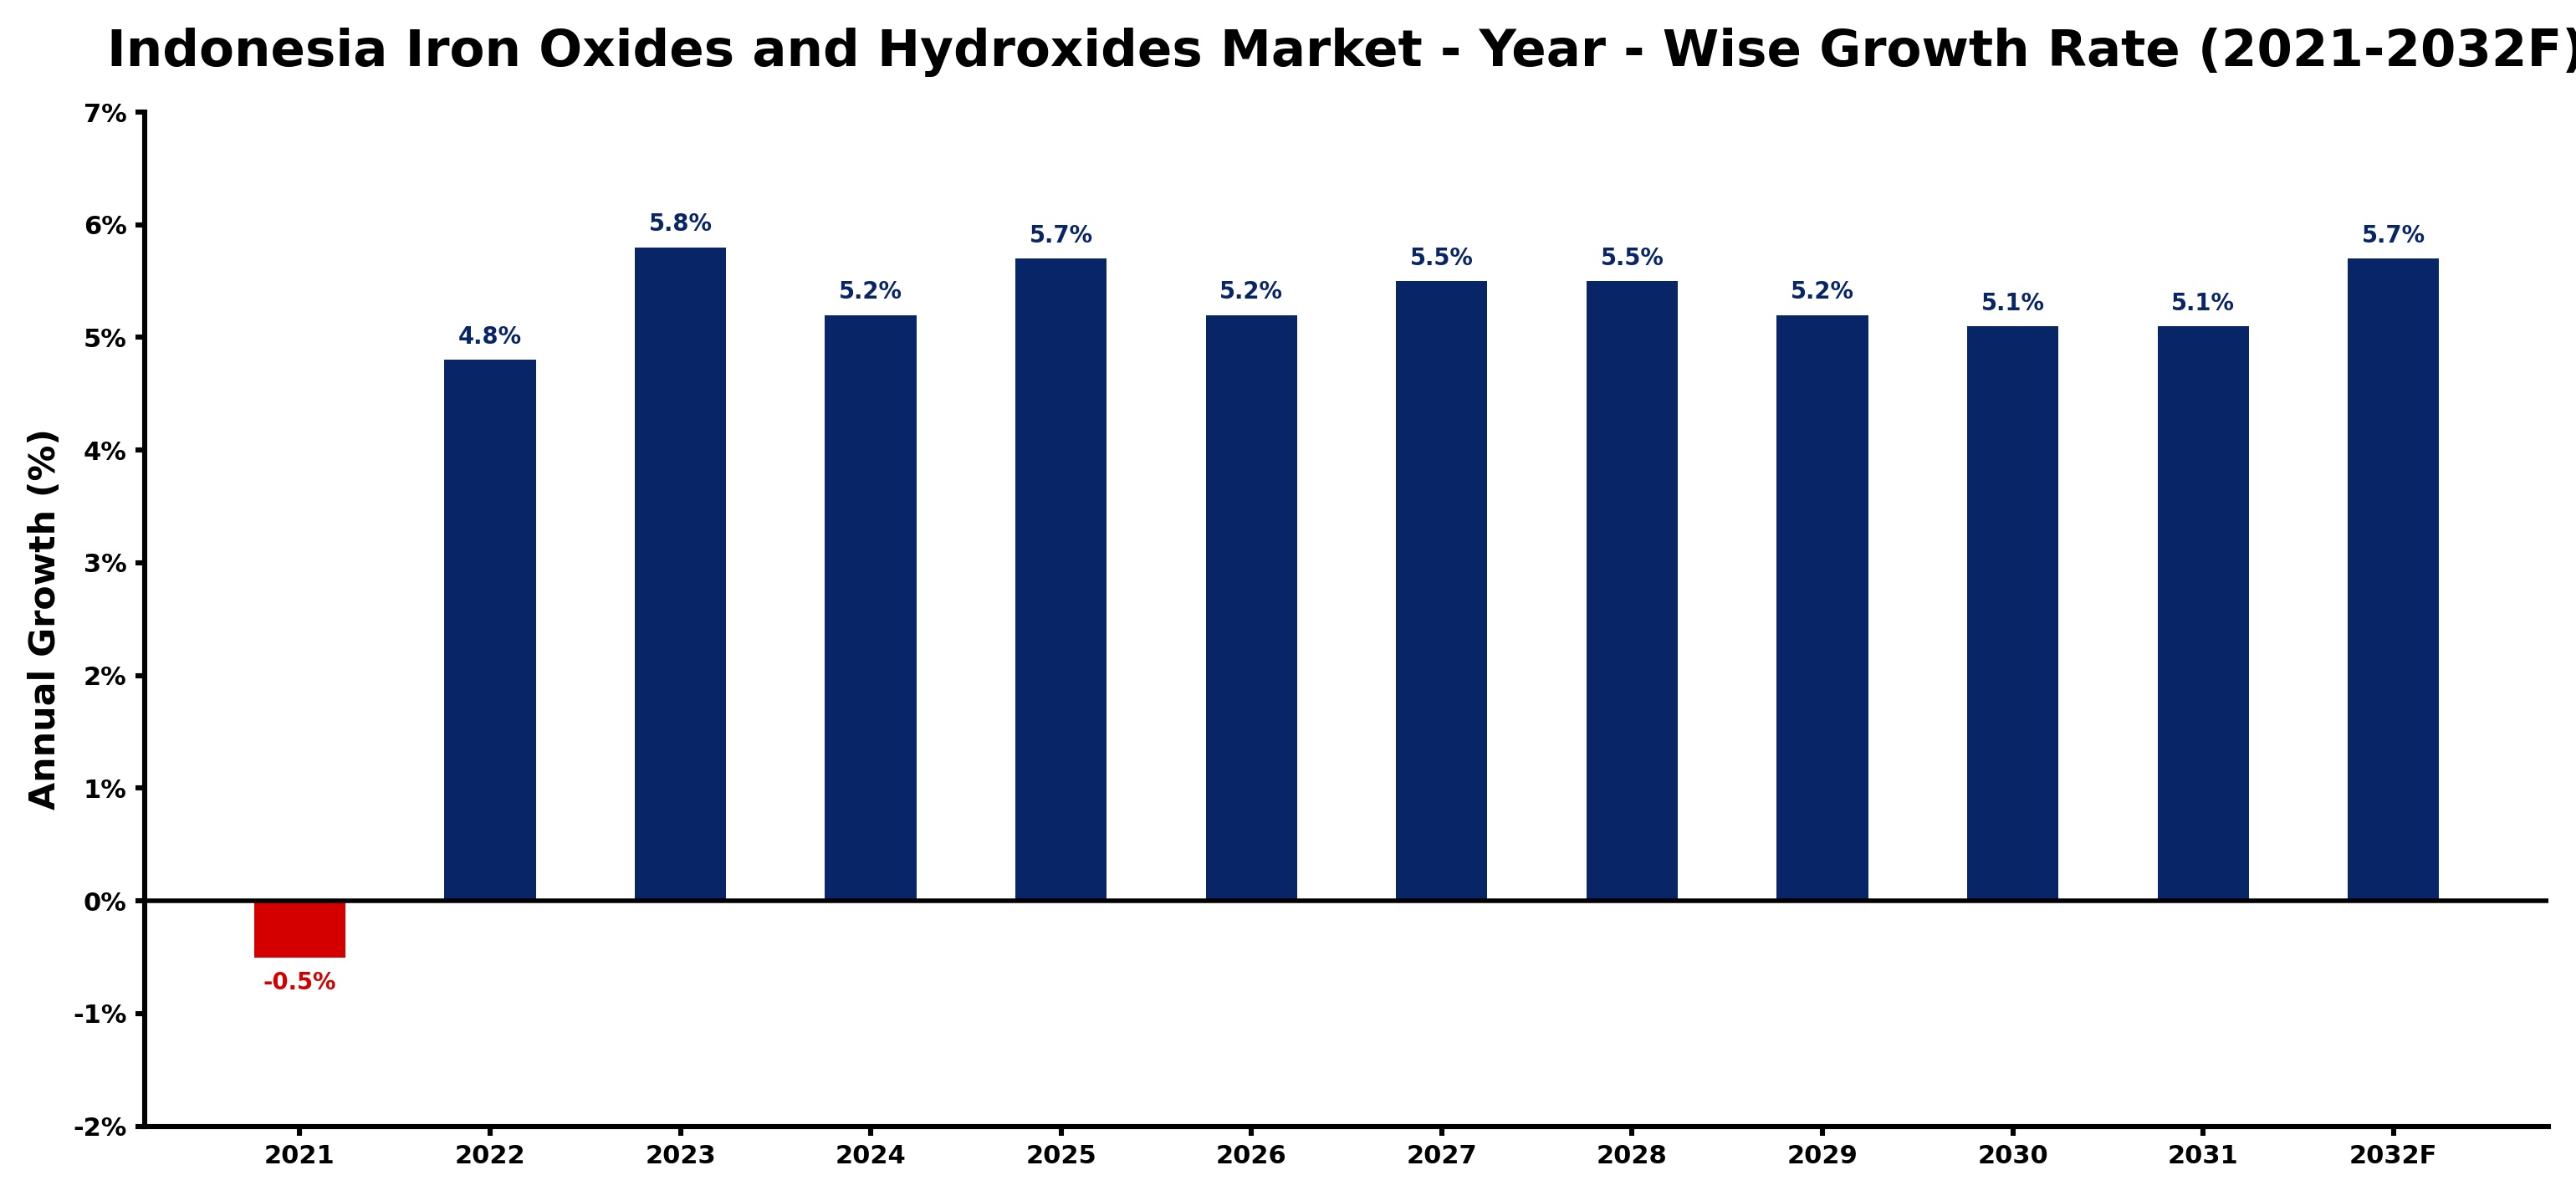
The table below presents the year‑wise growth rates along with the key drivers influencing the market
| Year | Growth Rate | Major Drivers |
| 2021 | -0.5% | Supply chain disruptions affected production |
| 2022 | 4.8% | Construction sector recovery stimulated demand |
| 2023 | 5.8% | Automotive industry growth increased usage |
| 2024 | 5.2% | Infrastructure projects drove higher consumption |
| 2025 | 5.7% | Paint and coatings market expanded |
| 2026 | 5.2% | Renewable energy projects increased demand |
| 2027 | 5.5% | Consumer goods sector showed resilience |
| 2028 | 5.5% | Technological advancements enhanced applications |
| 2029 | 5.2% | Export opportunities opened new markets |
| 2030 | 5.1% | Sustainability trends influenced purchasing decisions |
| 2031 | 5.1% | Industrial applications diversified product usage |
| 2032 | 5.7% | Research and development fostered innovation |
Note - Market size estimations and growth projections presented in this report are based on 6Wresearch’s advanced forecasting approach, validated with industry datasets as of June 2026.
Indonesia Iron Oxides and Hydroxides Market Synopsis
Indonesia stands out as the world's largest producer of iron oxides and hydroxides, leveraging its rich mineral deposits to fulfill both domestic and international demand. The country's strong industrial base sees extensive usage of these products across various applications, primarily in paints, coatings, and construction materials.
The paints and coatings sector is a significant driver, employing iron oxide and hydroxide pigments for their color retention and durability. Furthermore, with ongoing investments in infrastructure and a surge in construction activities, the demand for high-quality iron oxides is set to rise, ensuring a robust market outlook.
Indonesia Iron Oxides and Hydroxides Market Key Takeaways
- The market is driven by increasing industrialization and demand from key end-user industries.
- Iron oxide and hydroxide products are crucial for color retention in the paints and coatings sector.
- Abundant natural resources in Indonesia facilitate competitive production costs.
- Investment opportunities are growing as local players seek to enhance their operational efficiencies.
- Research activities are focused on developing high-purity grade ores to improve pigment quality.
Evaluation of Restraints in Indonesia Iron Oxides and Hydroxides Market
While the market presents numerous growth opportunities, it also faces notable restraints. High production costs are a significant barrier, compounded by the need for technological advancements in manufacturing processes. Additionally, the industry is subject to stringent environmental regulations, which can restrict operational flexibility. Fluctuating raw material prices further complicate the landscape, making it challenging for producers to maintain competitive pricing without sacrificing margins.
Indonesia Iron Oxides and Hydroxides Market Trends
Several trends are shaping the Indonesia Iron Oxides and Hydroxides Market. The increasing focus on sustainable and eco-friendly pigments is driving research into high-purity grade ores, which promise improved quality and performance. Moreover, the rise of titanium dioxide substitutes, such as synthetic ferric oxide and various forms of iron ore, is being embraced due to their superior opacity and vibrant hues. The competitive landscape is also evolving as companies innovate to expand product portfolios, catering to a growing and diverse range of applications.
Indonesia Iron Oxides and Hydroxides Market Opportunities
The Indonesian market is ripe with opportunities for growth and investment. With the ongoing expansion of industrial infrastructure, particularly in the Southeast Asian region, firms can capitalize on the increasing demand for iron oxide and hydroxide products. Furthermore, local players are well-positioned to leverage the country's rich mineral resources, enhancing their manufacturing capabilities while exploring export potential. Investments in R&D can also unlock new formulations, thereby appealing to evolving consumer preferences in the paints and coatings segment.
Government Initiatives in the Indonesia Iron Oxides and Hydroxides Market
The Indonesian government has been proactive in supporting the iron oxides and hydroxides sector through various policy initiatives aimed at bolstering industrial growth. Programs designed to enhance infrastructure, coupled with incentives for sustainable practices in mineral extraction, are fostering an environment conducive to investment. Additionally, policies encouraging foreign direct investment aim to modernize the industry and improve operational efficiencies, further enabling local producers to tap into regional and global markets.
Future Insights of the Indonesia Iron Oxides and Hydroxides Market
Looking ahead to the period from 2026 to 2032, the Indonesia Iron Oxides and Hydroxides Market is expected to flourish, driven by continued industrialization and a burgeoning construction sector. As companies strive for technological advancements and sustainable practices, the market will likely witness increased innovation in pigment production. With strong governmental support and a favorable investment climate, Indonesia is poised to solidify its status as a leading supplier in the global iron oxides and hydroxides landscape.
Indonesia Iron Oxides and Hydroxides Market Latest Developments (May 2025 - June 2026)
Recent developments in the Indonesia Iron Oxides and Hydroxides Market showcase a shift towards greater sustainability and innovation. Companies are increasingly investing in R&D to enhance product formulations, focusing on environmentally friendly processes and materials. Additionally, collaborative ventures among local manufacturers aim to enhance operational efficiency and expand market reach. The heightened emphasis on quality and performance in pigment production reflects a broader trend of meeting rising global standards and consumer expectations.
Indonesia Iron Oxides and Hydroxides Market - Key Attractiveness of the Report
- 10 Years of Market Numbers
- Historical Data Starting from 2022 to 2025
- Base Year: 2025
- Forecast Data until 2032
- Key Performance Indicators Impacting the Market
- Major Upcoming Developments and Projects
Key Highlights of the Report:
- Indonesia Iron Oxides and Hydroxides Market Outlook
- Market Size of Indonesia Iron Oxides and Hydroxides Market, 2025
- Forecast of Indonesia Iron Oxides and Hydroxides Market, 2032
- Historical Data and Forecast of Indonesia Iron Oxides and Hydroxides Revenues & Volume for the Period 2022-2032F
- Indonesia Iron Oxides and Hydroxides Market Trend Evolution
- Indonesia Iron Oxides and Hydroxides Market Drivers and Challenges
- Indonesia Iron Oxides and Hydroxides Price Trends
- Indonesia Iron Oxides and Hydroxides Porter's Five Forces
- Indonesia Iron Oxides and Hydroxides Industry Life Cycle
- Historical Data and Forecast of Indonesia Iron Oxides and Hydroxides Market Revenues & Volume By Color for the Period 2022-2032F
- Historical Data and Forecast of Indonesia Iron Oxides and Hydroxides Market Revenues & Volume By Black for the Period 2022-2032F
- Historical Data and Forecast of Indonesia Iron Oxides and Hydroxides Market Revenues & Volume By Brown for the Period 2022-2032F
- Historical Data and Forecast of Indonesia Iron Oxides and Hydroxides Market Revenues & Volume By Red for the Period 2022-2032F
- Historical Data and Forecast of Indonesia Iron Oxides and Hydroxides Market Revenues & Volume By Yellow for the Period 2022-2032F
- Historical Data and Forecast of Indonesia Iron Oxides and Hydroxides Market Revenues & Volume By Others for the Period 2022-2032F
- Historical Data and Forecast of Indonesia Iron Oxides and Hydroxides Market Revenues & Volume By End Use Industries for the Period 2022-2032F
- Historical Data and Forecast of Indonesia Iron Oxides and Hydroxides Market Revenues & Volume By Construction for the Period 2022-2032F
- Historical Data and Forecast of Indonesia Iron Oxides and Hydroxides Market Revenues & Volume By Paper for the Period 2022-2032F
- Historical Data and Forecast of Indonesia Iron Oxides and Hydroxides Market Revenues & Volume By Plastics for the Period 2022-2032F
- Historical Data and Forecast of Indonesia Iron Oxides and Hydroxides Market Revenues & Volume By Paints and coatings for the Period 2022-2032F
- Historical Data and Forecast of Indonesia Iron Oxides and Hydroxides Market Revenues & Volume By Automobiles for the Period 2022-2032F
- Historical Data and Forecast of Indonesia Iron Oxides and Hydroxides Market Revenues & Volume By Type for the Period 2022-2032F
- Historical Data and Forecast of Indonesia Iron Oxides and Hydroxides Market Revenues & Volume By Natural for the Period 2022-2032F
- Historical Data and Forecast of Indonesia Iron Oxides and Hydroxides Market Revenues & Volume By Synthetic for the Period 2022-2032F
- Historical Data and Forecast of Indonesia Iron Oxides and Hydroxides Market Revenues & Volume By Applications for the Period 2022-2032F
- Historical Data and Forecast of Indonesia Iron Oxides and Hydroxides Market Revenues & Volume By Cosmetic for the Period 2022-2032F
- Historical Data and Forecast of Indonesia Iron Oxides and Hydroxides Market Revenues & Volume By Healthcare for the Period 2022-2032F
- Historical Data and Forecast of Indonesia Iron Oxides and Hydroxides Market Revenues & Volume By Pharmaceutical for the Period 2022-2032F
- Historical Data and Forecast of Indonesia Iron Oxides and Hydroxides Market Revenues & Volume By Manufacturing for the Period 2022-2032F
- Historical Data and Forecast of Indonesia Iron Oxides and Hydroxides Market Revenues & Volume By Mining and mineral processing for the Period 2022-2032F
- Indonesia Iron Oxides and Hydroxides Import Export Trade Statistics
- Market Opportunity Assessment By Color
- Market Opportunity Assessment By End Use Industries
- Market Opportunity Assessment By Type
- Market Opportunity Assessment By Applications
- Indonesia Iron Oxides and Hydroxides Top Companies Market Share
- Indonesia Iron Oxides and Hydroxides Competitive Benchmarking By Technical and Operational Parameters
- Indonesia Iron Oxides and Hydroxides Company Profiles
- Indonesia Iron Oxides and Hydroxides Key Strategic Recommendations
Indonesia Iron Oxides and Hydroxides Market - Frequently Asked Questions
The market was estimated at USD 393 Million in 2025 and is projected to reach USD 522 Million by 2032, growing at a CAGR of 4.1% from 2026 to 2032.
The paints and coatings industry is a major end-user of iron oxide and hydroxide products, utilizing these pigments for their durability and color retention properties.
Indonesia's abundant natural resources, such as bauxite ore and limestone, significantly enhance production capabilities and contribute to competitive pricing in the global market.
Government initiatives aimed at improving infrastructure and providing incentives for sustainable practices are fostering an environment conducive to investment and growth in this sector.
Current trends include a focus on sustainable pigment production, an increase in the use of titanium dioxide substitutes, and an ongoing push for innovation in product formulations.
6Wresearch actively monitors the Indonesia Iron Oxides and Hydroxides Market and publishes its comprehensive annual report, highlighting emerging trends, growth drivers, revenue analysis, and forecast outlook. Our insights help businesses to make data-backed strategic decisions with ongoing market dynamics. Our analysts track relevent industries related to the Indonesia Iron Oxides and Hydroxides Market, allowing our clients with actionable intelligence and reliable forecasts tailored to emerging regional needs.
Yes, we provide customisation as per your requirements. To learn more, feel free to contact us on sales@6wresearch.com
1 Executive Summary |
2 Introduction |
2.1 Key Highlights of the Report |
2.2 Report Description |
2.3 Market Scope & Segmentation |
2.4 Research Methodology |
2.5 Assumptions |
3 Indonesia Iron Oxides and Hydroxides Market Overview |
3.1 Indonesia Country Macro Economic Indicators |
3.2 Indonesia Iron Oxides and Hydroxides Market Revenues & Volume, 2022 & 2032F |
3.3 Indonesia Iron Oxides and Hydroxides Market - Industry Life Cycle |
3.4 Indonesia Iron Oxides and Hydroxides Market - Porter's Five Forces |
3.5 Indonesia Iron Oxides and Hydroxides Market Revenues & Volume Share, By Color, 2022 & 2032F |
3.6 Indonesia Iron Oxides and Hydroxides Market Revenues & Volume Share, By End Use Industries, 2022 & 2032F |
3.7 Indonesia Iron Oxides and Hydroxides Market Revenues & Volume Share, By Type, 2022 & 2032F |
3.8 Indonesia Iron Oxides and Hydroxides Market Revenues & Volume Share, By Applications, 2022 & 2032F |
4 Indonesia Iron Oxides and Hydroxides Market Dynamics |
4.1 Impact Analysis |
4.2 Market Drivers |
4.2.1 Increasing demand from various end-user industries such as construction, automotive, and electronics. |
4.2.2 Growth in infrastructure development projects in Indonesia. |
4.2.3 Rise in investments in the mining sector leading to higher production of iron oxides and hydroxides. |
4.3 Market Restraints |
4.3.1 Volatility in raw material prices impacting production costs. |
4.3.2 Stringent environmental regulations affecting mining and production processes. |
4.3.3 Competition from alternative materials impacting market growth. |
5 Indonesia Iron Oxides and Hydroxides Market Trends |
6 Indonesia Iron Oxides and Hydroxides Market, By Types |
6.1 Indonesia Iron Oxides and Hydroxides Market, By Color |
6.1.1 Overview and Analysis |
6.1.2 Indonesia Iron Oxides and Hydroxides Market Revenues & Volume, By Color, 2022-2032F |
6.1.3 Indonesia Iron Oxides and Hydroxides Market Revenues & Volume, By Black, 2022-2032F |
6.1.4 Indonesia Iron Oxides and Hydroxides Market Revenues & Volume, By Brown, 2022-2032F |
6.1.5 Indonesia Iron Oxides and Hydroxides Market Revenues & Volume, By Red, 2022-2032F |
6.1.6 Indonesia Iron Oxides and Hydroxides Market Revenues & Volume, By Yellow, 2022-2032F |
6.1.7 Indonesia Iron Oxides and Hydroxides Market Revenues & Volume, By Others, 2022-2032F |
6.2 Indonesia Iron Oxides and Hydroxides Market, By End Use Industries |
6.2.1 Overview and Analysis |
6.2.2 Indonesia Iron Oxides and Hydroxides Market Revenues & Volume, By Construction, 2022-2032F |
6.2.3 Indonesia Iron Oxides and Hydroxides Market Revenues & Volume, By Paper, 2022-2032F |
6.2.4 Indonesia Iron Oxides and Hydroxides Market Revenues & Volume, By Plastics, 2022-2032F |
6.2.5 Indonesia Iron Oxides and Hydroxides Market Revenues & Volume, By Paints and coatings, 2022-2032F |
6.2.6 Indonesia Iron Oxides and Hydroxides Market Revenues & Volume, By Automobiles, 2022-2032F |
6.3 Indonesia Iron Oxides and Hydroxides Market, By Type |
6.3.1 Overview and Analysis |
6.3.2 Indonesia Iron Oxides and Hydroxides Market Revenues & Volume, By Natural, 2022-2032F |
6.3.3 Indonesia Iron Oxides and Hydroxides Market Revenues & Volume, By Synthetic, 2022-2032F |
6.4 Indonesia Iron Oxides and Hydroxides Market, By Applications |
6.4.1 Overview and Analysis |
6.4.2 Indonesia Iron Oxides and Hydroxides Market Revenues & Volume, By Cosmetic, 2022-2032F |
6.4.3 Indonesia Iron Oxides and Hydroxides Market Revenues & Volume, By Healthcare, 2022-2032F |
6.4.4 Indonesia Iron Oxides and Hydroxides Market Revenues & Volume, By Pharmaceutical, 2022-2032F |
6.4.5 Indonesia Iron Oxides and Hydroxides Market Revenues & Volume, By Manufacturing, 2022-2032F |
6.4.6 Indonesia Iron Oxides and Hydroxides Market Revenues & Volume, By Mining and mineral processing, 2022-2032F |
7 Indonesia Iron Oxides and Hydroxides Market Import-Export Trade Statistics |
7.1 Indonesia Iron Oxides and Hydroxides Market Export to Major Countries |
7.2 Indonesia Iron Oxides and Hydroxides Market Imports from Major Countries |
8 Indonesia Iron Oxides and Hydroxides Market Key Performance Indicators |
8.1 Average selling price of iron oxides and hydroxides in Indonesia. |
8.2 Production capacity utilization rate of iron oxide and hydroxide manufacturers. |
8.3 Percentage of iron oxide and hydroxide products meeting quality standards. |
9 Indonesia Iron Oxides and Hydroxides Market - Opportunity Assessment |
9.1 Indonesia Iron Oxides and Hydroxides Market Opportunity Assessment, By Color, 2022 & 2032F |
9.2 Indonesia Iron Oxides and Hydroxides Market Opportunity Assessment, By End Use Industries, 2022 & 2032F |
9.3 Indonesia Iron Oxides and Hydroxides Market Opportunity Assessment, By Type, 2022 & 2032F |
9.4 Indonesia Iron Oxides and Hydroxides Market Opportunity Assessment, By Applications, 2022 & 2032F |
10 Indonesia Iron Oxides and Hydroxides Market - Competitive Landscape |
10.1 Indonesia Iron Oxides and Hydroxides Market Revenue Share, By Companies, 2025 |
10.2 Indonesia Iron Oxides and Hydroxides Market Competitive Benchmarking, By Operating and Technical Parameters |
11 Company Profiles |
12 Recommendations |
13 Disclaimer |
Global Go To Market Strategy - 2030
Export potential enables firms to identify high-growth global markets with greater confidence by combining advanced trade intelligence with a structured quantitative methodology. The framework analyzes emerging demand trends and country-level import patterns while integrating macroeconomic and trade datasets such as GDP and population forecasts, bilateral import–export flows, tariff structures, elasticity differentials between developed and developing economies, geographic distance, and import demand projections. Using weighted trade values from 2020–2024 as the base period to project country-to-country export potential for 2030, these inputs are operationalized through calculated drivers such as gravity model parameters, tariff impact factors, and projected GDP per-capita growth. Through an analysis of hidden potentials, demand hotspots, and market conditions that are most favorable to success, this method enables firms to focus on target countries, maximize returns, and global expansion with data, backed by accuracy.
By factoring in the projected importer demand gap that is currently unmet and could be potential opportunity, it identifies the potential for the Exporter (Country) among 190 countries, against the general trade analysis, which identifies the biggest importer or exporter.
To discover high-growth global markets and optimize your business strategy:
Click Here
Pricing
- Single User License$ 1,995
- Department License$ 2,400
- Site License$ 3,120
- Global License$ 3,795

Leadership Perspectives from Industry Events
Search
Thought Leadership and Analyst Meet


Our Clients
6WResearch In News
- India Air Conditioner Market Set for Strong Rebound in 2026 After Weather-Led Correction and GST-Driven Recovery: 6Wresearch
- ADAS in India: How Automatic Emergency Braking, Blind Spot Detection & Driver Monitoring are Transforming Road Safety
- Doha a strategic location for EV manufacturing hub: IPA Qatar
- Demand for luxury TVs surging in the GCC, says Samsung
- Empowering Growth: The Thriving Journey of Bangladesh’s Cable Industry
- Demand for luxury TVs surging in the GCC, says Samsung
Latest Reports
- Poland Fire Protection Systems Market (2026-2032)
- Cape Verde Portable Hand-Thrown Extinguisher Market (2026-2032)
- Canada Portable Hand-Thrown Extinguisher Market (2026-2032)
- Cameroon Portable Hand-Thrown Extinguisher Market (2026-2032)
- Burundi Portable Hand-Thrown Extinguisher Market (2026-2032)
- Burkina Faso Portable Hand-Thrown Extinguisher Market (2026-2032)
- Bulgaria Portable Hand-Thrown Extinguisher Market (2026-2032)
- Brunei Portable Hand-Thrown Extinguisher Market (2026-2032)
- Botswana Portable Hand-Thrown Extinguisher Market (2026-2032)
- Bosnia and Herzegovina Portable Hand-Thrown Extinguisher Market (2026-2032)
Industry Events and Analyst Meet

HIMTEX 2026

India Refining Summit 2026

India EV Show 2026

EV tech India Expo 2026

Auto Tech Asia 2026
Whitepaper
- Middle East & Africa Commercial Security Market Click here to view more.
- Middle East & Africa Fire Safety Systems & Equipment Market Click here to view more.
- GCC Drone Market Click here to view more.
- Middle East Lighting Fixture Market Click here to view more.
- GCC Physical & Perimeter Security Market Click here to view more.