Indonesia Lace Market (2026-2032) Outlook | Industry, Companies, Size, Share, Forecast, Analysis, Value, Trends, Revenue & Growth
Market Forecast By Type (Cotton Thread, Flax, Silk Thread, Synthetic Fiber, Fine Copper, Silver Line), By Application (Clothes, Shoes, Accessories, Soft Furniture, Other) And Competitive Landscape
| Product Code: ETC086387 | Publication Date: Jul 2023 | Updated Date: Feb 2026 | Product Type: Report | |
| Publisher: 6Wresearch | Author: Ravi Bhandari | No. of Pages: 70 | No. of Figures: 35 | No. of Tables: 5 |
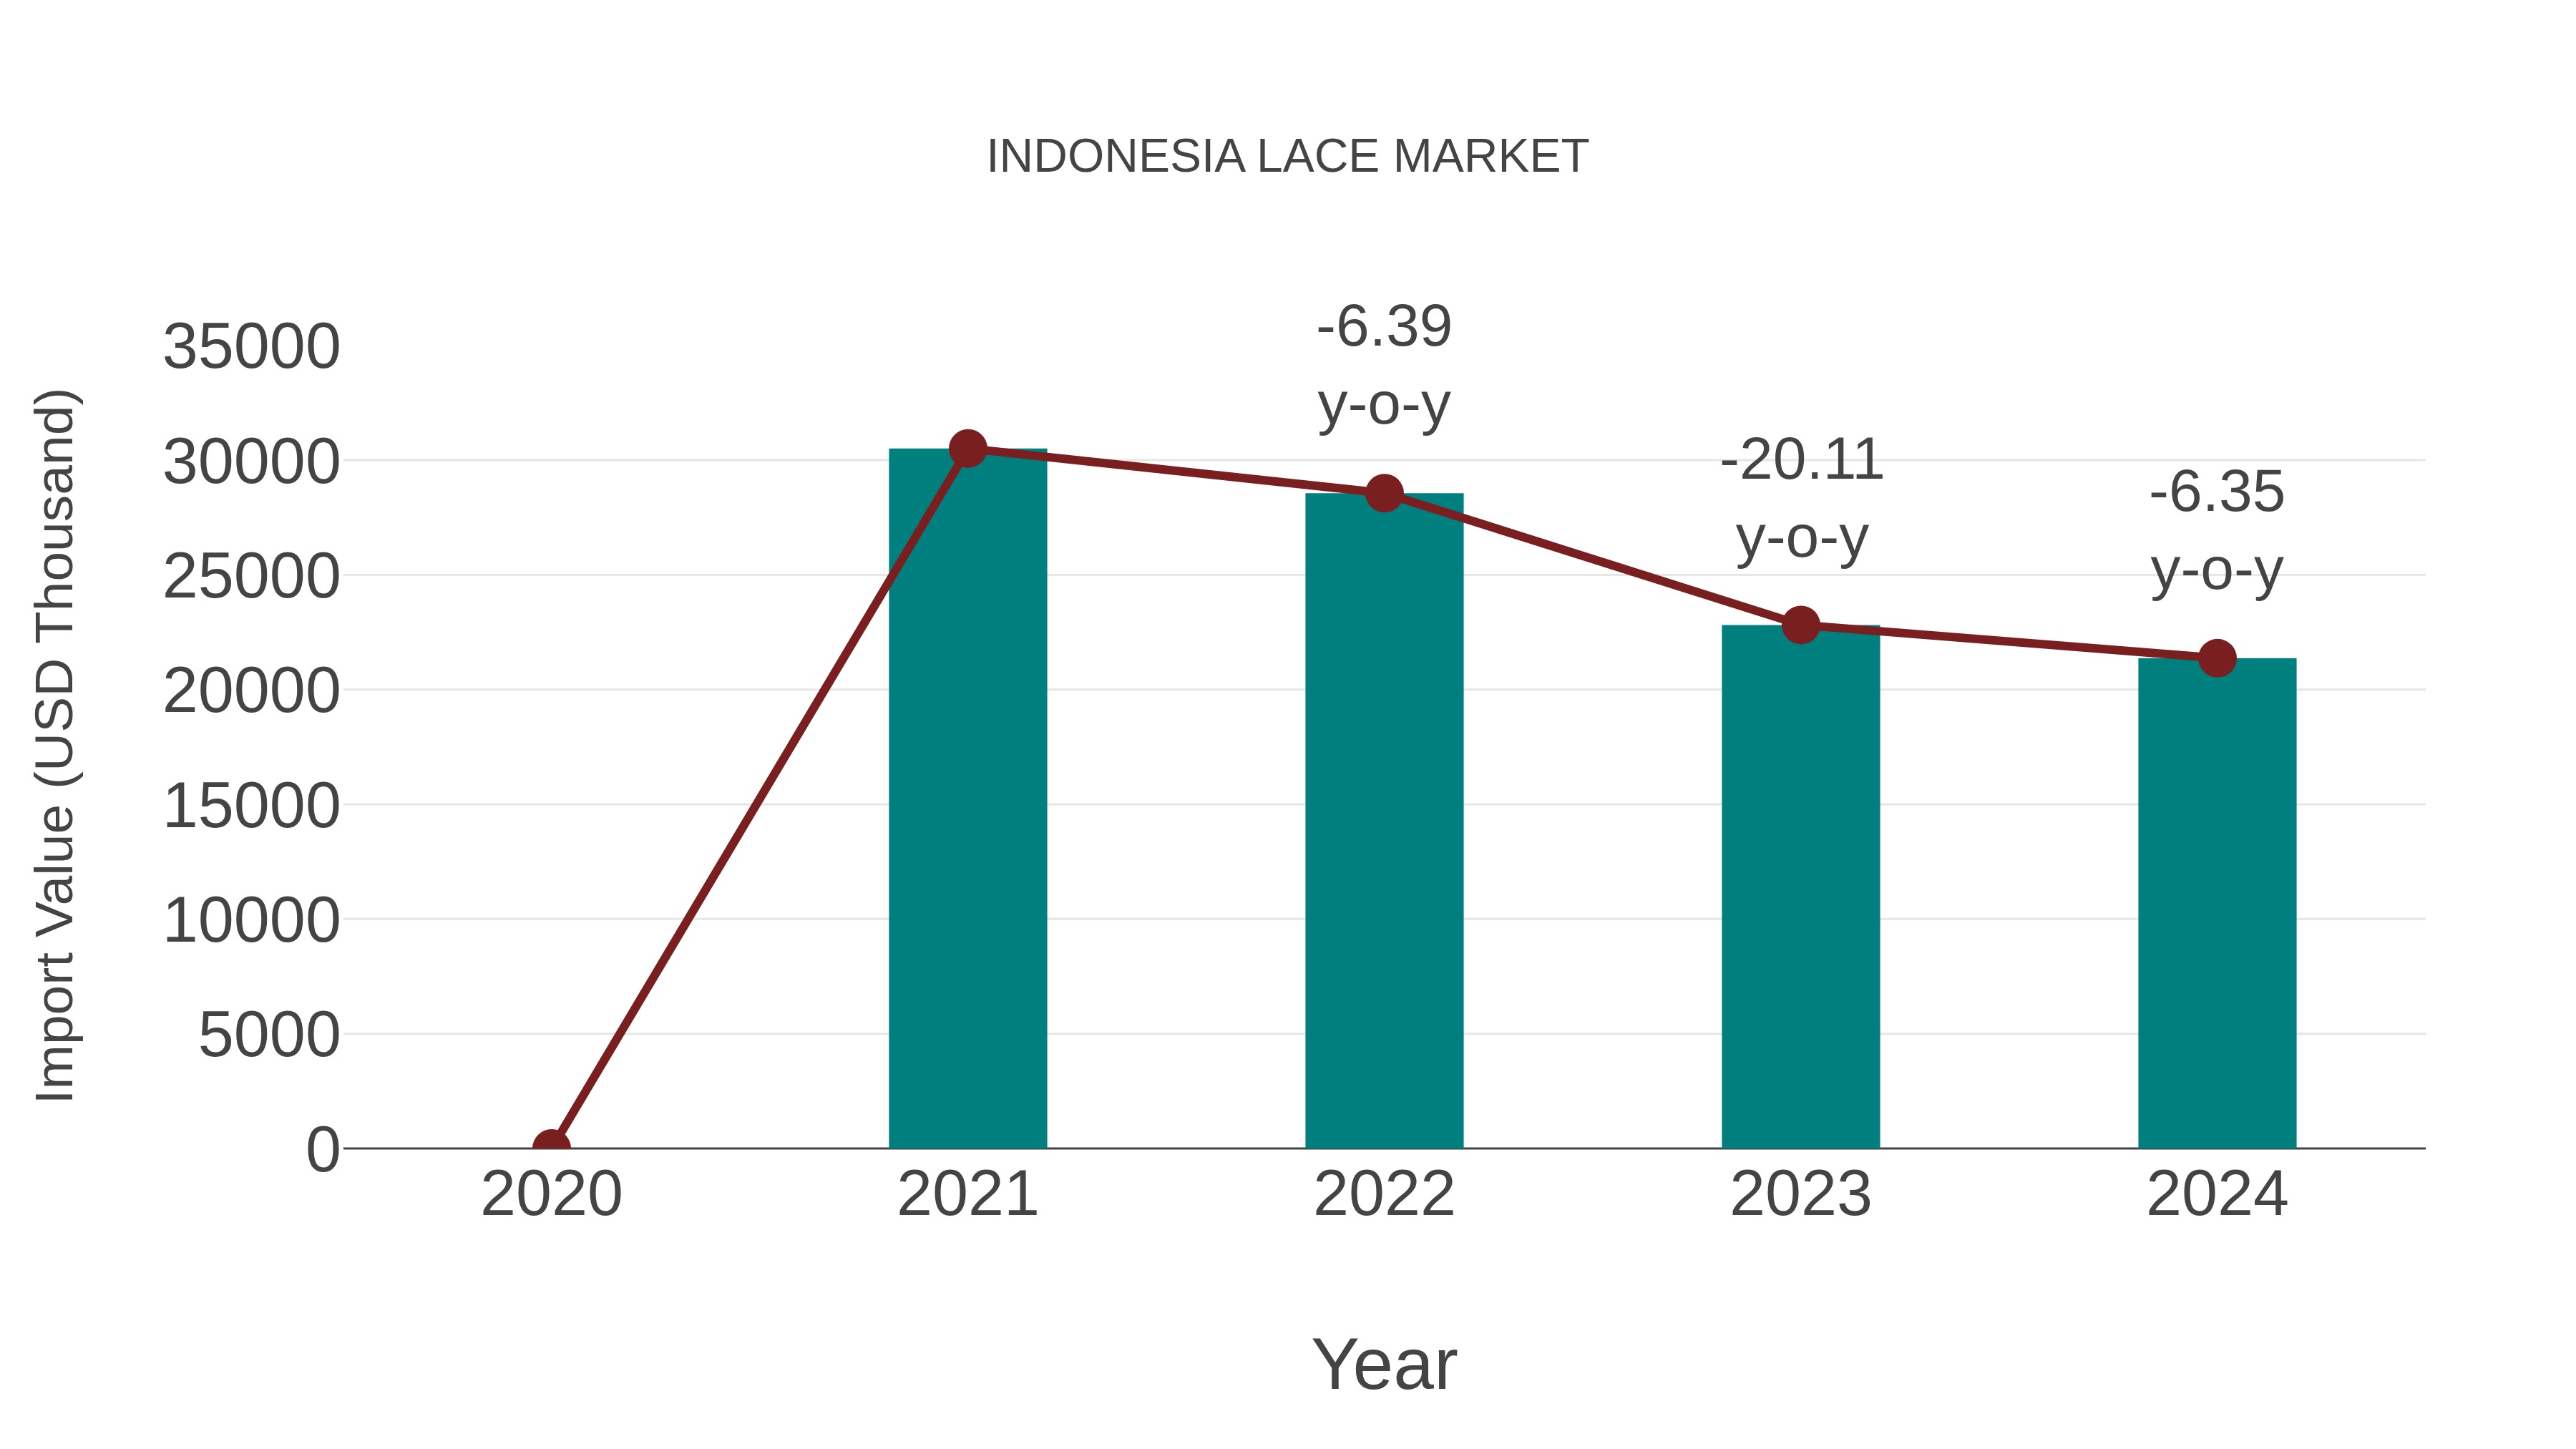
Indonesia Lace Market: Import Trend Analysis
Indonesia`s import trend in the lace market experienced a decline from 2023-2024, with a growth rate of -6.35%. The compound annual growth rate (CAGR) for 2020-2024 stood at -11.19%. This downturn can be attributed to shifting consumer preferences or changes in global trade dynamics impacting the market stability.
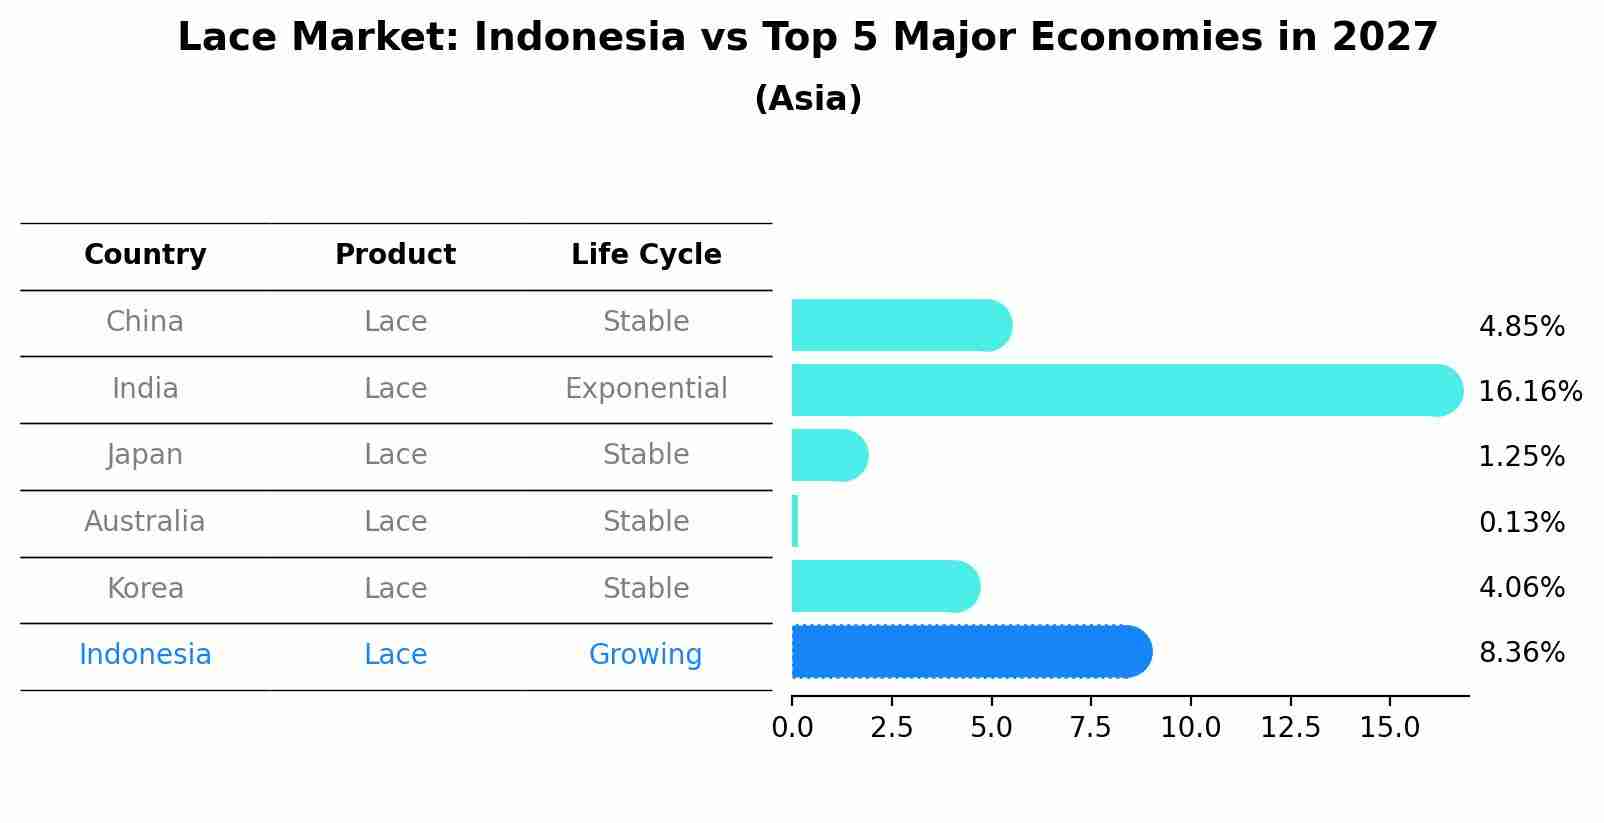
Lace Market: Indonesia vs Top 5 Major Economies in 2027 (Asia)
In the Asia region, the Lace market in Indonesia is projected to expand at a growing growth rate of 8.36% by 2027. The largest economy is China, followed by India, Japan, Australia and South Korea.
Indonesia Lace MarketSynopsis
Indonesia has a vibrant lace market, which is one of the most important textile markets in Asia. The country?s lace industry is largely export-oriented and produces high quality products that are used extensively in apparel production both domestically and abroad. Indonesia lace manufacturing sector employs thousands of people directly and supports many more indirectly through its supply chain activities.
Market Trends
The overall trend in the Indonesia lace market is positive due to increasing demand from domestic as well as international buyers for their products. Indonesia exports of lacework have increased steadily over recent years, with Europe being a major importer followed by North America and South East Asian countries like Vietnam, Malaysia and Thailand. Additionally, there has been an increase in new product development within the Indonesia lace industry including advancements such as embroidery techniques that allow for multiple layers or textures on a single piece of fabric to create intricate designs. This has enabled local designers to produce unique pieces that can compete with imported ones at lower costs while still maintaining good quality standards. Furthermore, the availability of modern digital printing technology has also allowed manufacturers to produce custom patterns quickly without having to go through costly processes such as hand dyeing fabrics.
Market Drivers
Several factors have helped drive growth in the Indonesia lace market including advances in technology (e-commerce platforms) allowing buyers easy access to information about available products; government initiatives such as zero percent import tariffs; incentives provided by local governments; investment climate improvements; infrastructure investments; increasing disposable incomes among middle class consumers; rising fashion trends (particularly female); growing popularity among younger generations who want stylish garments but don`t always want them made solely out of expensive materials like silk or cashmere etc.; and finally tax reforms making it easier for firms operating within this sector to conduct business operations smoothly without any legal complications/restrictions imposedby authorities.
COVID-19 Impact on the Market
The COVID-19 pandemic had an overall negative effect on all industries across Indonesia - particularly those related to textiles & garment manufacturing where lockdowns caused severe disruptions due to businesses facing closure orders & labour shortages occurring simultaneously throughout 2025 leading into 2025.
Challenges of the Market
Lack of Government Support, Low Investment in Technology, Poor Marketing Strategies, Lack of Skilled Labor Force, High Competition from Imports.
Industry Key Players
Grosir Lace Indonesia, PT Permata Putra Mebel, CV Nusantara Seni Crafts.
Key Highlights of the Report:
- Indonesia Lace Market Outlook
- Market Size of Indonesia Lace Market, 2025
- Forecast of Indonesia Lace Market, 2032
- Historical Data and Forecast of Indonesia Lace Revenues & Volume for the Period 2022-2032F
- Indonesia Lace Market Trend Evolution
- Indonesia Lace Market Drivers and Challenges
- Indonesia Lace Price Trends
- Indonesia Lace Porter's Five Forces
- Indonesia Lace Industry Life Cycle
- Historical Data and Forecast of Indonesia Lace Market Revenues & Volume By Type for the Period 2022-2032F
- Historical Data and Forecast of Indonesia Lace Market Revenues & Volume By Cotton Thread for the Period 2022-2032F
- Historical Data and Forecast of Indonesia Lace Market Revenues & Volume By Flax for the Period 2022-2032F
- Historical Data and Forecast of Indonesia Lace Market Revenues & Volume By Silk Thread for the Period 2022-2032F
- Historical Data and Forecast of Indonesia Lace Market Revenues & Volume By Synthetic Fiber for the Period 2022-2032F
- Historical Data and Forecast of Indonesia Lace Market Revenues & Volume By Fine Copper for the Period 2022-2032F
- Historical Data and Forecast of Indonesia Lace Market Revenues & Volume By Silver Line for the Period 2022-2032F
- Historical Data and Forecast of Indonesia Lace Market Revenues & Volume By Application for the Period 2022-2032F
- Historical Data and Forecast of Indonesia Lace Market Revenues & Volume By Clothes for the Period 2022-2032F
- Historical Data and Forecast of Indonesia Lace Market Revenues & Volume By Shoes for the Period 2022-2032F
- Historical Data and Forecast of Indonesia Lace Market Revenues & Volume By Accessories for the Period 2022-2032F
- Historical Data and Forecast of Indonesia Lace Market Revenues & Volume By Soft Furniture for the Period 2022-2032F
- Historical Data and Forecast of Indonesia Lace Market Revenues & Volume By Other for the Period 2022-2032F
- Indonesia Lace Import Export Trade Statistics
- Market Opportunity Assessment By Type
- Market Opportunity Assessment By Application
- Indonesia Lace Top Companies Market Share
- Indonesia Lace Competitive Benchmarking By Technical and Operational Parameters
- Indonesia Lace Company Profiles
- Indonesia Lace Key Strategic Recommendations
Frequently Asked Questions About the Market Study (FAQs):
6Wresearch actively monitors the Indonesia Lace Market and publishes its comprehensive annual report, highlighting emerging trends, growth drivers, revenue analysis, and forecast outlook. Our insights help businesses to make data-backed strategic decisions with ongoing market dynamics. Our analysts track relevent industries related to the Indonesia Lace Market, allowing our clients with actionable intelligence and reliable forecasts tailored to emerging regional needs.
Yes, we provide customisation as per your requirements. To learn more, feel free to contact us on sales@6wresearch.com
1 Executive Summary |
2 Introduction |
2.1 Key Highlights of the Report |
2.2 Report Description |
2.3 Market Scope & Segmentation |
2.4 Research Methodology |
2.5 Assumptions |
3 Indonesia Lace Market Overview |
3.1 Indonesia Country Macro Economic Indicators |
3.2 Indonesia Lace Market Revenues & Volume, 2022 & 2032F |
3.3 Indonesia Lace Market - Industry Life Cycle |
3.4 Indonesia Lace Market - Porter's Five Forces |
3.5 Indonesia Lace Market Revenues & Volume Share, By Type, 2022 & 2032F |
3.6 Indonesia Lace Market Revenues & Volume Share, By Application, 2022 & 2032F |
4 Indonesia Lace Market Dynamics |
4.1 Impact Analysis |
4.2 Market Drivers |
4.2.1 Growing fashion industry in Indonesia |
4.2.2 Increasing demand for unique and customized clothing |
4.2.3 Rising disposable income levels in the country |
4.3 Market Restraints |
4.3.1 Competition from cheaper alternatives like synthetic lace |
4.3.2 Challenges in maintaining quality standards |
4.3.3 Fluctuations in raw material prices |
5 Indonesia Lace Market Trends |
6 Indonesia Lace Market, By Types |
6.1 Indonesia Lace Market, By Type |
6.1.1 Overview and Analysis |
6.1.2 Indonesia Lace Market Revenues & Volume, By Type, 2022-2032F |
6.1.3 Indonesia Lace Market Revenues & Volume, By Cotton Thread, 2022-2032F |
6.1.4 Indonesia Lace Market Revenues & Volume, By Flax, 2022-2032F |
6.1.5 Indonesia Lace Market Revenues & Volume, By Silk Thread, 2022-2032F |
6.1.6 Indonesia Lace Market Revenues & Volume, By Synthetic Fiber, 2022-2032F |
6.1.7 Indonesia Lace Market Revenues & Volume, By Fine Copper, 2022-2032F |
6.1.8 Indonesia Lace Market Revenues & Volume, By Silver Line, 2022-2032F |
6.2 Indonesia Lace Market, By Application |
6.2.1 Overview and Analysis |
6.2.2 Indonesia Lace Market Revenues & Volume, By Clothes, 2022-2032F |
6.2.3 Indonesia Lace Market Revenues & Volume, By Shoes, 2022-2032F |
6.2.4 Indonesia Lace Market Revenues & Volume, By Accessories, 2022-2032F |
6.2.5 Indonesia Lace Market Revenues & Volume, By Soft Furniture, 2022-2032F |
6.2.6 Indonesia Lace Market Revenues & Volume, By Other, 2022-2032F |
7 Indonesia Lace Market Import-Export Trade Statistics |
7.1 Indonesia Lace Market Export to Major Countries |
7.2 Indonesia Lace Market Imports from Major Countries |
8 Indonesia Lace Market Key Performance Indicators |
8.1 Percentage of revenue from new product designs |
8.2 Customer satisfaction scores related to product quality |
8.3 Percentage of repeat customers |
8.4 Number of collaborations with local designers |
8.5 Percentage of revenue from online sales |
9 Indonesia Lace Market - Opportunity Assessment |
9.1 Indonesia Lace Market Opportunity Assessment, By Type, 2022 & 2032F |
9.2 Indonesia Lace Market Opportunity Assessment, By Application, 2022 & 2032F |
10 Indonesia Lace Market - Competitive Landscape |
10.1 Indonesia Lace Market Revenue Share, By Companies, 2032 |
10.2 Indonesia Lace Market Competitive Benchmarking, By Operating and Technical Parameters |
11 Company Profiles |
12 Recommendations |
13 Disclaimer |
Export potential assessment - trade Analytics for 2030
Export potential enables firms to identify high-growth global markets with greater confidence by combining advanced trade intelligence with a structured quantitative methodology. The framework analyzes emerging demand trends and country-level import patterns while integrating macroeconomic and trade datasets such as GDP and population forecasts, bilateral import–export flows, tariff structures, elasticity differentials between developed and developing economies, geographic distance, and import demand projections. Using weighted trade values from 2020–2024 as the base period to project country-to-country export potential for 2030, these inputs are operationalized through calculated drivers such as gravity model parameters, tariff impact factors, and projected GDP per-capita growth. Through an analysis of hidden potentials, demand hotspots, and market conditions that are most favorable to success, this method enables firms to focus on target countries, maximize returns, and global expansion with data, backed by accuracy.
By factoring in the projected importer demand gap that is currently unmet and could be potential opportunity, it identifies the potential for the Exporter (Country) among 190 countries, against the general trade analysis, which identifies the biggest importer or exporter.
To discover high-growth global markets and optimize your business strategy:
Click Here
Pricing
- Single User License$ 1,995
- Department License$ 2,400
- Site License$ 3,120
- Global License$ 3,795

Search
Thought Leadership and Analyst Meet


Our Clients
Related Reports
- Iraq Insulation and Waterproofing Market (2026-2032) | Outlook, Drivers, Growth, Size, Share, Industry, Revenue, Trends, Demand, Competitive, Strategic Insights, Opportunities, Segments, Companies, Challenges, Strategy, Consumer Insights, Analysis, Investment Trends, Value, Segmentation, Forecast, Restraints
- India Switchgear Market Outlook (2026 - 2032) | Size, Share, Trends, Growth, Revenue, Forecast, Analysis, Value, Outlook
- Pakistan Contraceptive Implants Market (2025-2031) | Demand, Growth, Size, Share, Industry, Pricing Analysis, Competitive, Strategic Insights, Strategy, Consumer Insights, Analysis, Investment Trends, Opportunities, Revenue, Segments, Value, Segmentation, Supply, Forecast, Restraints, Outlook, Competition, Drivers, Trends, Companies, Challenges
- Sri Lanka Packaging Market (2026-2032) | Outlook, Competition, Drivers, Trends, Demand, Pricing Analysis, Competitive, Strategic Insights, Companies, Challenges, Strategy, Consumer Insights, Analysis, Investment Trends, Opportunities, Growth, Size, Share, Industry, Revenue, Segments, Value, Segmentation, Supply, Forecast, Restraints
- India Kids Watches Market (2026-2032) | Strategy, Consumer Insights, Analysis, Investment Trends, Opportunities, Growth, Size, Share, Industry, Revenue, Segments, Value, Segmentation, Supply, Forecast, Restraints, Outlook, Competition, Drivers, Trends, Demand, Pricing Analysis, Competitive, Strategic Insights, Companies, Challenges
- Saudi Arabia Core Assurance Service Market (2025-2031) | Strategy, Consumer Insights, Analysis, Investment Trends, Opportunities, Growth, Size, Share, Industry, Revenue, Segments, Value, Segmentation, Supply, Forecast, Restraints, Outlook, Competition, Drivers, Trends, Demand, Pricing Analysis, Competitive, Strategic Insights, Companies, Challenges
- Romania Uninterruptible Power Supply (UPS) Market (2026-2032) | Industry, Analysis, Revenue, Size, Forecast, Outlook, Value, Trends, Share, Growth & Companies
- Saudi Arabia Car Window Tinting Film, Paint Protection Film (PPF), and Ceramic Coating Market (2025-2031) | Strategy, Consumer Insights, Analysis, Investment Trends, Opportunities, Growth, Size, Share, Industry, Revenue, Segments, Value, Segmentation, Supply, Forecast, Restraints, Outlook, Competition, Drivers, Trends, Demand, Pricing Analysis, Competitive, Strategic Insights, Companies, Challenges
- South Africa Stationery Market (2025-2031) | Share, Size, Industry, Value, Growth, Revenue, Analysis, Trends, Segmentation & Outlook
- Afghanistan Rocking Chairs And Adirondack Chairs Market (2026-2032) | Size & Revenue, Competitive Landscape, Share, Segmentation, Industry, Value, Outlook, Analysis, Trends, Growth, Forecast, Companies
Industry Events and Analyst Meet

India EV Show 2026

EV tech India Expo 2026

Auto Tech Asia 2026

Battery Tech India 2026

Smart Production Solutions Guangzhou 2026
Whitepaper
- Middle East & Africa Commercial Security Market Click here to view more.
- Middle East & Africa Fire Safety Systems & Equipment Market Click here to view more.
- GCC Drone Market Click here to view more.
- Middle East Lighting Fixture Market Click here to view more.
- GCC Physical & Perimeter Security Market Click here to view more.
6WResearch In News
- Doha a strategic location for EV manufacturing hub: IPA Qatar
- Demand for luxury TVs surging in the GCC, says Samsung
- Empowering Growth: The Thriving Journey of Bangladesh’s Cable Industry
- Demand for luxury TVs surging in the GCC, says Samsung
- Video call with a traditional healer? Once unthinkable, it’s now common in South Africa
- Intelligent Buildings To Smooth GCC’s Path To Net Zero