Indonesia Micro Turbine Market (2026-2032) Outlook | Industry, Share, Forecast, Size, Trends, Analysis, Revenue, Growth, Companies & Value
Market Forecast By Application (Combined Heat & Power (CHP), Standby Power), By Power Rating (12 kW -50 kW, 50 kW-250 kW, 250 kW-500 kW), By End-use (Industrial, Commercial, Residential) And Competitive Landscape
| Product Code: ETC099167 | Publication Date: Jul 2023 | Updated Date: Mar 2026 | Product Type: Report | |
| Publisher: 6Wresearch | Author: Ravi Bhandari | No. of Pages: 70 | No. of Figures: 35 | No. of Tables: 5 |
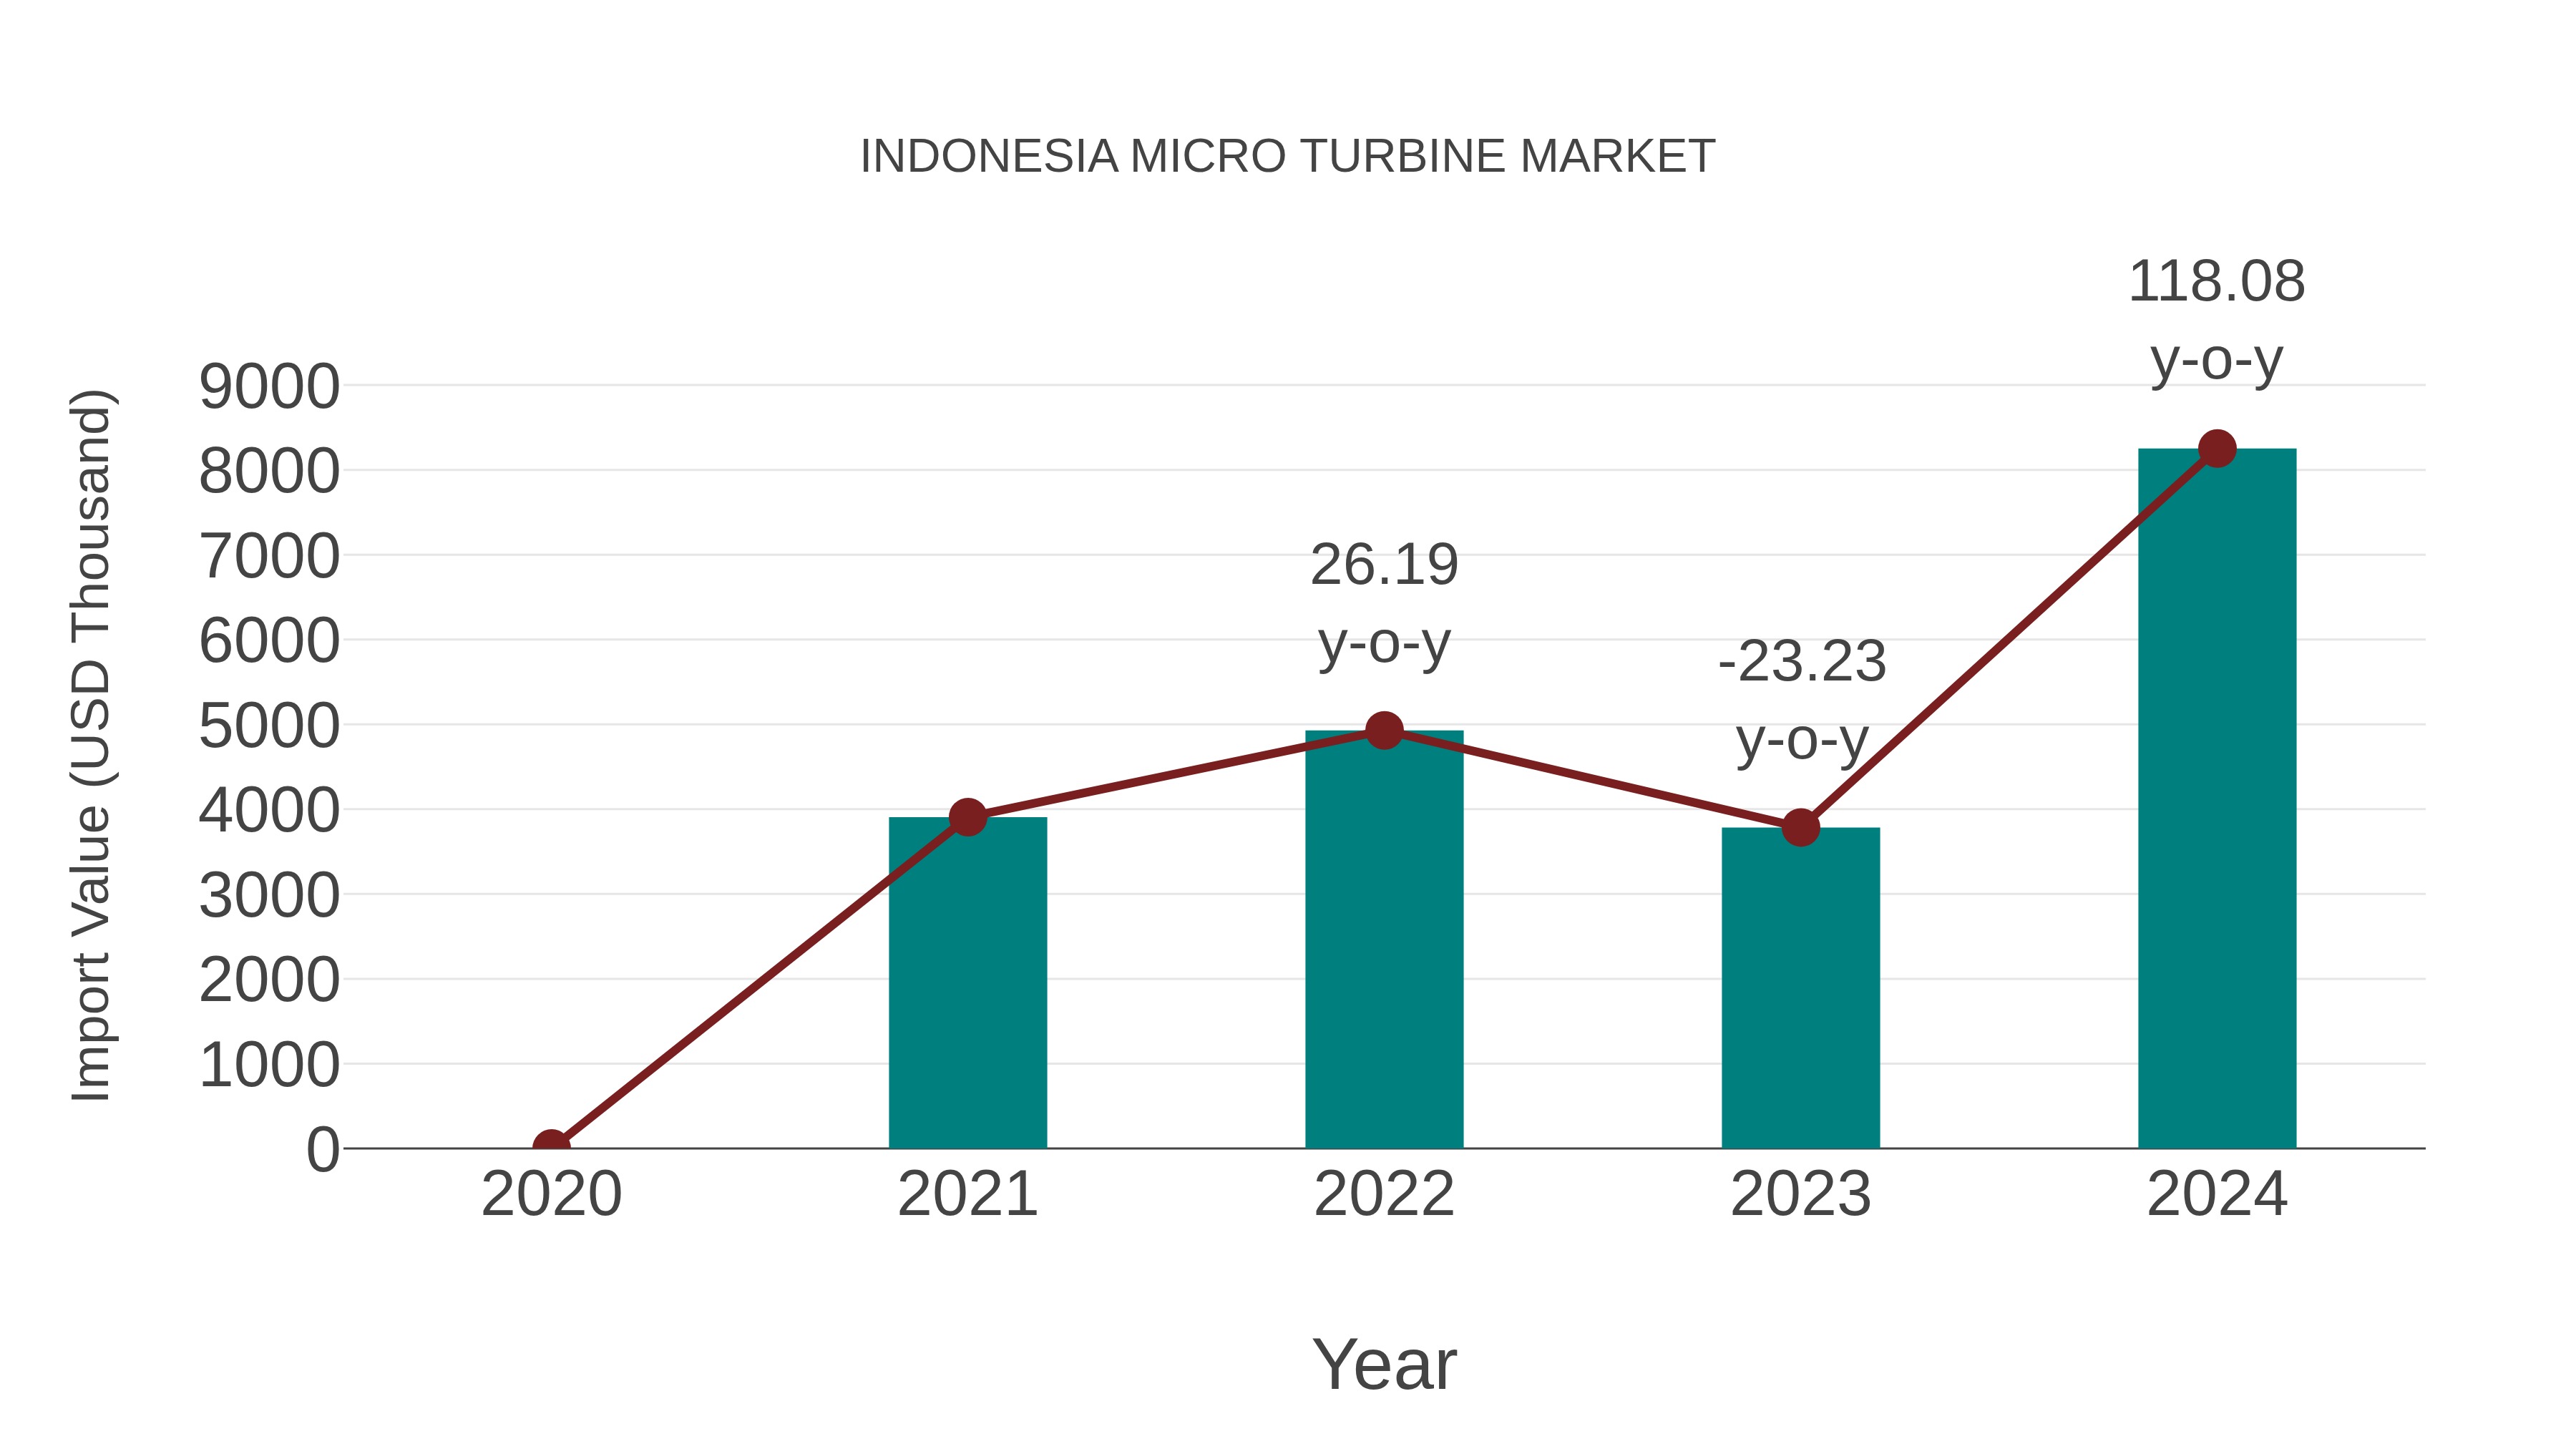
Indonesia Micro Turbine Market: Import Trend Analysis
Indonesia`s import momentum for the micro turbine market saw significant growth from 2023 to 2024, with a notable increase of 118.08%. The compound annual growth rate (CAGR) for imports in this sector between 2020 and 2024 stood at 28.31%. This surge can be attributed to a notable shift in demand towards more energy-efficient solutions, indicating a potential market stability and growing interest in sustainable energy sources within the region.
Indonesia Micro Turbine MarketSynopsis
The Indonesia micro turbine market is expected to grow significantly in the upcoming years, attributed to increasing demand for cleaner energy sources and rising awareness about renewable energy among consumers. The growth of the micro turbine market in Indonesia is driven by government policies that support the use of clean energy sources and initiatives taken up by key players towards expanding their presence in this emerging sector. Additionally, technological advancements are further contributing to a positive on the market.
Market Trends
Some of the trends observed within the Indonesia micro turbine industry include an increasing number of research & development activities carried out for improving efficiency as well as cost-competitiveness, rising investment in smart grid infrastructure, and growing focus on distributed power generation systems. Furthermore, there has been a shift from traditional diesel generators to alternative options such as micro turbines due to their environmental benefits. In addition, some key players have launched innovative products aimed at providing efficient solutions for remote or off-grid areas with limited access to electricity grids.
Market Drivers
The main drivers of growth within this sector include supportive government regulations encouraging the adoption of renewable energy sources such as wind and biomass among households; increasing investments by major corporations into research & development activities aimed at improving efficiency; availability of advanced technology solutions; incentives provided for installing solar panels or other green technologies; rising consumer awareness regarding sustainable practices; and decreasing costs associated with accessing clean energy sources over time. Moreover, technological advancement has enabled manufacturers to produce more powerful yet lightweight components which helps reduce overall installation costs while simultaneously reducing maintenance requirements in turn leading towards higher profitability margins from operations conducted using these devices.
COVID-19 Impact on the Market
The COVID-19 pandemic has had a significant impact on the Indonesia micro turbine market. Major industries in the country such as hospitality, tourism, and manufacturing have experienced downturns due to restrictions imposed by the government and disruption of global supply chains. This has caused many businesses to lower their investments into renewable energy solutions, including micro turbines for power generation. Furthermore, economic uncertainty has led to decreased consumer confidence which is having an adverse effect on demand for micro turbines in Indonesia.
Challenges of the Market
One of the main challenges facing the Indonesia micro turbine market is its relatively high cost compared to other renewable energy sources such as solar PV or wind power. This makes it difficult for businesses and homeowners who are looking at investing in clean energy solutions but cannot afford more expensive systems like solar PV or windpower. Additionally, there is limited access to financing options for individuals interested in purchasing microturbines due to low credit ratings and lack of collateral requirements from lenders. There is also complex regulations governing installation procedures that can make setting up a system much more costly than it needs be if not navigated correctly.
Industry Key Players
Some of the key players operating within the Indonesia micro turbine market include General Electric (GE), Siemens AG, Vestas Wind Systems A/S, Alstom SA ,Gamesa Corporation Technology S A U., Suzlon Energy Ltd., GE Power Conversion France SASU., Nordex SE etc.
Key Highlights of the Report:
- Indonesia Micro Turbine Market Outlook
- Market Size of Indonesia Micro Turbine Market, 2025
- Forecast of Indonesia Micro Turbine Market, 2032
- Historical Data and Forecast of Indonesia Micro Turbine Revenues & Volume for the Period 2022-2032F
- Indonesia Micro Turbine Market Trend Evolution
- Indonesia Micro Turbine Market Drivers and Challenges
- Indonesia Micro Turbine Price Trends
- Indonesia Micro Turbine Porter's Five Forces
- Indonesia Micro Turbine Industry Life Cycle
- Historical Data and Forecast of Indonesia Micro Turbine Market Revenues & Volume By Application for the Period 2022-2032F
- Historical Data and Forecast of Indonesia Micro Turbine Market Revenues & Volume By Combined Heat & Power (CHP) for the Period 2022-2032F
- Historical Data and Forecast of Indonesia Micro Turbine Market Revenues & Volume By Standby Power for the Period 2022-2032F
- Historical Data and Forecast of Indonesia Micro Turbine Market Revenues & Volume By Power Rating for the Period 2022-2032F
- Historical Data and Forecast of Indonesia Micro Turbine Market Revenues & Volume By 12 kW -50 kW for the Period 2022-2032F
- Historical Data and Forecast of Indonesia Micro Turbine Market Revenues & Volume By 50 kW-250 kW for the Period 2022-2032F
- Historical Data and Forecast of Indonesia Micro Turbine Market Revenues & Volume By 250 kW-500 kW for the Period 2022-2032F
- Historical Data and Forecast of Indonesia Micro Turbine Market Revenues & Volume By End-use for the Period 2022-2032F
- Historical Data and Forecast of Indonesia Micro Turbine Market Revenues & Volume By Industrial for the Period 2022-2032F
- Historical Data and Forecast of Indonesia Micro Turbine Market Revenues & Volume By Commercial for the Period 2022-2032F
- Historical Data and Forecast of Indonesia Micro Turbine Market Revenues & Volume By Residential for the Period 2022-2032F
- Indonesia Micro Turbine Import Export Trade Statistics
- Market Opportunity Assessment By Application
- Market Opportunity Assessment By Power Rating
- Market Opportunity Assessment By End-use
- Indonesia Micro Turbine Top Companies Market Share
- Indonesia Micro Turbine Competitive Benchmarking By Technical and Operational Parameters
- Indonesia Micro Turbine Company Profiles
- Indonesia Micro Turbine Key Strategic Recommendations
Indonesia Micro Turbine Market (2026-2032): FAQs
6Wresearch actively monitors the Indonesia Micro Turbine Market and publishes its comprehensive annual report, highlighting emerging trends, growth drivers, revenue analysis, and forecast outlook. Our insights help businesses to make data-backed strategic decisions with ongoing market dynamics. Our analysts track relevent industries related to the Indonesia Micro Turbine Market, allowing our clients with actionable intelligence and reliable forecasts tailored to emerging regional needs.
Yes, we provide customisation as per your requirements. To learn more, feel free to contact us on sales@6wresearch.com
1 Executive Summary |
2 Introduction |
2.1 Key Highlights of the Report |
2.2 Report Description |
2.3 Market Scope & Segmentation |
2.4 Research Methodology |
2.5 Assumptions |
3 Indonesia Micro Turbine Market Overview |
3.1 Indonesia Country Macro Economic Indicators |
3.2 Indonesia Micro Turbine Market Revenues & Volume, 2022 & 2032F |
3.3 Indonesia Micro Turbine Market - Industry Life Cycle |
3.4 Indonesia Micro Turbine Market - Porter's Five Forces |
3.5 Indonesia Micro Turbine Market Revenues & Volume Share, By Application, 2022 & 2032F |
3.6 Indonesia Micro Turbine Market Revenues & Volume Share, By Power Rating, 2022 & 2032F |
3.7 Indonesia Micro Turbine Market Revenues & Volume Share, By End-use, 2022 & 2032F |
4 Indonesia Micro Turbine Market Dynamics |
4.1 Impact Analysis |
4.2 Market Drivers |
4.2.1 Increasing demand for efficient and reliable energy solutions in Indonesia |
4.2.2 Government initiatives and incentives to promote renewable energy sources |
4.2.3 Growing awareness about the environmental benefits of micro turbines |
4.3 Market Restraints |
4.3.1 High initial investment costs associated with micro turbines |
4.3.2 Lack of skilled workforce for installation and maintenance of micro turbines |
4.3.3 Regulatory challenges and uncertainties in the energy sector in Indonesia |
5 Indonesia Micro Turbine Market Trends |
6 Indonesia Micro Turbine Market, By Types |
6.1 Indonesia Micro Turbine Market, By Application |
6.1.1 Overview and Analysis |
6.1.2 Indonesia Micro Turbine Market Revenues & Volume, By Application, 2022-2032F |
6.1.3 Indonesia Micro Turbine Market Revenues & Volume, By Combined Heat & Power (CHP), 2022-2032F |
6.1.4 Indonesia Micro Turbine Market Revenues & Volume, By Standby Power, 2022-2032F |
6.2 Indonesia Micro Turbine Market, By Power Rating |
6.2.1 Overview and Analysis |
6.2.2 Indonesia Micro Turbine Market Revenues & Volume, By 12 kW -50 kW, 2022-2032F |
6.2.3 Indonesia Micro Turbine Market Revenues & Volume, By 50 kW-250 kW, 2022-2032F |
6.2.4 Indonesia Micro Turbine Market Revenues & Volume, By 250 kW-500 kW, 2022-2032F |
6.3 Indonesia Micro Turbine Market, By End-use |
6.3.1 Overview and Analysis |
6.3.2 Indonesia Micro Turbine Market Revenues & Volume, By Industrial, 2022-2032F |
6.3.3 Indonesia Micro Turbine Market Revenues & Volume, By Commercial, 2022-2032F |
6.3.4 Indonesia Micro Turbine Market Revenues & Volume, By Residential, 2022-2032F |
7 Indonesia Micro Turbine Market Import-Export Trade Statistics |
7.1 Indonesia Micro Turbine Market Export to Major Countries |
7.2 Indonesia Micro Turbine Market Imports from Major Countries |
8 Indonesia Micro Turbine Market Key Performance Indicators |
8.1 Average capacity utilization rate of micro turbines in Indonesia |
8.2 Rate of adoption of micro turbines in different industries |
8.3 Percentage of energy generated from micro turbines in the overall energy mix in Indonesia |
9 Indonesia Micro Turbine Market - Opportunity Assessment |
9.1 Indonesia Micro Turbine Market Opportunity Assessment, By Application, 2022 & 2032F |
9.2 Indonesia Micro Turbine Market Opportunity Assessment, By Power Rating, 2022 & 2032F |
9.3 Indonesia Micro Turbine Market Opportunity Assessment, By End-use, 2022 & 2032F |
10 Indonesia Micro Turbine Market - Competitive Landscape |
10.1 Indonesia Micro Turbine Market Revenue Share, By Companies, 2025 |
10.2 Indonesia Micro Turbine Market Competitive Benchmarking, By Operating and Technical Parameters |
11 Company Profiles |
12 Recommendations |
13 Disclaimer |
Export potential assessment - trade Analytics for 2030
Export potential enables firms to identify high-growth global markets with greater confidence by combining advanced trade intelligence with a structured quantitative methodology. The framework analyzes emerging demand trends and country-level import patterns while integrating macroeconomic and trade datasets such as GDP and population forecasts, bilateral import–export flows, tariff structures, elasticity differentials between developed and developing economies, geographic distance, and import demand projections. Using weighted trade values from 2020–2024 as the base period to project country-to-country export potential for 2030, these inputs are operationalized through calculated drivers such as gravity model parameters, tariff impact factors, and projected GDP per-capita growth. Through an analysis of hidden potentials, demand hotspots, and market conditions that are most favorable to success, this method enables firms to focus on target countries, maximize returns, and global expansion with data, backed by accuracy.
By factoring in the projected importer demand gap that is currently unmet and could be potential opportunity, it identifies the potential for the Exporter (Country) among 190 countries, against the general trade analysis, which identifies the biggest importer or exporter.
To discover high-growth global markets and optimize your business strategy:
Click Here
Pricing
- Single User License$ 1,995
- Department License$ 2,400
- Site License$ 3,120
- Global License$ 3,795

Search
Thought Leadership and Analyst Meet


Our Clients
Latest Reports
- United Kingdom (UK) Long-term Care Insurance Market (2026-2032) | Growth, Share, Consumer Insights, Drivers, Opportunities, Competition, Pricing Analysis, Segments, Restraints, Companies, Competitive, Value, Outlook, Size, Demand, Analysis, Challenges, Strategic Insights, Investment Trends, Revenue, Trends, Supply, Forecast
- United Kingdom (UK) Long Term Care Market (2026-2032) | Companies, Outlook, Analysis, Trends, Value, Revenue, Segmentation, Share, Forecast, Competitive Landscape, Growth, Size & Forecast
- Iraq Insulation and Waterproofing Market (2026-2032) | Outlook, Drivers, Growth, Size, Share, Industry, Revenue, Trends, Demand, Competitive, Strategic Insights, Opportunities, Segments, Companies, Challenges, Strategy, Consumer Insights, Analysis, Investment Trends, Value, Segmentation, Forecast, Restraints
- India Switchgear Market Outlook (2026 - 2032) | Size, Share, Trends, Growth, Revenue, Forecast, Analysis, Value, Outlook
- Pakistan Contraceptive Implants Market (2025-2031) | Demand, Growth, Size, Share, Industry, Pricing Analysis, Competitive, Strategic Insights, Strategy, Consumer Insights, Analysis, Investment Trends, Opportunities, Revenue, Segments, Value, Segmentation, Supply, Forecast, Restraints, Outlook, Competition, Drivers, Trends, Companies, Challenges
- Sri Lanka Packaging Market (2026-2032) | Outlook, Competition, Drivers, Trends, Demand, Pricing Analysis, Competitive, Strategic Insights, Companies, Challenges, Strategy, Consumer Insights, Analysis, Investment Trends, Opportunities, Growth, Size, Share, Industry, Revenue, Segments, Value, Segmentation, Supply, Forecast, Restraints
- India Kids Watches Market (2026-2032) | Strategy, Consumer Insights, Analysis, Investment Trends, Opportunities, Growth, Size, Share, Industry, Revenue, Segments, Value, Segmentation, Supply, Forecast, Restraints, Outlook, Competition, Drivers, Trends, Demand, Pricing Analysis, Competitive, Strategic Insights, Companies, Challenges
- Saudi Arabia Core Assurance Service Market (2025-2031) | Strategy, Consumer Insights, Analysis, Investment Trends, Opportunities, Growth, Size, Share, Industry, Revenue, Segments, Value, Segmentation, Supply, Forecast, Restraints, Outlook, Competition, Drivers, Trends, Demand, Pricing Analysis, Competitive, Strategic Insights, Companies, Challenges
- Romania Uninterruptible Power Supply (UPS) Market (2026-2032) | Industry, Analysis, Revenue, Size, Forecast, Outlook, Value, Trends, Share, Growth & Companies
- Saudi Arabia Car Window Tinting Film, Paint Protection Film (PPF), and Ceramic Coating Market (2025-2031) | Strategy, Consumer Insights, Analysis, Investment Trends, Opportunities, Growth, Size, Share, Industry, Revenue, Segments, Value, Segmentation, Supply, Forecast, Restraints, Outlook, Competition, Drivers, Trends, Demand, Pricing Analysis, Competitive, Strategic Insights, Companies, Challenges
Industry Events and Analyst Meet

India EV Show 2026

EV tech India Expo 2026

Auto Tech Asia 2026

Battery Tech India 2026

Smart Production Solutions Guangzhou 2026
Whitepaper
- Middle East & Africa Commercial Security Market Click here to view more.
- Middle East & Africa Fire Safety Systems & Equipment Market Click here to view more.
- GCC Drone Market Click here to view more.
- Middle East Lighting Fixture Market Click here to view more.
- GCC Physical & Perimeter Security Market Click here to view more.
6WResearch In News
- Doha a strategic location for EV manufacturing hub: IPA Qatar
- Demand for luxury TVs surging in the GCC, says Samsung
- Empowering Growth: The Thriving Journey of Bangladesh’s Cable Industry
- Demand for luxury TVs surging in the GCC, says Samsung
- Video call with a traditional healer? Once unthinkable, it’s now common in South Africa
- Intelligent Buildings To Smooth GCC’s Path To Net Zero