Indonesia Phthalic anhydride Market (2026-2032) Outlook | Analysis, Growth, Share, Companies, Size, Trends, Value, Revenue, Industry & Forecast
Market Forecast By Process Type (O-Xylene Catalytic Oxidation, Napthalene Catalytic Oxidation), By Applications (Plasticizer, Polyester Resin, Alkyd Resin, Polyester Polyols, Dyes, Medicine, Insecticides, Others), By End-users (Automotive & Transportation, Building & Construction, Paints & Coatings, Marine, Electrical & Electronics, Plastics, Agriculture, Others) And Competitive Landscape
| Product Code: ETC088607 | Publication Date: Jul 2023 | Updated Date: Mar 2026 | Product Type: Report | |
| Publisher: 6Wresearch | Author: Ravi Bhandari | No. of Pages: 70 | No. of Figures: 35 | No. of Tables: 5 |
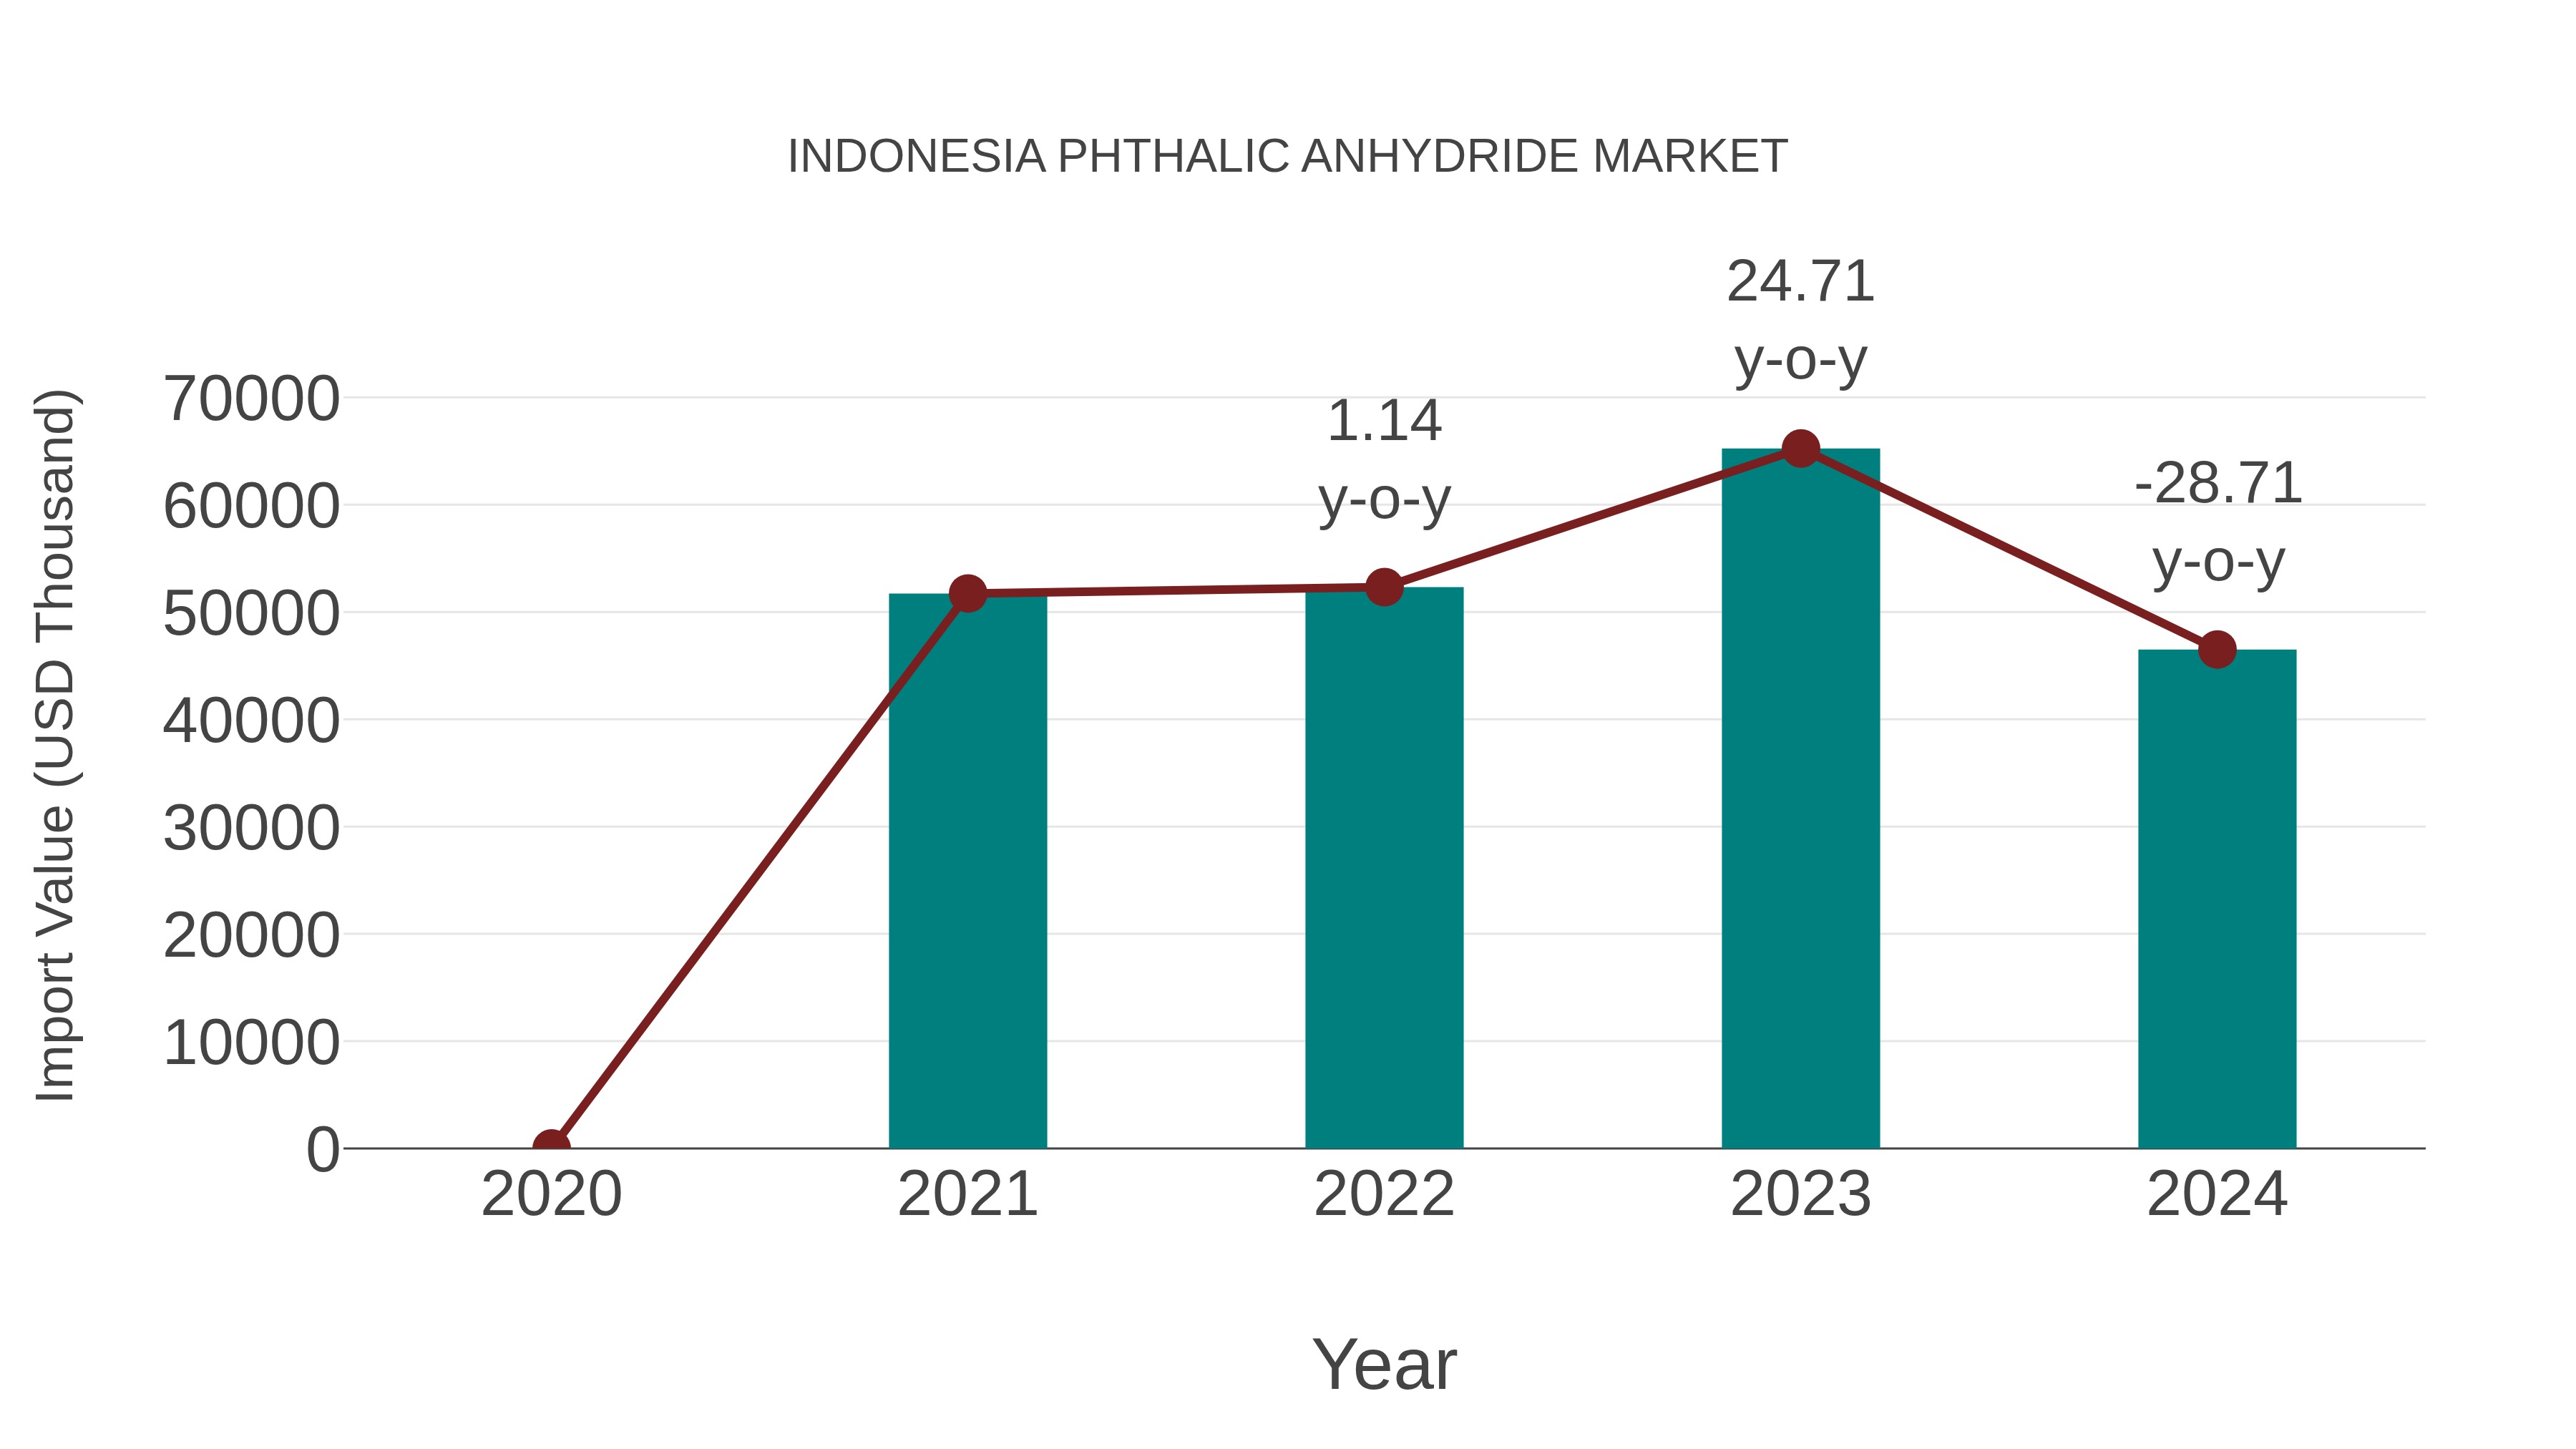
Indonesia Phthalic Anhydride Market: Import Trend Analysis
In the Indonesia phthalic anhydride market, the import trend experienced a notable decline from 2023 to 2024, with a growth rate of -28.71%. The compound annual growth rate (CAGR) for imports over the period of 2020-2024 stood at -3.48%. This decline can be attributed to a combination of decreased demand and potential shifts in market dynamics impacting import momentum in the sector.
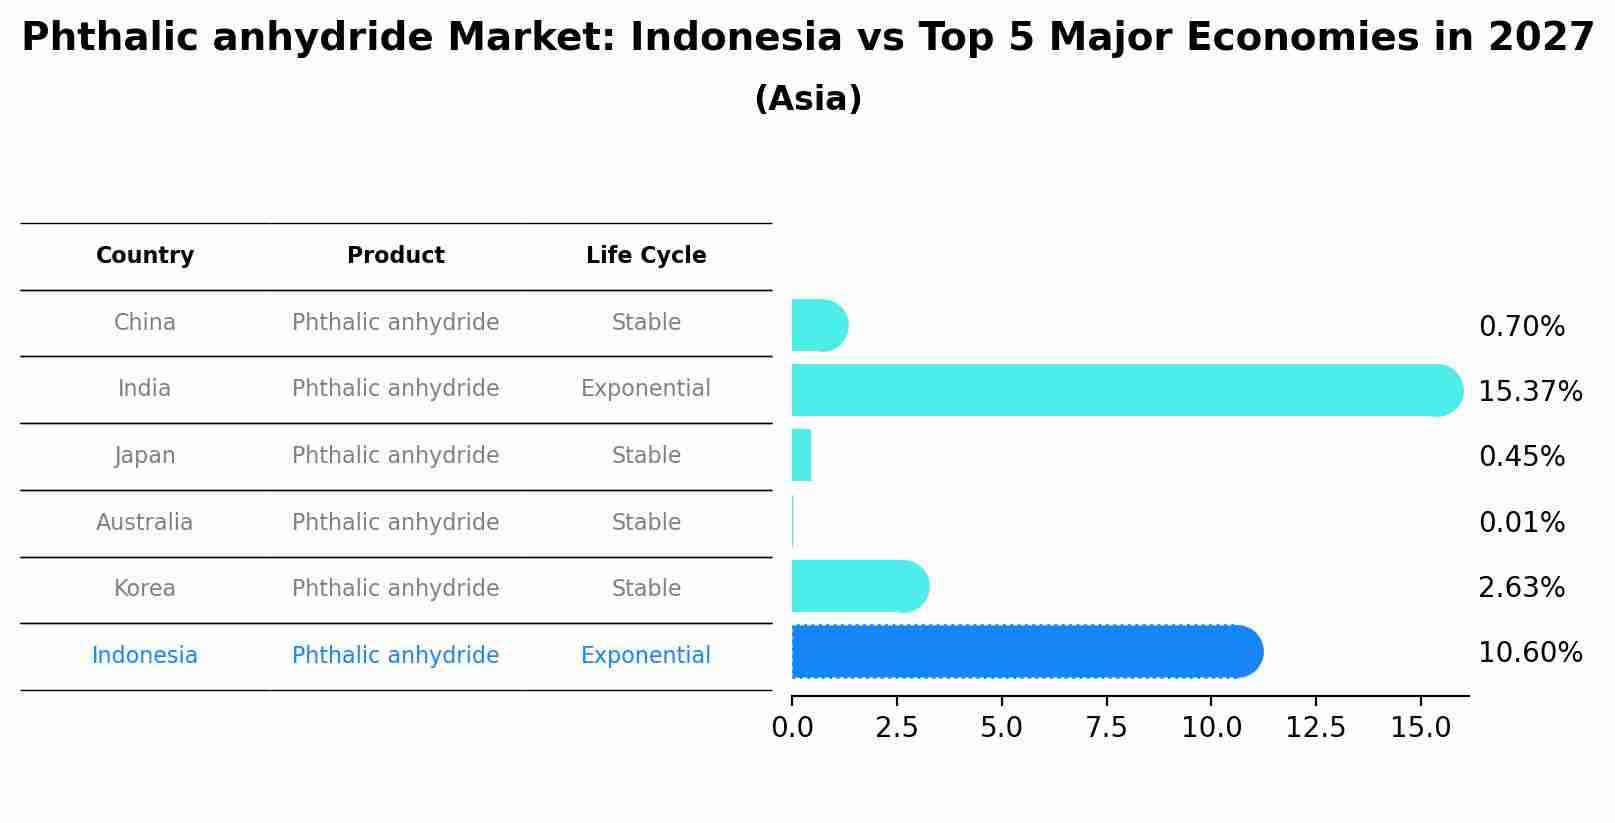
Phthalic anhydride Market: Indonesia vs Top 5 Major Economies in 2027 (Asia)
By 2027, Indonesia's Phthalic anhydride market is forecasted to achieve a high growth rate of 10.60%, with China leading the Asia region, followed by India, Japan, Australia and South Korea.
Indonesia Phthalic anhydride Market Synopsis
Indonesia phthalic anhydride (PA) market is projected to witness a steady growth rate during the forecast period, 2025-2031. The country has one of the largest petrochemical industries in Southeast Asia and this industry dominates the country PA production and consumption. PA is extensively employed in various end-use applications including unsaturated polyester resins, alkyd resins, plasticizers, surfactants, and other specialty products for numerous industries such as automotive & transportation, construction, consumer goods & packaging among others.
Market Trends
The rising demand from downstream markets like paints & coatings are expected to remain one of the major driving forces behind the increasing usage of Indonesia phthalic anhydride over the forecast period. In addition to this, growing use of plastics across diverse verticals due to their superior characteristics will propel overall market growth in Indonesia. Moreover, with stringent government regulations on VOC emissions coupled with increased investments towards R&D activities pertaining new technology developments are anticipated to have a positive influence on market expansion throughout the forecast period.
Market Drivers
Increasing demand from downstream sectors such as plastics which positively impacts product sales. Growing investments towards research and development activities aimed at technological advancements
COVID-19 Impact on the Market
The spread of COVID-19 pandemic had a negative impact on Indonesia Phthalic Anhydride Market owing to disruptions within supply chain networks along with restrictions imposed on movement by governments during lockdown periods which led towards lesser raw material availability for manufacturing purposes resulting into temporary shutdown operations thus having a considerable decrease in product sales worldwide. However post lockdowns were eased out ,the situation started normalizing gradually but still there remains some degree unpredictability within global industrial sector due to uncertain economic conditions caused by multiple factors however it can be expected that things will go back normal soon once vaccinations start taking place widely around globe.
Challenges of the Market
Fluctuations in crude oil prices leads toward price volatility issues making them more expensive than counterparts available within international markets thus restricting customer reach. Health related concerns associated with certain components used while producing synthetic materials also acts as hindrance limiting overall product sales.
Industry Key Players
PT. Chandra Asri Petrochemical Tbk, PT. Pupuk Kujang, PT. Bukit Karamunting Corporation
Key Highlights of the Report:
- Indonesia Phthalic anhydride Market Outlook
- Market Size of Indonesia Phthalic anhydride Market, 2025
- Forecast of Indonesia Phthalic anhydride Market, 2032
- Historical Data and Forecast of Indonesia Phthalic anhydride Revenues & Volume for the Period 2022-2032F
- Indonesia Phthalic anhydride Market Trend Evolution
- Indonesia Phthalic anhydride Market Drivers and Challenges
- Indonesia Phthalic anhydride Price Trends
- Indonesia Phthalic anhydride Porter's Five Forces
- Indonesia Phthalic anhydride Industry Life Cycle
- Historical Data and Forecast of Indonesia Phthalic anhydride Market Revenues & Volume By Process Type for the Period 2022-2032F
- Historical Data and Forecast of Indonesia Phthalic anhydride Market Revenues & Volume By O-Xylene Catalytic Oxidation for the Period 2022-2032F
- Historical Data and Forecast of Indonesia Phthalic anhydride Market Revenues & Volume By Napthalene Catalytic Oxidation for the Period 2022-2032F
- Historical Data and Forecast of Indonesia Phthalic anhydride Market Revenues & Volume By Applications for the Period 2022-2032F
- Historical Data and Forecast of Indonesia Phthalic anhydride Market Revenues & Volume By Plasticizer for the Period 2022-2032F
- Historical Data and Forecast of Indonesia Phthalic anhydride Market Revenues & Volume By Polyester Resin for the Period 2022-2032F
- Historical Data and Forecast of Indonesia Phthalic anhydride Market Revenues & Volume By Alkyd Resin for the Period 2022-2032F
- Historical Data and Forecast of Indonesia Phthalic anhydride Market Revenues & Volume By Polyester Polyols for the Period 2022-2032F
- Historical Data and Forecast of Indonesia Phthalic anhydride Market Revenues & Volume By Dyes for the Period 2022-2032F
- Historical Data and Forecast of Indonesia Phthalic anhydride Market Revenues & Volume By Medicine for the Period 2022-2032F
- Historical Data and Forecast of Indonesia Phthalic anhydride Market Revenues & Volume By Insecticides for the Period 2022-2032F
- Historical Data and Forecast of Indonesia Phthalic anhydride Market Revenues & Volume By Others for the Period 2022-2032F
- Historical Data and Forecast of Indonesia Phthalic anhydride Market Revenues & Volume By End-users for the Period 2022-2032F
- Historical Data and Forecast of Indonesia Phthalic anhydride Market Revenues & Volume By Automotive & Transportation for the Period 2022-2032F
- Historical Data and Forecast of Indonesia Phthalic anhydride Market Revenues & Volume By Building & Construction for the Period 2022-2032F
- Historical Data and Forecast of Indonesia Phthalic anhydride Market Revenues & Volume By Paints & Coatings for the Period 2022-2032F
- Historical Data and Forecast of Indonesia Phthalic anhydride Market Revenues & Volume By Marine for the Period 2022-2032F
- Historical Data and Forecast of Indonesia Phthalic anhydride Market Revenues & Volume By Electrical & Electronics for the Period 2022-2032F
- Historical Data and Forecast of Indonesia Phthalic anhydride Market Revenues & Volume By Plastics for the Period 2022-2032F
- Historical Data and Forecast of Indonesia Phthalic anhydride Market Revenues & Volume By Agriculture for the Period 2022-2032F
- Historical Data and Forecast of Indonesia Phthalic anhydride Market Revenues & Volume By Others for the Period 2022-2032F
- Indonesia Phthalic anhydride Import Export Trade Statistics
- Market Opportunity Assessment By Process Type
- Market Opportunity Assessment By Applications
- Market Opportunity Assessment By End-users
- Indonesia Phthalic anhydride Top Companies Market Share
- Indonesia Phthalic anhydride Competitive Benchmarking By Technical and Operational Parameters
- Indonesia Phthalic anhydride Company Profiles
- Indonesia Phthalic anhydride Key Strategic Recommendations
Indonesia Phthalic anhydride Market (2026-2032): FAQs
6Wresearch actively monitors the Indonesia Phthalic anhydride Market and publishes its comprehensive annual report, highlighting emerging trends, growth drivers, revenue analysis, and forecast outlook. Our insights help businesses to make data-backed strategic decisions with ongoing market dynamics. Our analysts track relevent industries related to the Indonesia Phthalic anhydride Market, allowing our clients with actionable intelligence and reliable forecasts tailored to emerging regional needs.
Yes, we provide customisation as per your requirements. To learn more, feel free to contact us on sales@6wresearch.com
1 Executive Summary |
2 Introduction |
2.1 Key Highlights of the Report |
2.2 Report Description |
2.3 Market Scope & Segmentation |
2.4 Research Methodology |
2.5 Assumptions |
3 Indonesia Phthalic anhydride Market Overview |
3.1 Indonesia Country Macro Economic Indicators |
3.2 Indonesia Phthalic anhydride Market Revenues & Volume, 2022 & 2032F |
3.3 Indonesia Phthalic anhydride Market - Industry Life Cycle |
3.4 Indonesia Phthalic anhydride Market - Porter's Five Forces |
3.5 Indonesia Phthalic anhydride Market Revenues & Volume Share, By Process Type, 2022 & 2032F |
3.6 Indonesia Phthalic anhydride Market Revenues & Volume Share, By Applications, 2022 & 2032F |
3.7 Indonesia Phthalic anhydride Market Revenues & Volume Share, By End-users, 2022 & 2032F |
4 Indonesia Phthalic anhydride Market Dynamics |
4.1 Impact Analysis |
4.2 Market Drivers |
4.2.1 Growth in end-use industries such as plastics, paints, and coatings |
4.2.2 Increasing demand for phthalic anhydride in the construction sector |
4.2.3 Government initiatives promoting the chemical industry in Indonesia |
4.3 Market Restraints |
4.3.1 Volatility in raw material prices |
4.3.2 Stringent environmental regulations impacting production processes |
4.3.3 Competition from alternative chemicals and substitutes |
5 Indonesia Phthalic anhydride Market Trends |
6 Indonesia Phthalic anhydride Market, By Types |
6.1 Indonesia Phthalic anhydride Market, By Process Type |
6.1.1 Overview and Analysis |
6.1.2 Indonesia Phthalic anhydride Market Revenues & Volume, By Process Type, 2022-2032F |
6.1.3 Indonesia Phthalic anhydride Market Revenues & Volume, By O-Xylene Catalytic Oxidation, 2022-2032F |
6.1.4 Indonesia Phthalic anhydride Market Revenues & Volume, By Napthalene Catalytic Oxidation, 2022-2032F |
6.2 Indonesia Phthalic anhydride Market, By Applications |
6.2.1 Overview and Analysis |
6.2.2 Indonesia Phthalic anhydride Market Revenues & Volume, By Plasticizer, 2022-2032F |
6.2.3 Indonesia Phthalic anhydride Market Revenues & Volume, By Polyester Resin, 2022-2032F |
6.2.4 Indonesia Phthalic anhydride Market Revenues & Volume, By Alkyd Resin, 2022-2032F |
6.2.5 Indonesia Phthalic anhydride Market Revenues & Volume, By Polyester Polyols, 2022-2032F |
6.2.6 Indonesia Phthalic anhydride Market Revenues & Volume, By Dyes, 2022-2032F |
6.2.7 Indonesia Phthalic anhydride Market Revenues & Volume, By Medicine, 2022-2032F |
6.2.8 Indonesia Phthalic anhydride Market Revenues & Volume, By Others, 2022-2032F |
6.2.9 Indonesia Phthalic anhydride Market Revenues & Volume, By Others, 2022-2032F |
6.3 Indonesia Phthalic anhydride Market, By End-users |
6.3.1 Overview and Analysis |
6.3.2 Indonesia Phthalic anhydride Market Revenues & Volume, By Automotive & Transportation, 2022-2032F |
6.3.3 Indonesia Phthalic anhydride Market Revenues & Volume, By Building & Construction, 2022-2032F |
6.3.4 Indonesia Phthalic anhydride Market Revenues & Volume, By Paints & Coatings, 2022-2032F |
6.3.5 Indonesia Phthalic anhydride Market Revenues & Volume, By Marine, 2022-2032F |
6.3.6 Indonesia Phthalic anhydride Market Revenues & Volume, By Electrical & Electronics, 2022-2032F |
6.3.7 Indonesia Phthalic anhydride Market Revenues & Volume, By Plastics, 2022-2032F |
6.3.8 Indonesia Phthalic anhydride Market Revenues & Volume, By Others, 2022-2032F |
6.3.9 Indonesia Phthalic anhydride Market Revenues & Volume, By Others, 2022-2032F |
7 Indonesia Phthalic anhydride Market Import-Export Trade Statistics |
7.1 Indonesia Phthalic anhydride Market Export to Major Countries |
7.2 Indonesia Phthalic anhydride Market Imports from Major Countries |
8 Indonesia Phthalic anhydride Market Key Performance Indicators |
8.1 Capacity utilization rate of phthalic anhydride production facilities in Indonesia |
8.2 Adoption rate of phthalic anhydride in new applications or industries |
8.3 Research and development investment in improving phthalic anhydride production processes |
8.4 Export volume and destination markets for Indonesian phthalic anhydride industry |
8.5 Overall market sentiment and industry outlook surveys from key stakeholders |
9 Indonesia Phthalic anhydride Market - Opportunity Assessment |
9.1 Indonesia Phthalic anhydride Market Opportunity Assessment, By Process Type, 2022 & 2032F |
9.2 Indonesia Phthalic anhydride Market Opportunity Assessment, By Applications, 2022 & 2032F |
9.3 Indonesia Phthalic anhydride Market Opportunity Assessment, By End-users, 2022 & 2032F |
10 Indonesia Phthalic anhydride Market - Competitive Landscape |
10.1 Indonesia Phthalic anhydride Market Revenue Share, By Companies, 2025 |
10.2 Indonesia Phthalic anhydride Market Competitive Benchmarking, By Operating and Technical Parameters |
11 Company Profiles |
12 Recommendations |
13 Disclaimer |
Export potential assessment - trade Analytics for 2030
Export potential enables firms to identify high-growth global markets with greater confidence by combining advanced trade intelligence with a structured quantitative methodology. The framework analyzes emerging demand trends and country-level import patterns while integrating macroeconomic and trade datasets such as GDP and population forecasts, bilateral import–export flows, tariff structures, elasticity differentials between developed and developing economies, geographic distance, and import demand projections. Using weighted trade values from 2020–2024 as the base period to project country-to-country export potential for 2030, these inputs are operationalized through calculated drivers such as gravity model parameters, tariff impact factors, and projected GDP per-capita growth. Through an analysis of hidden potentials, demand hotspots, and market conditions that are most favorable to success, this method enables firms to focus on target countries, maximize returns, and global expansion with data, backed by accuracy.
By factoring in the projected importer demand gap that is currently unmet and could be potential opportunity, it identifies the potential for the Exporter (Country) among 190 countries, against the general trade analysis, which identifies the biggest importer or exporter.
To discover high-growth global markets and optimize your business strategy:
Click Here
Pricing
- Single User License$ 1,995
- Department License$ 2,400
- Site License$ 3,120
- Global License$ 3,795

Search
Thought Leadership and Analyst Meet


Our Clients
Latest Reports
- United Kingdom (UK) Long-term Care Insurance Market (2026-2032) | Growth, Share, Consumer Insights, Drivers, Opportunities, Competition, Pricing Analysis, Segments, Restraints, Companies, Competitive, Value, Outlook, Size, Demand, Analysis, Challenges, Strategic Insights, Investment Trends, Revenue, Trends, Supply, Forecast
- United Kingdom (UK) Long Term Care Market (2026-2032) | Companies, Outlook, Analysis, Trends, Value, Revenue, Segmentation, Share, Forecast, Competitive Landscape, Growth, Size & Forecast
- Iraq Insulation and Waterproofing Market (2026-2032) | Outlook, Drivers, Growth, Size, Share, Industry, Revenue, Trends, Demand, Competitive, Strategic Insights, Opportunities, Segments, Companies, Challenges, Strategy, Consumer Insights, Analysis, Investment Trends, Value, Segmentation, Forecast, Restraints
- India Switchgear Market Outlook (2026 - 2032) | Size, Share, Trends, Growth, Revenue, Forecast, Analysis, Value, Outlook
- Pakistan Contraceptive Implants Market (2025-2031) | Demand, Growth, Size, Share, Industry, Pricing Analysis, Competitive, Strategic Insights, Strategy, Consumer Insights, Analysis, Investment Trends, Opportunities, Revenue, Segments, Value, Segmentation, Supply, Forecast, Restraints, Outlook, Competition, Drivers, Trends, Companies, Challenges
- Sri Lanka Packaging Market (2026-2032) | Outlook, Competition, Drivers, Trends, Demand, Pricing Analysis, Competitive, Strategic Insights, Companies, Challenges, Strategy, Consumer Insights, Analysis, Investment Trends, Opportunities, Growth, Size, Share, Industry, Revenue, Segments, Value, Segmentation, Supply, Forecast, Restraints
- India Kids Watches Market (2026-2032) | Strategy, Consumer Insights, Analysis, Investment Trends, Opportunities, Growth, Size, Share, Industry, Revenue, Segments, Value, Segmentation, Supply, Forecast, Restraints, Outlook, Competition, Drivers, Trends, Demand, Pricing Analysis, Competitive, Strategic Insights, Companies, Challenges
- Saudi Arabia Core Assurance Service Market (2025-2031) | Strategy, Consumer Insights, Analysis, Investment Trends, Opportunities, Growth, Size, Share, Industry, Revenue, Segments, Value, Segmentation, Supply, Forecast, Restraints, Outlook, Competition, Drivers, Trends, Demand, Pricing Analysis, Competitive, Strategic Insights, Companies, Challenges
- Romania Uninterruptible Power Supply (UPS) Market (2026-2032) | Industry, Analysis, Revenue, Size, Forecast, Outlook, Value, Trends, Share, Growth & Companies
- Saudi Arabia Car Window Tinting Film, Paint Protection Film (PPF), and Ceramic Coating Market (2025-2031) | Strategy, Consumer Insights, Analysis, Investment Trends, Opportunities, Growth, Size, Share, Industry, Revenue, Segments, Value, Segmentation, Supply, Forecast, Restraints, Outlook, Competition, Drivers, Trends, Demand, Pricing Analysis, Competitive, Strategic Insights, Companies, Challenges
Industry Events and Analyst Meet

India EV Show 2026

EV tech India Expo 2026

Auto Tech Asia 2026

Battery Tech India 2026

Smart Production Solutions Guangzhou 2026
Whitepaper
- Middle East & Africa Commercial Security Market Click here to view more.
- Middle East & Africa Fire Safety Systems & Equipment Market Click here to view more.
- GCC Drone Market Click here to view more.
- Middle East Lighting Fixture Market Click here to view more.
- GCC Physical & Perimeter Security Market Click here to view more.
6WResearch In News
- Doha a strategic location for EV manufacturing hub: IPA Qatar
- Demand for luxury TVs surging in the GCC, says Samsung
- Empowering Growth: The Thriving Journey of Bangladesh’s Cable Industry
- Demand for luxury TVs surging in the GCC, says Samsung
- Video call with a traditional healer? Once unthinkable, it’s now common in South Africa
- Intelligent Buildings To Smooth GCC’s Path To Net Zero