Indonesia Processed Vegetable Market (2024-2030) | Share, Analysis, Growth, Industry, Revenue, Companies, Value, Forecast, Trends, Outlook & Size
Market Forecast By Type (Canned Vegetable, Frozen Vegetable, Fresh- Cut Vegetable), By Form (Powder, Granules, Others), By Application (Family, Restaurant, Other), By Processing Equipment (Pre-processing, Processing, Washing, Filling, Seasoning, Packaging) And Competitive Landscape
| Product Code: ETC040929 | Publication Date: Jul 2023 | Updated Date: Feb 2026 | Product Type: Report | |
| Publisher: 6Wresearch | Author: Ravi Bhandari | No. of Pages: 70 | No. of Figures: 35 | No. of Tables: 5 |
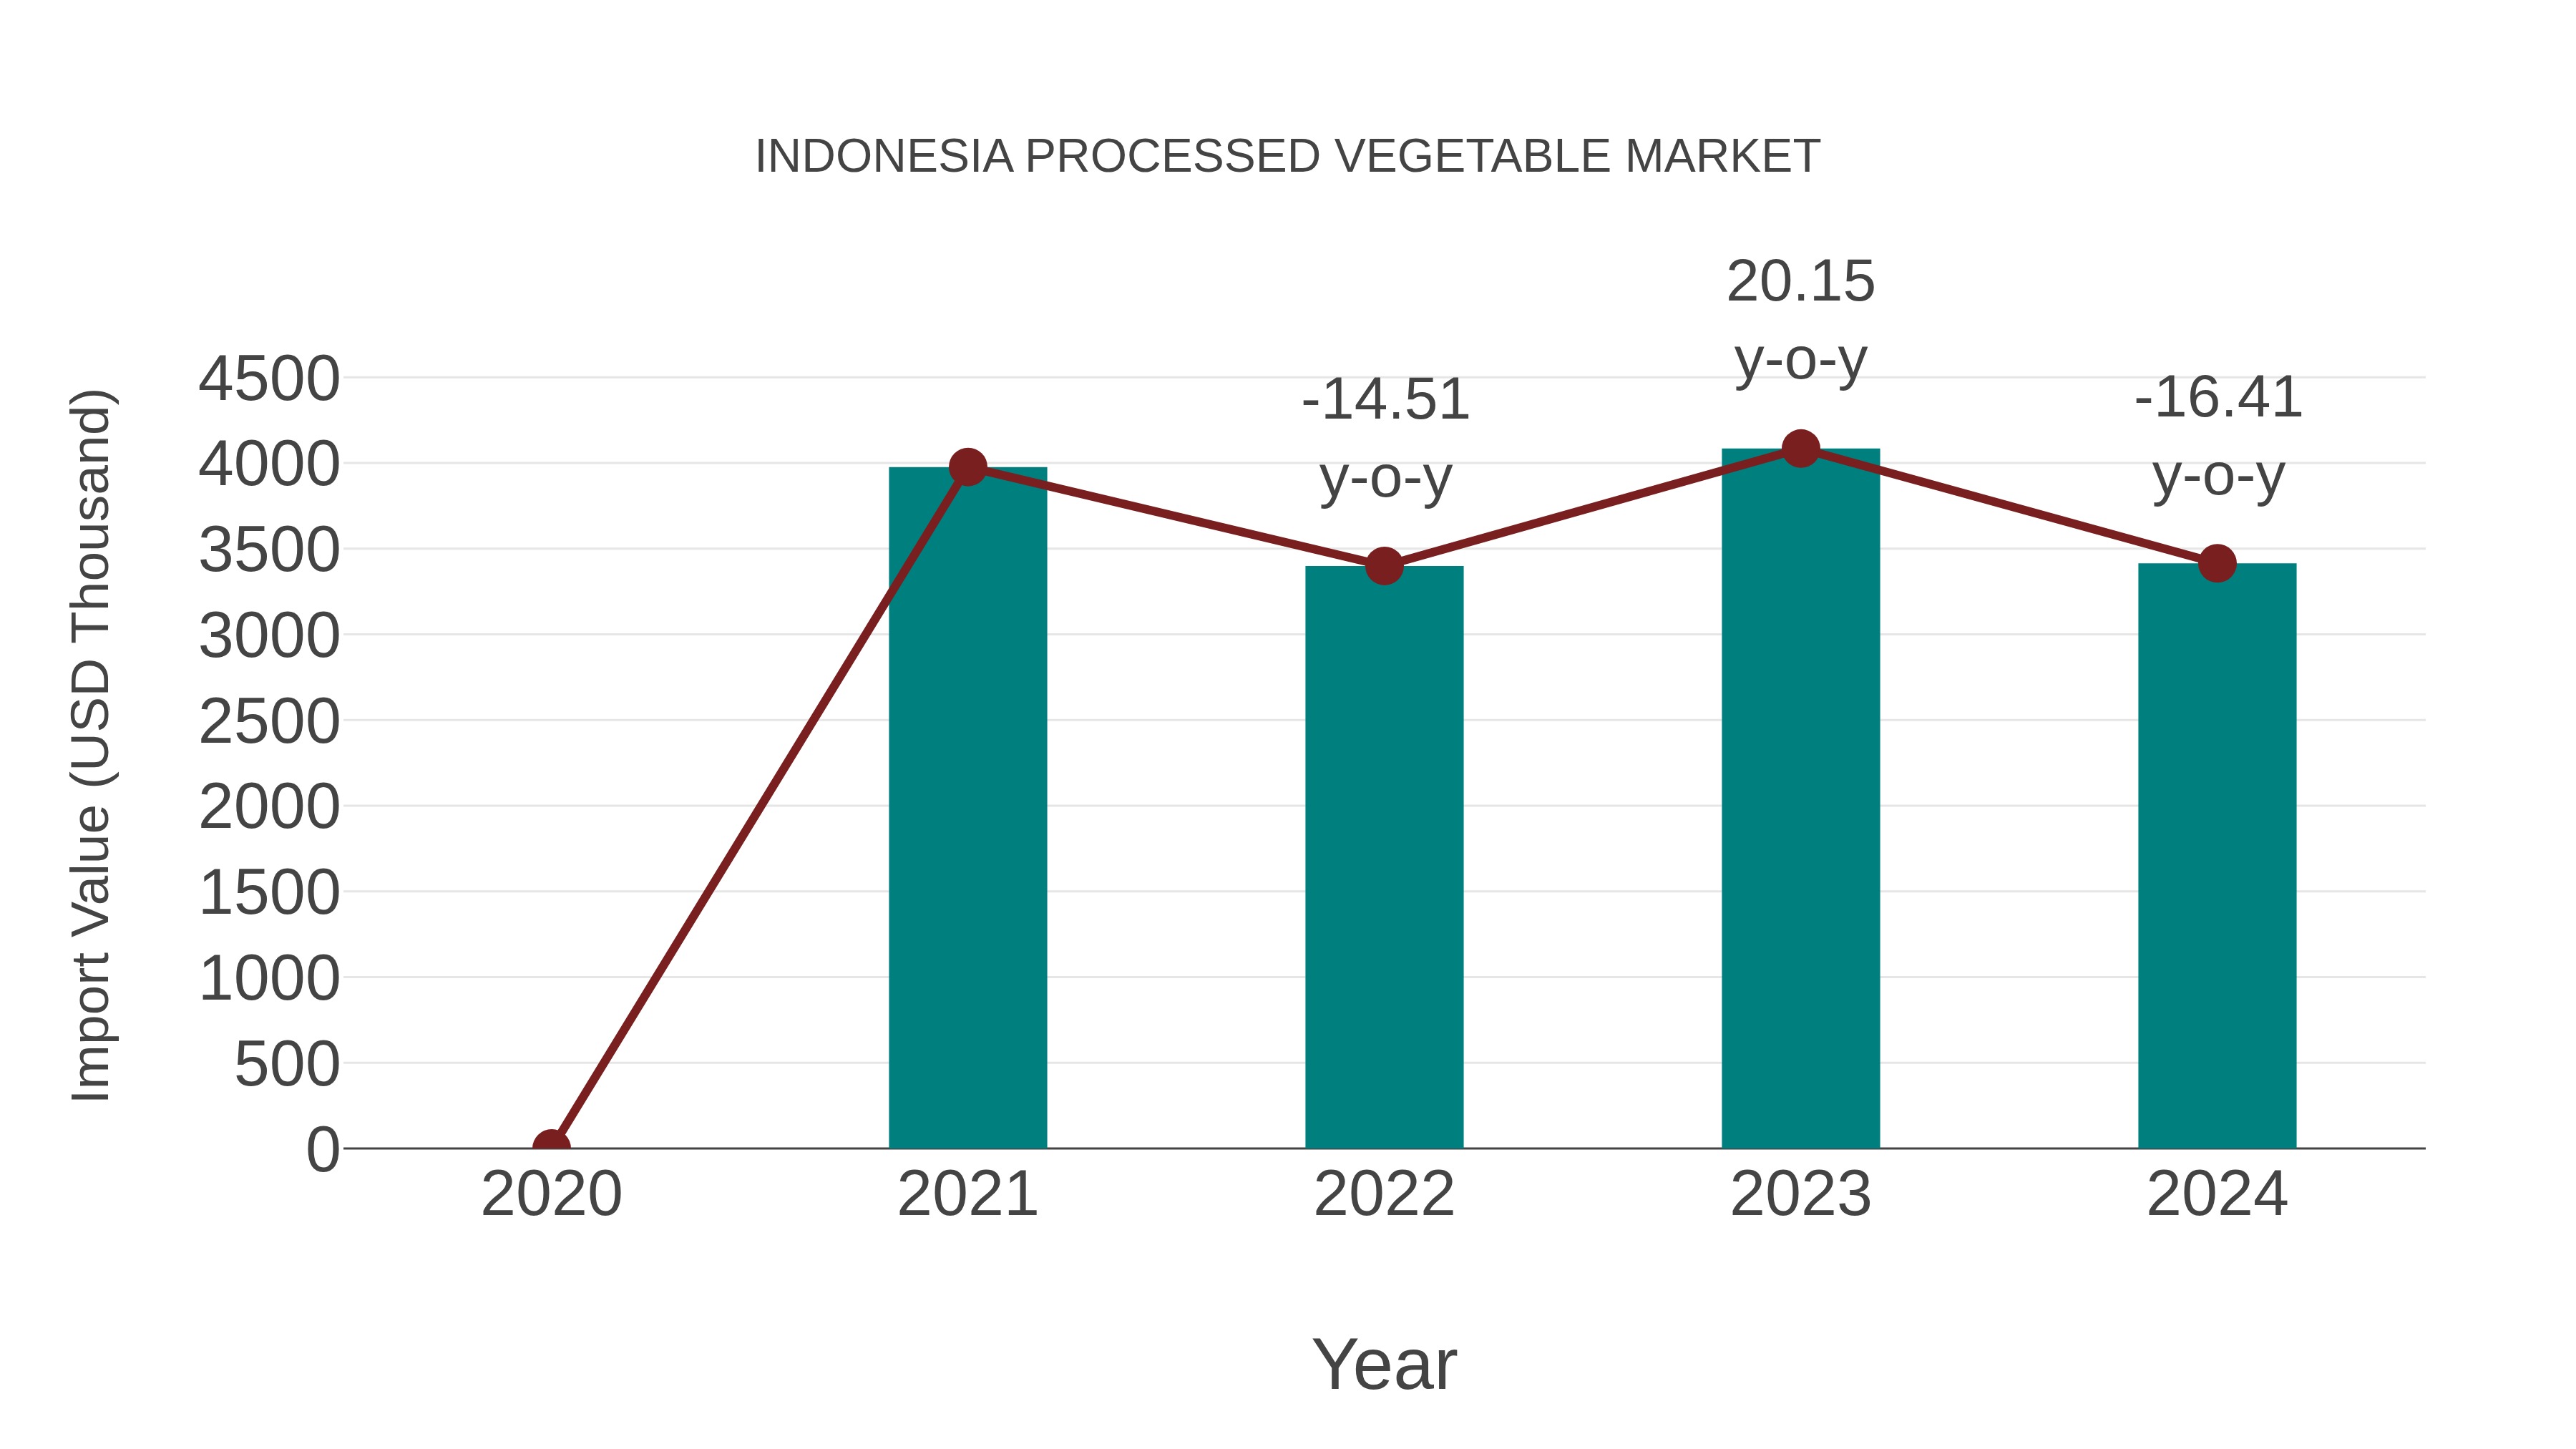
Indonesia Processed Vegetable Market: Import Trend Analysis
In 2024, Indonesia`s processed vegetable market experienced a -16.41% decrease in import growth compared to the previous year, with a compound annual growth rate (CAGR) of -4.95% from 2020 to 2024. This decline may be attributed to shifts in consumer preferences towards fresh produce, impacting import momentum in the processed vegetable sector.
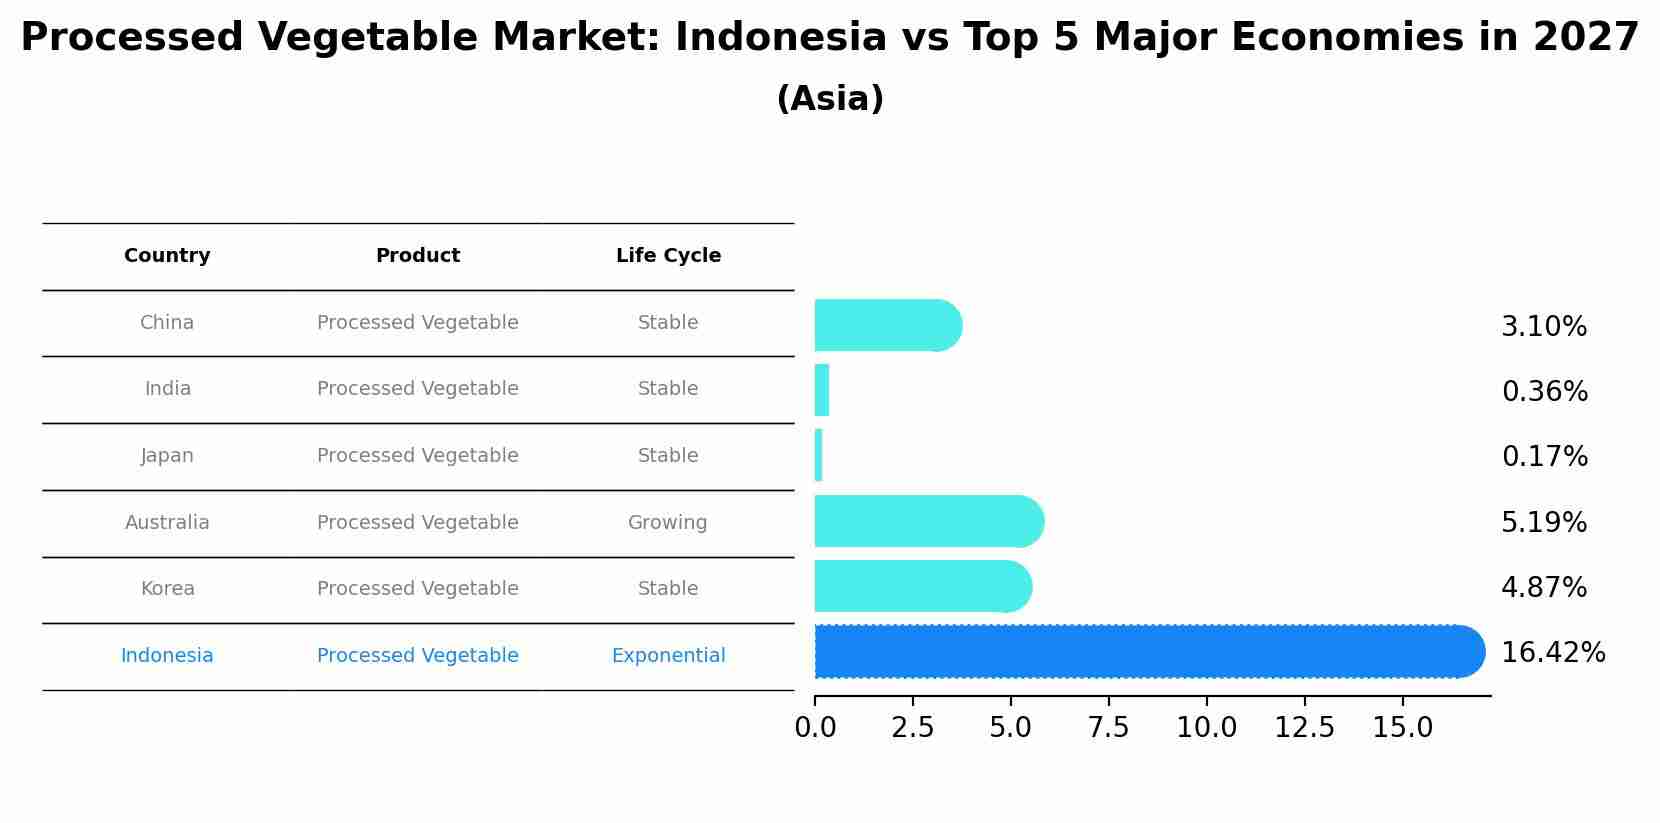
Processed Vegetable Market: Indonesia vs Top 5 Major Economies in 2027 (Asia)
Indonesia's Processed Vegetable market is anticipated to experience a exponential growth rate of 16.42% by 2027, reflecting trends observed in the largest economy China, followed by India, Japan, Australia and South Korea.
Indonesia Processed Vegetable Market Synopsis
Indonesia is the largest producer and consumer of processed vegetables in Southeast Asia. The country?s large population increasing disposable incomes changing dietary habits and rising preference for convenience foods are expected to drive demand during theperiod (2020-2026). Rising health consciousness among consumers has also resulted in increased consumption of ready-to-eat and healthy food products containing processed vegetables.
Key Factors Driving the Market
The major driver offor Indonesia`s processed vegetable market is the growing preference among consumers for convenience foods. With busy lifestyles more people are turning towards ready-to-eat meals that use a variety of ingredients including processed vegetables. This trend has been further bolstered by rising health awareness as well as an increase in disposable income levels. Increasing urbanization across Indonesia is another key factor driving marketas it increases accessibility to these products and boosts their affordability among households with low or moderate income levels.
Challenges Facing the Market
High prices due to high production costs associated with processing fresh produce into canned or frozen form can be a challenge for some players within theoperating at small scale level who may find it difficult to compete with largerwith greater economies of scale when it comes to pricing their products competitively against mass produced items . Additionally volatile raw material prices can cause issues regarding supply chain management and create fluctuations in terms of input cost which could have an effect on profit margins . Moreoverstringent regulations imposed by government bodies concerning food safety standards can be an additional burden onparticipants who need to comply with such requirements which could add up to their operational expenses .
Key Market Players
Major players operating in the Indonesia Processed Vegetable Market include CP Prima Tbk. Mayora Indah Tbk. PT Sierad Produce Tbk. GarudaFood GroupAyam Brand Company Ltd. Kraft Heinz Company Coorporations amongst others.
Key Highlights of the Report:
- Indonesia Processed Vegetable Market Outlook
- Market Size of Indonesia Processed Vegetable Market, 2023
- Forecast of Indonesia Processed Vegetable Market, 2030
- Historical Data and Forecast of Indonesia Processed Vegetable Revenues & Volume for the Period 2020-2030
- Indonesia Processed Vegetable Market Trend Evolution
- Indonesia Processed Vegetable Market Drivers and Challenges
- Indonesia Processed Vegetable Price Trends
- Indonesia Processed Vegetable Porter's Five Forces
- Indonesia Processed Vegetable Industry Life Cycle
- Historical Data and Forecast of Indonesia Processed Vegetable Market Revenues & Volume By Type for the Period 2020-2030
- Historical Data and Forecast of Indonesia Processed Vegetable Market Revenues & Volume By Canned Vegetable for the Period 2020-2030
- Historical Data and Forecast of Indonesia Processed Vegetable Market Revenues & Volume By Frozen Vegetable for the Period 2020-2030
- Historical Data and Forecast of Indonesia Processed Vegetable Market Revenues & Volume By Fresh- Cut Vegetable for the Period 2020-2030
- Historical Data and Forecast of Indonesia Processed Vegetable Market Revenues & Volume By Form for the Period 2020-2030
- Historical Data and Forecast of Indonesia Processed Vegetable Market Revenues & Volume By Powder for the Period 2020-2030
- Historical Data and Forecast of Indonesia Processed Vegetable Market Revenues & Volume By Granules for the Period 2020-2030
- Historical Data and Forecast of Indonesia Processed Vegetable Market Revenues & Volume By Others for the Period 2020-2030
- Historical Data and Forecast of Indonesia Processed Vegetable Market Revenues & Volume By Application for the Period 2020-2030
- Historical Data and Forecast of Indonesia Processed Vegetable Market Revenues & Volume By Family for the Period 2020-2030
- Historical Data and Forecast of Indonesia Processed Vegetable Market Revenues & Volume By Restaurant for the Period 2020-2030
- Historical Data and Forecast of Indonesia Processed Vegetable Market Revenues & Volume By Other for the Period 2020-2030
- Historical Data and Forecast of Indonesia Processed Vegetable Market Revenues & Volume By Processing Equipment for the Period 2020-2030
- Historical Data and Forecast of Indonesia Processed Vegetable Market Revenues & Volume By Pre-processing for the Period 2020-2030
- Historical Data and Forecast of Indonesia Processed Vegetable Market Revenues & Volume By Processing for the Period 2020-2030
- Historical Data and Forecast of Indonesia Processed Vegetable Market Revenues & Volume By Washing for the Period 2020-2030
- Historical Data and Forecast of Indonesia Processed Vegetable Market Revenues & Volume By Filling for the Period 2020-2030
- Historical Data and Forecast of Indonesia Processed Vegetable Market Revenues & Volume By Seasoning for the Period 2020-2030
- Historical Data and Forecast of Indonesia Processed Vegetable Market Revenues & Volume By Packaging for the Period 2020-2030
- Indonesia Processed Vegetable Import Export Trade Statistics
- Market Opportunity Assessment By Type
- Market Opportunity Assessment By Form
- Market Opportunity Assessment By Application
- Market Opportunity Assessment By Processing Equipment
- Indonesia Processed Vegetable Top Companies Market Share
- Indonesia Processed Vegetable Competitive Benchmarking By Technical and Operational Parameters
- Indonesia Processed Vegetable Company Profiles
- Indonesia Processed Vegetable Key Strategic Recommendations
Frequently Asked Questions About the Market Study (FAQs):
6Wresearch actively monitors the Indonesia Processed Vegetable Market and publishes its comprehensive annual report, highlighting emerging trends, growth drivers, revenue analysis, and forecast outlook. Our insights help businesses to make data-backed strategic decisions with ongoing market dynamics. Our analysts track relevent industries related to the Indonesia Processed Vegetable Market, allowing our clients with actionable intelligence and reliable forecasts tailored to emerging regional needs.
Yes, we provide customisation as per your requirements. To learn more, feel free to contact us on sales@6wresearch.com
1 Executive Summary |
2 Introduction |
2.1 Key Highlights of the Report |
2.2 Report Description |
2.3 Market Scope & Segmentation |
2.4 Research Methodology |
2.5 Assumptions |
3 Indonesia Processed Vegetable Market Overview |
3.1 Indonesia Country Macro Economic Indicators |
3.2 Indonesia Processed Vegetable Market Revenues & Volume, 2020 & 2030F |
3.3 Indonesia Processed Vegetable Market - Industry Life Cycle |
3.4 Indonesia Processed Vegetable Market - Porter's Five Forces |
3.5 Indonesia Processed Vegetable Market Revenues & Volume Share, By Type, 2020 & 2030F |
3.6 Indonesia Processed Vegetable Market Revenues & Volume Share, By Form, 2020 & 2030F |
3.7 Indonesia Processed Vegetable Market Revenues & Volume Share, By Application, 2020 & 2030F |
3.8 Indonesia Processed Vegetable Market Revenues & Volume Share, By Processing Equipment, 2020 & 2030F |
4 Indonesia Processed Vegetable Market Dynamics |
4.1 Impact Analysis |
4.2 Market Drivers |
4.2.1 Increasing consumer awareness towards health and wellness leading to a rise in demand for processed vegetables. |
4.2.2 Growth in the foodservice industry and changing dietary habits of the Indonesian population. |
4.2.3 Technological advancements in food processing leading to improved quality and shelf-life of processed vegetables. |
4.3 Market Restraints |
4.3.1 Seasonal variations in the availability of raw vegetables impacting the supply chain of processed vegetables. |
4.3.2 Price fluctuations of raw materials affecting the cost of production and pricing of processed vegetables. |
4.3.3 Competition from fresh vegetables and other convenience food products in the market. |
5 Indonesia Processed Vegetable Market Trends |
6 Indonesia Processed Vegetable Market, By Types |
6.1 Indonesia Processed Vegetable Market, By Type |
6.1.1 Overview and Analysis |
6.1.2 Indonesia Processed Vegetable Market Revenues & Volume, By Type, 2020-2030F |
6.1.3 Indonesia Processed Vegetable Market Revenues & Volume, By Canned Vegetable, 2020-2030F |
6.1.4 Indonesia Processed Vegetable Market Revenues & Volume, By Frozen Vegetable, 2020-2030F |
6.1.5 Indonesia Processed Vegetable Market Revenues & Volume, By Fresh- Cut Vegetable, 2020-2030F |
6.2 Indonesia Processed Vegetable Market, By Form |
6.2.1 Overview and Analysis |
6.2.2 Indonesia Processed Vegetable Market Revenues & Volume, By Powder, 2020-2030F |
6.2.3 Indonesia Processed Vegetable Market Revenues & Volume, By Granules, 2020-2030F |
6.2.4 Indonesia Processed Vegetable Market Revenues & Volume, By Others, 2020-2030F |
6.3 Indonesia Processed Vegetable Market, By Application |
6.3.1 Overview and Analysis |
6.3.2 Indonesia Processed Vegetable Market Revenues & Volume, By Family, 2020-2030F |
6.3.3 Indonesia Processed Vegetable Market Revenues & Volume, By Restaurant, 2020-2030F |
6.3.4 Indonesia Processed Vegetable Market Revenues & Volume, By Other, 2020-2030F |
6.4 Indonesia Processed Vegetable Market, By Processing Equipment |
6.4.1 Overview and Analysis |
6.4.2 Indonesia Processed Vegetable Market Revenues & Volume, By Pre-processing, 2020-2030F |
6.4.3 Indonesia Processed Vegetable Market Revenues & Volume, By Processing, 2020-2030F |
6.4.4 Indonesia Processed Vegetable Market Revenues & Volume, By Washing, 2020-2030F |
6.4.5 Indonesia Processed Vegetable Market Revenues & Volume, By Filling, 2020-2030F |
6.4.6 Indonesia Processed Vegetable Market Revenues & Volume, By Seasoning, 2020-2030F |
6.4.7 Indonesia Processed Vegetable Market Revenues & Volume, By Packaging, 2020-2030F |
7 Indonesia Processed Vegetable Market Import-Export Trade Statistics |
7.1 Indonesia Processed Vegetable Market Export to Major Countries |
7.2 Indonesia Processed Vegetable Market Imports from Major Countries |
8 Indonesia Processed Vegetable Market Key Performance Indicators |
8.1 Percentage of repeat purchases by consumers. |
8.2 Rate of new product development and innovation in processed vegetable offerings. |
8.3 Average processing time from farm to table for processed vegetables. |
9 Indonesia Processed Vegetable Market - Opportunity Assessment |
9.1 Indonesia Processed Vegetable Market Opportunity Assessment, By Type, 2020 & 2030F |
9.2 Indonesia Processed Vegetable Market Opportunity Assessment, By Form, 2020 & 2030F |
9.3 Indonesia Processed Vegetable Market Opportunity Assessment, By Application, 2020 & 2030F |
9.4 Indonesia Processed Vegetable Market Opportunity Assessment, By Processing Equipment, 2020 & 2030F |
10 Indonesia Processed Vegetable Market - Competitive Landscape |
10.1 Indonesia Processed Vegetable Market Revenue Share, By Companies, 2023 |
10.2 Indonesia Processed Vegetable Market Competitive Benchmarking, By Operating and Technical Parameters |
11 Company Profiles |
12 Recommendations |
13 Disclaimer |
Export potential assessment - trade Analytics for 2030
Export potential enables firms to identify high-growth global markets with greater confidence by combining advanced trade intelligence with a structured quantitative methodology. The framework analyzes emerging demand trends and country-level import patterns while integrating macroeconomic and trade datasets such as GDP and population forecasts, bilateral import–export flows, tariff structures, elasticity differentials between developed and developing economies, geographic distance, and import demand projections. Using weighted trade values from 2020–2024 as the base period to project country-to-country export potential for 2030, these inputs are operationalized through calculated drivers such as gravity model parameters, tariff impact factors, and projected GDP per-capita growth. Through an analysis of hidden potentials, demand hotspots, and market conditions that are most favorable to success, this method enables firms to focus on target countries, maximize returns, and global expansion with data, backed by accuracy.
By factoring in the projected importer demand gap that is currently unmet and could be potential opportunity, it identifies the potential for the Exporter (Country) among 190 countries, against the general trade analysis, which identifies the biggest importer or exporter.
To discover high-growth global markets and optimize your business strategy:
Click Here
Pricing
- Single User License$ 1,995
- Department License$ 2,400
- Site License$ 3,120
- Global License$ 3,795

Search
Thought Leadership and Analyst Meet


Our Clients
Related Reports
- Sri Lanka Packaging Market (2026-2032) | Outlook, Competition, Drivers, Trends, Demand, Pricing Analysis, Competitive, Strategic Insights, Companies, Challenges, Strategy, Consumer Insights, Analysis, Investment Trends, Opportunities, Growth, Size, Share, Industry, Revenue, Segments, Value, Segmentation, Supply, Forecast, Restraints
- India Kids Watches Market (2026-2032) | Strategy, Consumer Insights, Analysis, Investment Trends, Opportunities, Growth, Size, Share, Industry, Revenue, Segments, Value, Segmentation, Supply, Forecast, Restraints, Outlook, Competition, Drivers, Trends, Demand, Pricing Analysis, Competitive, Strategic Insights, Companies, Challenges
- Saudi Arabia Core Assurance Service Market (2025-2031) | Strategy, Consumer Insights, Analysis, Investment Trends, Opportunities, Growth, Size, Share, Industry, Revenue, Segments, Value, Segmentation, Supply, Forecast, Restraints, Outlook, Competition, Drivers, Trends, Demand, Pricing Analysis, Competitive, Strategic Insights, Companies, Challenges
- Romania Uninterruptible Power Supply (UPS) Market (2026-2032) | Industry, Analysis, Revenue, Size, Forecast, Outlook, Value, Trends, Share, Growth & Companies
- Saudi Arabia Car Window Tinting Film, Paint Protection Film (PPF), and Ceramic Coating Market (2025-2031) | Strategy, Consumer Insights, Analysis, Investment Trends, Opportunities, Growth, Size, Share, Industry, Revenue, Segments, Value, Segmentation, Supply, Forecast, Restraints, Outlook, Competition, Drivers, Trends, Demand, Pricing Analysis, Competitive, Strategic Insights, Companies, Challenges
- South Africa Stationery Market (2025-2031) | Share, Size, Industry, Value, Growth, Revenue, Analysis, Trends, Segmentation & Outlook
- Afghanistan Rocking Chairs And Adirondack Chairs Market (2026-2032) | Size & Revenue, Competitive Landscape, Share, Segmentation, Industry, Value, Outlook, Analysis, Trends, Growth, Forecast, Companies
- Afghanistan Apparel Market (2026-2032) | Growth, Outlook, Industry, Segmentation, Forecast, Size, Companies, Trends, Value, Share, Analysis & Revenue
- Canada Oil and Gas Market (2026-2032) | Share, Segmentation, Value, Industry, Trends, Forecast, Analysis, Size & Revenue, Growth, Competitive Landscape, Outlook, Companies
- Germany Breakfast Food Market (2026-2032) | Industry, Share, Growth, Size, Companies, Value, Analysis, Revenue, Trends, Forecast & Outlook
Industry Events and Analyst Meet

Smart Production Solutions Guangzhou 2026

Stationery & Paper Expo Saudi Arabia 2026

Kids & Toys Expo Saudi Arabia 2026

Gifts & Homeware Expo Saudi Arabia 2026

Smart Home Expo 2026
Whitepaper
- Middle East & Africa Commercial Security Market Click here to view more.
- Middle East & Africa Fire Safety Systems & Equipment Market Click here to view more.
- GCC Drone Market Click here to view more.
- Middle East Lighting Fixture Market Click here to view more.
- GCC Physical & Perimeter Security Market Click here to view more.
6WResearch In News
- Doha a strategic location for EV manufacturing hub: IPA Qatar
- Demand for luxury TVs surging in the GCC, says Samsung
- Empowering Growth: The Thriving Journey of Bangladesh’s Cable Industry
- Demand for luxury TVs surging in the GCC, says Samsung
- Video call with a traditional healer? Once unthinkable, it’s now common in South Africa
- Intelligent Buildings To Smooth GCC’s Path To Net Zero