Japan Dietary Supplements Market (2020-2026) | COVID-19 IMPACT, Trends, Outlook, Companies, Analysis, Size, Industry, Forecast, Revenue, Growth, Value & Share
Market Forecast By Ingredient (Vitamins, Botanicals, Minerals, Proteins & Amino Acids, Fibers & Specialty Carbohydrates, Omega Fatty Acids, Others), By Form (Tablets, Capsules, Soft gels, Powders, Gummies, Liquids, Others), By Application (Energy & Weight Management, General Health, Bone & Joint Health, Gastrointestinal Health, Immunity, Cardiac Health, Diabetes, Others), By End user (Adults, Geriatric, Pregnant Women, Children, Infants), By Distribution Channel (OTC, Prescribed) And Competitive Landscape
| Product Code: ETC010002 | Publication Date: Oct 2020 | Updated Date: Oct 2025 | Product Type: Report | |
| Publisher: 6Wresearch | Author: Ravi Bhandari | No. of Pages: 70 | No. of Figures: 35 | No. of Tables: 5 |
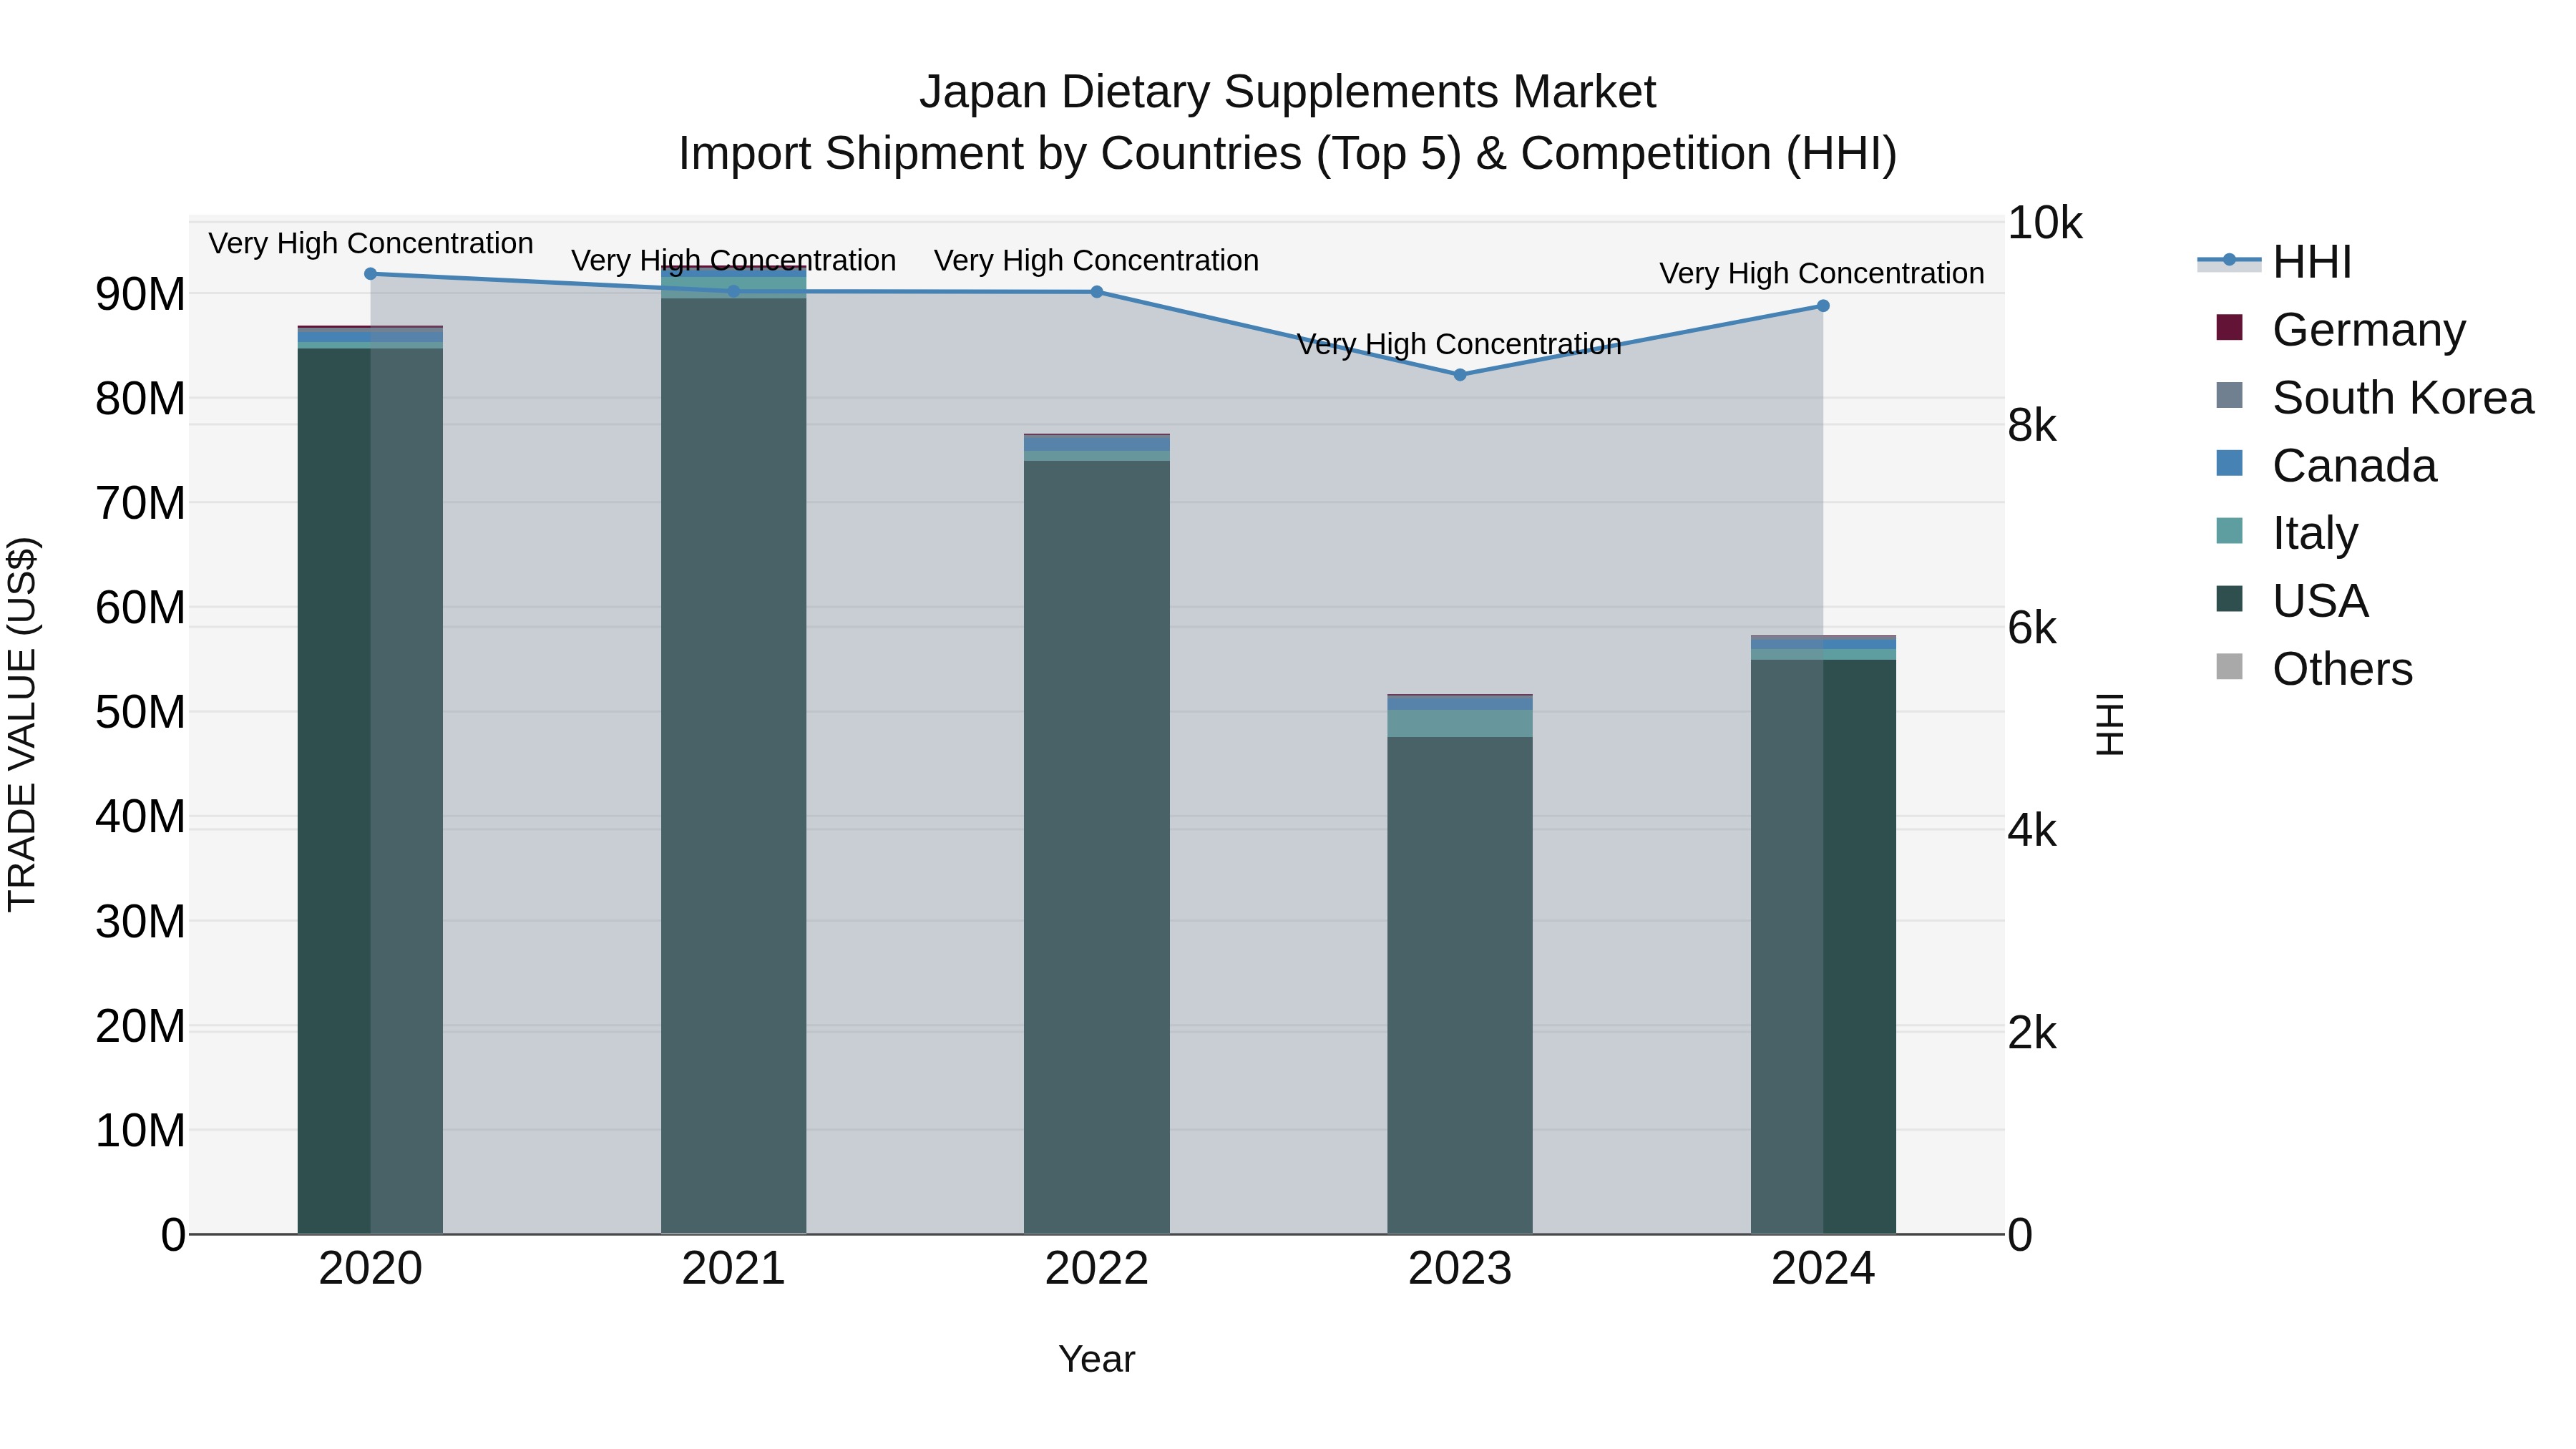
Japan Dietary Supplements Market Import Shipment by Countries (Top 5) & Competition (HHI)
Despite a declining CAGR from 2020 to 2024, the Japan dietary supplements import market experienced a notable growth rate of 10.94% in 2024, signaling a potential resurgence. The high concentration level indicated by the HHI suggests a competitive landscape dominated by the top exporting countries such as the USA, Italy, Canada, South Korea, and Germany. This highlights the importance of innovation and strategic partnerships within the industry to capitalize on emerging opportunities in the Japanese market.
Japan Dietary Supplements Market | Country-Wise Share and Competition Analysis
In the year 2021, Ireland was the largest exporter in terms of value, followed by Vietnam. It has registered a growth of 15.6% over the previous year. While Vietnam registered a decline of -40.34% as compare to the previous year. In the year 2017 Ireland was the largest exporter followed by Vietnam. In term of Herfindahl Index, which measures the competitiveness of countries exporting, Japan has the Herfindahl index of 3162 in 2017 which signifies high concentration also in 2021 it registered a Herfindahl index of 4006 which signifies high concentration in the market.

Japan Dietary Supplements Market - Export Market Opportunities

Key Highlights of the Report:
- Japan Dietary Supplements Market Outlook
- Market Size of Japan Dietary Supplements Market, 2019
- Forecast of Japan Dietary Supplements Market, 2026
- Historical Data and Forecast of Japan Dietary Supplements Revenues & Volume for the Period 2016 - 2026
- Japan Dietary Supplements Market Trend Evolution
- Japan Dietary Supplements Market Drivers and Challenges
- Japan Dietary Supplements Price Trends
- Japan Dietary Supplements Porter's Five Forces
- Japan Dietary Supplements Industry Life Cycle
- Historical Data and Forecast of Japan Dietary Supplements Market Revenues & Volume By Ingredient? for the Period 2016 - 2026
- Historical Data and Forecast of Japan Dietary Supplements Market Revenues & Volume By Vitamins for the Period 2016 - 2026
- Historical Data and Forecast of Japan Dietary Supplements Market Revenues & Volume By Botanicals for the Period 2016 - 2026
- Historical Data and Forecast of Japan Dietary Supplements Market Revenues & Volume By Minerals for the Period 2016 - 2026
- Historical Data and Forecast of Japan Dietary Supplements Market Revenues & Volume By Proteins & Amino Acids for the Period 2016 - 2026
- Historical Data and Forecast of Japan Dietary Supplements Market Revenues & Volume By Fibers & Specialty Carbohydrates for the Period 2016 - 2026
- Historical Data and Forecast of Japan Dietary Supplements Market Revenues & Volume By Omega Fatty Acids for the Period 2016 - 2026
- Historical Data and Forecast of Japan Dietary Supplements Market Revenues & Volume By Others for the Period 2016 - 2026
- Historical Data and Forecast of Japan Dietary Supplements Market Revenues & Volume By Form? for the Period 2016 - 2026
- Historical Data and Forecast of Japan Dietary Supplements Market Revenues & Volume By Tablets for the Period 2016 - 2026
- Historical Data and Forecast of Japan Dietary Supplements Market Revenues & Volume By Capsules for the Period 2016 - 2026
- Historical Data and Forecast of Japan Dietary Supplements Market Revenues & Volume By Soft gels for the Period 2016 - 2026
- Historical Data and Forecast of Japan Dietary Supplements Market Revenues & Volume By Powders for the Period 2016 - 2026
- Historical Data and Forecast of Japan Dietary Supplements Market Revenues & Volume By Gummies for the Period 2016 - 2026
- Historical Data and Forecast of Japan Dietary Supplements Market Revenues & Volume By Liquids for the Period 2016 - 2026
- Historical Data and Forecast of Japan Dietary Supplements Market Revenues & Volume By Others for the Period 2016 - 2026
- Historical Data and Forecast of Japan Dietary Supplements Market Revenues & Volume By Application? for the Period 2016 - 2026
- Historical Data and Forecast of Japan Dietary Supplements Market Revenues & Volume By Energy & Weight Management for the Period 2016 - 2026
- Historical Data and Forecast of Japan Dietary Supplements Market Revenues & Volume By General Health for the Period 2016 - 2026
- Historical Data and Forecast of Japan Dietary Supplements Market Revenues & Volume By Bone & Joint Health for the Period 2016 - 2026
- Historical Data and Forecast of Japan Dietary Supplements Market Revenues & Volume By Gastrointestinal Health for the Period 2016 - 2026
- Historical Data and Forecast of Japan Dietary Supplements Market Revenues & Volume By Immunity for the Period 2016 - 2026
- Historical Data and Forecast of Japan Dietary Supplements Market Revenues & Volume By Cardiac Health for the Period 2016 - 2026
- Historical Data and Forecast of Japan Dietary Supplements Market Revenues & Volume By Diabetes for the Period 2016 - 2026
- Historical Data and Forecast of Japan Dietary Supplements Market Revenues & Volume By Others for the Period 2016 - 2026
- Historical Data and Forecast of Japan Dietary Supplements Market Revenues & Volume By End user for the Period 2016 - 2026
- Historical Data and Forecast of Japan Dietary Supplements Market Revenues & Volume By Adults for the Period 2016 - 2026
- Historical Data and Forecast of Japan Dietary Supplements Market Revenues & Volume By Geriatric for the Period 2016 - 2026
- Historical Data and Forecast of Japan Dietary Supplements Market Revenues & Volume By Pregnant Women for the Period 2016 - 2026
- Historical Data and Forecast of Japan Dietary Supplements Market Revenues & Volume By Children for the Period 2016 - 2026
- Historical Data and Forecast of Japan Dietary Supplements Market Revenues & Volume By Infants for the Period 2016 - 2026
- Historical Data and Forecast of Japan Dietary Supplements Market Revenues & Volume By Distribution Channel for the Period 2016 - 2026
- Historical Data and Forecast of Japan Dietary Supplements Market Revenues & Volume By OTC for the Period 2016 - 2026
- Historical Data and Forecast of Japan Dietary Supplements Market Revenues & Volume By Prescribed for the Period 2016 - 2026
- Japan Dietary Supplements Import Export Trade Statistics
- Market Opportunity Assessment By Ingredient?
- Market Opportunity Assessment By Form?
- Market Opportunity Assessment By Application?
- Market Opportunity Assessment By End user
- Market Opportunity Assessment By Distribution Channel
- Japan Dietary Supplements Top Companies Market Share
- Japan Dietary Supplements Competitive Benchmarking By Technical and Operational Parameters
- Japan Dietary Supplements Company Profiles
- Japan Dietary Supplements Key Strategic Recommendations
Frequently Asked Questions About the Market Study (FAQs):
6Wresearch actively monitors the Japan Dietary Supplements Market and publishes its comprehensive annual report, highlighting emerging trends, growth drivers, revenue analysis, and forecast outlook. Our insights help businesses to make data-backed strategic decisions with ongoing market dynamics. Our analysts track relevent industries related to the Japan Dietary Supplements Market, allowing our clients with actionable intelligence and reliable forecasts tailored to emerging regional needs.
Yes, we provide customisation as per your requirements. To learn more, feel free to contact us on sales@6wresearch.com
|
1 Executive Summary |
|
2 Introduction |
|
2.1 Key Highlights of the Report |
|
2.2 Report Description |
|
2.3 Market Scope & Segmentation |
|
2.4 Research Methodology |
|
2.5 Assumptions |
|
3 Japan Dietary Supplements Market Overview |
|
3.1 Japan Country Macro Economic Indicators |
|
3.2 Japan Dietary Supplements Market Revenues & Volume, 2019 & 2026F |
|
3.3 Japan Dietary Supplements Market - Industry Life Cycle |
|
3.4 Japan Dietary Supplements Market - Porter's Five Forces |
|
3.5 Japan Dietary Supplements Market Revenues & Volume Share, By Ingredient , 2019 & 2026F |
|
3.6 Japan Dietary Supplements Market Revenues & Volume Share, By Form , 2019 & 2026F |
|
3.7 Japan Dietary Supplements Market Revenues & Volume Share, By Application , 2019 & 2026F |
|
3.8 Japan Dietary Supplements Market Revenues & Volume Share, By End user, 2019 & 2026F |
|
3.9 Japan Dietary Supplements Market Revenues & Volume Share, By Distribution Channel, 2019 & 2026F |
|
4 Japan Dietary Supplements Market Dynamics |
|
4.1 Impact Analysis |
|
4.2 Market Drivers |
|
4.2.1 Increasing health awareness and focus on preventive healthcare among Japanese consumers |
|
4.2.2 Growing aging population in Japan with a higher demand for dietary supplements for overall well-being |
|
4.2.3 Adoption of Western dietary habits leading to a rise in lifestyle-related health issues |
|
4.3 Market Restraints |
|
4.3.1 Stringent regulations and approval processes for dietary supplements in Japan |
|
4.3.2 Cultural preferences for natural remedies and traditional medicines over dietary supplements |
|
4.3.3 Competition from traditional food products fortified with nutrients impacting the market growth |
|
5 Japan Dietary Supplements Market Trends |
|
6 Japan Dietary Supplements Market, By Types |
|
6.1 Japan Dietary Supplements Market, By Ingredient |
|
6.1.1 Overview and Analysis |
|
6.1.2 Japan Dietary Supplements Market Revenues & Volume, By Ingredient , 2016 - 2026F |
|
6.1.3 Japan Dietary Supplements Market Revenues & Volume, By Vitamins, 2016 - 2026F |
|
6.1.4 Japan Dietary Supplements Market Revenues & Volume, By Botanicals, 2016 - 2026F |
|
6.1.5 Japan Dietary Supplements Market Revenues & Volume, By Minerals, 2016 - 2026F |
|
6.1.6 Japan Dietary Supplements Market Revenues & Volume, By Proteins & Amino Acids, 2016 - 2026F |
|
6.1.7 Japan Dietary Supplements Market Revenues & Volume, By Fibers & Specialty Carbohydrates, 2016 - 2026F |
|
6.1.8 Japan Dietary Supplements Market Revenues & Volume, By Omega Fatty Acids, 2016 - 2026F |
|
6.2 Japan Dietary Supplements Market, By Form |
|
6.2.1 Overview and Analysis |
|
6.2.2 Japan Dietary Supplements Market Revenues & Volume, By Tablets, 2016 - 2026F |
|
6.2.3 Japan Dietary Supplements Market Revenues & Volume, By Capsules, 2016 - 2026F |
|
6.2.4 Japan Dietary Supplements Market Revenues & Volume, By Soft gels, 2016 - 2026F |
|
6.2.5 Japan Dietary Supplements Market Revenues & Volume, By Powders, 2016 - 2026F |
|
6.2.6 Japan Dietary Supplements Market Revenues & Volume, By Gummies, 2016 - 2026F |
|
6.2.7 Japan Dietary Supplements Market Revenues & Volume, By Liquids, 2016 - 2026F |
|
6.3 Japan Dietary Supplements Market, By Application |
|
6.3.1 Overview and Analysis |
|
6.3.2 Japan Dietary Supplements Market Revenues & Volume, By Energy & Weight Management, 2016 - 2026F |
|
6.3.3 Japan Dietary Supplements Market Revenues & Volume, By General Health, 2016 - 2026F |
|
6.3.4 Japan Dietary Supplements Market Revenues & Volume, By Bone & Joint Health, 2016 - 2026F |
|
6.3.5 Japan Dietary Supplements Market Revenues & Volume, By Gastrointestinal Health, 2016 - 2026F |
|
6.3.6 Japan Dietary Supplements Market Revenues & Volume, By Immunity, 2016 - 2026F |
|
6.3.7 Japan Dietary Supplements Market Revenues & Volume, By Cardiac Health, 2016 - 2026F |
|
6.3.8 Japan Dietary Supplements Market Revenues & Volume, By Others, 2016 - 2026F |
|
6.3.9 Japan Dietary Supplements Market Revenues & Volume, By Others, 2016 - 2026F |
|
6.4 Japan Dietary Supplements Market, By End user |
|
6.4.1 Overview and Analysis |
|
6.4.2 Japan Dietary Supplements Market Revenues & Volume, By Adults, 2016 - 2026F |
|
6.4.3 Japan Dietary Supplements Market Revenues & Volume, By Geriatric, 2016 - 2026F |
|
6.4.4 Japan Dietary Supplements Market Revenues & Volume, By Pregnant Women, 2016 - 2026F |
|
6.4.5 Japan Dietary Supplements Market Revenues & Volume, By Children, 2016 - 2026F |
|
6.4.6 Japan Dietary Supplements Market Revenues & Volume, By Infants, 2016 - 2026F |
|
6.5 Japan Dietary Supplements Market, By Distribution Channel |
|
6.5.1 Overview and Analysis |
|
6.5.2 Japan Dietary Supplements Market Revenues & Volume, By OTC, 2016 - 2026F |
|
6.5.3 Japan Dietary Supplements Market Revenues & Volume, By Prescribed, 2016 - 2026F |
|
7 Japan Dietary Supplements Market Import-Export Trade Statistics |
|
7.1 Japan Dietary Supplements Market Export to Major Countries |
|
7.2 Japan Dietary Supplements Market Imports from Major Countries |
|
8 Japan Dietary Supplements Market Key Performance Indicators |
8.1 Consumer awareness and perception of dietary supplements |
8.2 Number of new product launches and innovations in the dietary supplement market |
8.3 Adoption rate of dietary supplements among different age groups in Japan |
|
9 Japan Dietary Supplements Market - Opportunity Assessment |
|
9.1 Japan Dietary Supplements Market Opportunity Assessment, By Ingredient , 2019 & 2026F |
|
9.2 Japan Dietary Supplements Market Opportunity Assessment, By Form , 2019 & 2026F |
|
9.3 Japan Dietary Supplements Market Opportunity Assessment, By Application , 2019 & 2026F |
|
9.4 Japan Dietary Supplements Market Opportunity Assessment, By End user, 2019 & 2026F |
|
9.5 Japan Dietary Supplements Market Opportunity Assessment, By Distribution Channel, 2019 & 2026F |
|
10 Japan Dietary Supplements Market - Competitive Landscape |
|
10.1 Japan Dietary Supplements Market Revenue Share, By Companies, 2019 |
|
10.2 Japan Dietary Supplements Market Competitive Benchmarking, By Operating and Technical Parameters |
|
11 Company Profiles |
|
12 Recommendations |
|
13 Disclaimer |
Export potential assessment - trade Analytics for 2030
Export potential enables firms to identify high-growth global markets with greater confidence by combining advanced trade intelligence with a structured quantitative methodology. The framework analyzes emerging demand trends and country-level import patterns while integrating macroeconomic and trade datasets such as GDP and population forecasts, bilateral import–export flows, tariff structures, elasticity differentials between developed and developing economies, geographic distance, and import demand projections. Using weighted trade values from 2020–2024 as the base period to project country-to-country export potential for 2030, these inputs are operationalized through calculated drivers such as gravity model parameters, tariff impact factors, and projected GDP per-capita growth. Through an analysis of hidden potentials, demand hotspots, and market conditions that are most favorable to success, this method enables firms to focus on target countries, maximize returns, and global expansion with data, backed by accuracy.
By factoring in the projected importer demand gap that is currently unmet and could be potential opportunity, it identifies the potential for the Exporter (Country) among 190 countries, against the general trade analysis, which identifies the biggest importer or exporter.
To discover high-growth global markets and optimize your business strategy:
Click Here
Pricing
- Single User License$ 1,995
- Department License$ 2,400
- Site License$ 3,120
- Global License$ 3,795

Search
Thought Leadership and Analyst Meet


Our Clients
Latest Reports
- Canada Cloud CFD Market (2026-2032) | Size & Revenue, Industry, Growth, Competitive Landscape, Forecast, Segmentation, Value, Outlook, Trends, Share, Analysis, Companies
- Taiwan Food Delivery Platform Market (2026-2032) | Companies, Outlook, Analysis, Trends, Value, Revenue, Segmentation, Share, Forecast, Competitive Landscape, Growth, Size & Forecast
- United Kingdom (UK) Long-term Care Insurance Market (2026-2032) | Growth, Share, Consumer Insights, Drivers, Opportunities, Competition, Pricing Analysis, Segments, Restraints, Companies, Competitive, Value, Outlook, Size, Demand, Analysis, Challenges, Strategic Insights, Investment Trends, Revenue, Trends, Supply, Forecast
- United Kingdom (UK) Long Term Care Market (2026-2032) | Companies, Outlook, Analysis, Trends, Value, Revenue, Segmentation, Share, Forecast, Competitive Landscape, Growth, Size & Forecast
- Iraq Insulation and Waterproofing Market (2026-2032) | Outlook, Drivers, Growth, Size, Share, Industry, Revenue, Trends, Demand, Competitive, Strategic Insights, Opportunities, Segments, Companies, Challenges, Strategy, Consumer Insights, Analysis, Investment Trends, Value, Segmentation, Forecast, Restraints
- India Switchgear Market Outlook (2026-2032) | Size, Share, Trends, Growth, Revenue, Forecast, Analysis, Value, Outlook
- Pakistan Contraceptive Implants Market (2025-2031) | Demand, Growth, Size, Share, Industry, Pricing Analysis, Competitive, Strategic Insights, Strategy, Consumer Insights, Analysis, Investment Trends, Opportunities, Revenue, Segments, Value, Segmentation, Supply, Forecast, Restraints, Outlook, Competition, Drivers, Trends, Companies, Challenges
- Sri Lanka Packaging Market (2026-2032) | Outlook, Competition, Drivers, Trends, Demand, Pricing Analysis, Competitive, Strategic Insights, Companies, Challenges, Strategy, Consumer Insights, Analysis, Investment Trends, Opportunities, Growth, Size, Share, Industry, Revenue, Segments, Value, Segmentation, Supply, Forecast, Restraints
- India Kids Watches Market (2026-2032) | Strategy, Consumer Insights, Analysis, Investment Trends, Opportunities, Growth, Size, Share, Industry, Revenue, Segments, Value, Segmentation, Supply, Forecast, Restraints, Outlook, Competition, Drivers, Trends, Demand, Pricing Analysis, Competitive, Strategic Insights, Companies, Challenges
- Saudi Arabia Core Assurance Service Market (2025-2031) | Strategy, Consumer Insights, Analysis, Investment Trends, Opportunities, Growth, Size, Share, Industry, Revenue, Segments, Value, Segmentation, Supply, Forecast, Restraints, Outlook, Competition, Drivers, Trends, Demand, Pricing Analysis, Competitive, Strategic Insights, Companies, Challenges
Industry Events and Analyst Meet

India EV Show 2026

EV tech India Expo 2026

Auto Tech Asia 2026

Battery Tech India 2026

Smart Production Solutions Guangzhou 2026
Whitepaper
- Middle East & Africa Commercial Security Market Click here to view more.
- Middle East & Africa Fire Safety Systems & Equipment Market Click here to view more.
- GCC Drone Market Click here to view more.
- Middle East Lighting Fixture Market Click here to view more.
- GCC Physical & Perimeter Security Market Click here to view more.
6WResearch In News
- Doha a strategic location for EV manufacturing hub: IPA Qatar
- Demand for luxury TVs surging in the GCC, says Samsung
- Empowering Growth: The Thriving Journey of Bangladesh’s Cable Industry
- Demand for luxury TVs surging in the GCC, says Samsung
- Video call with a traditional healer? Once unthinkable, it’s now common in South Africa
- Intelligent Buildings To Smooth GCC’s Path To Net Zero