Japan Protective Relay Market Outlook | Revenue, Growth, Value, Share, Analysis, COVID-19 IMPACT, Companies, Size, Industry, Trends & Forecast
Market Forecast By Voltage (Low, Medium, High), By End-User (Utilities, Industrial, Railways, Others), By Technology (Electromechanical & Static Relay, Digital & Numerical Relay), By Application (Transmission line, Busbar, Transformer, Feeder, Generator, Motor, Others) And Competitive Landscape
| Product Code: ETC269242 | Publication Date: Aug 2022 | Updated Date: Aug 2025 | Product Type: Market Research Report | |
| Publisher: 6Wresearch | Author: Ravi Bhandari | No. of Pages: 75 | No. of Figures: 35 | No. of Tables: 20 |
Japan Protective Relay Market Size Growth Rate
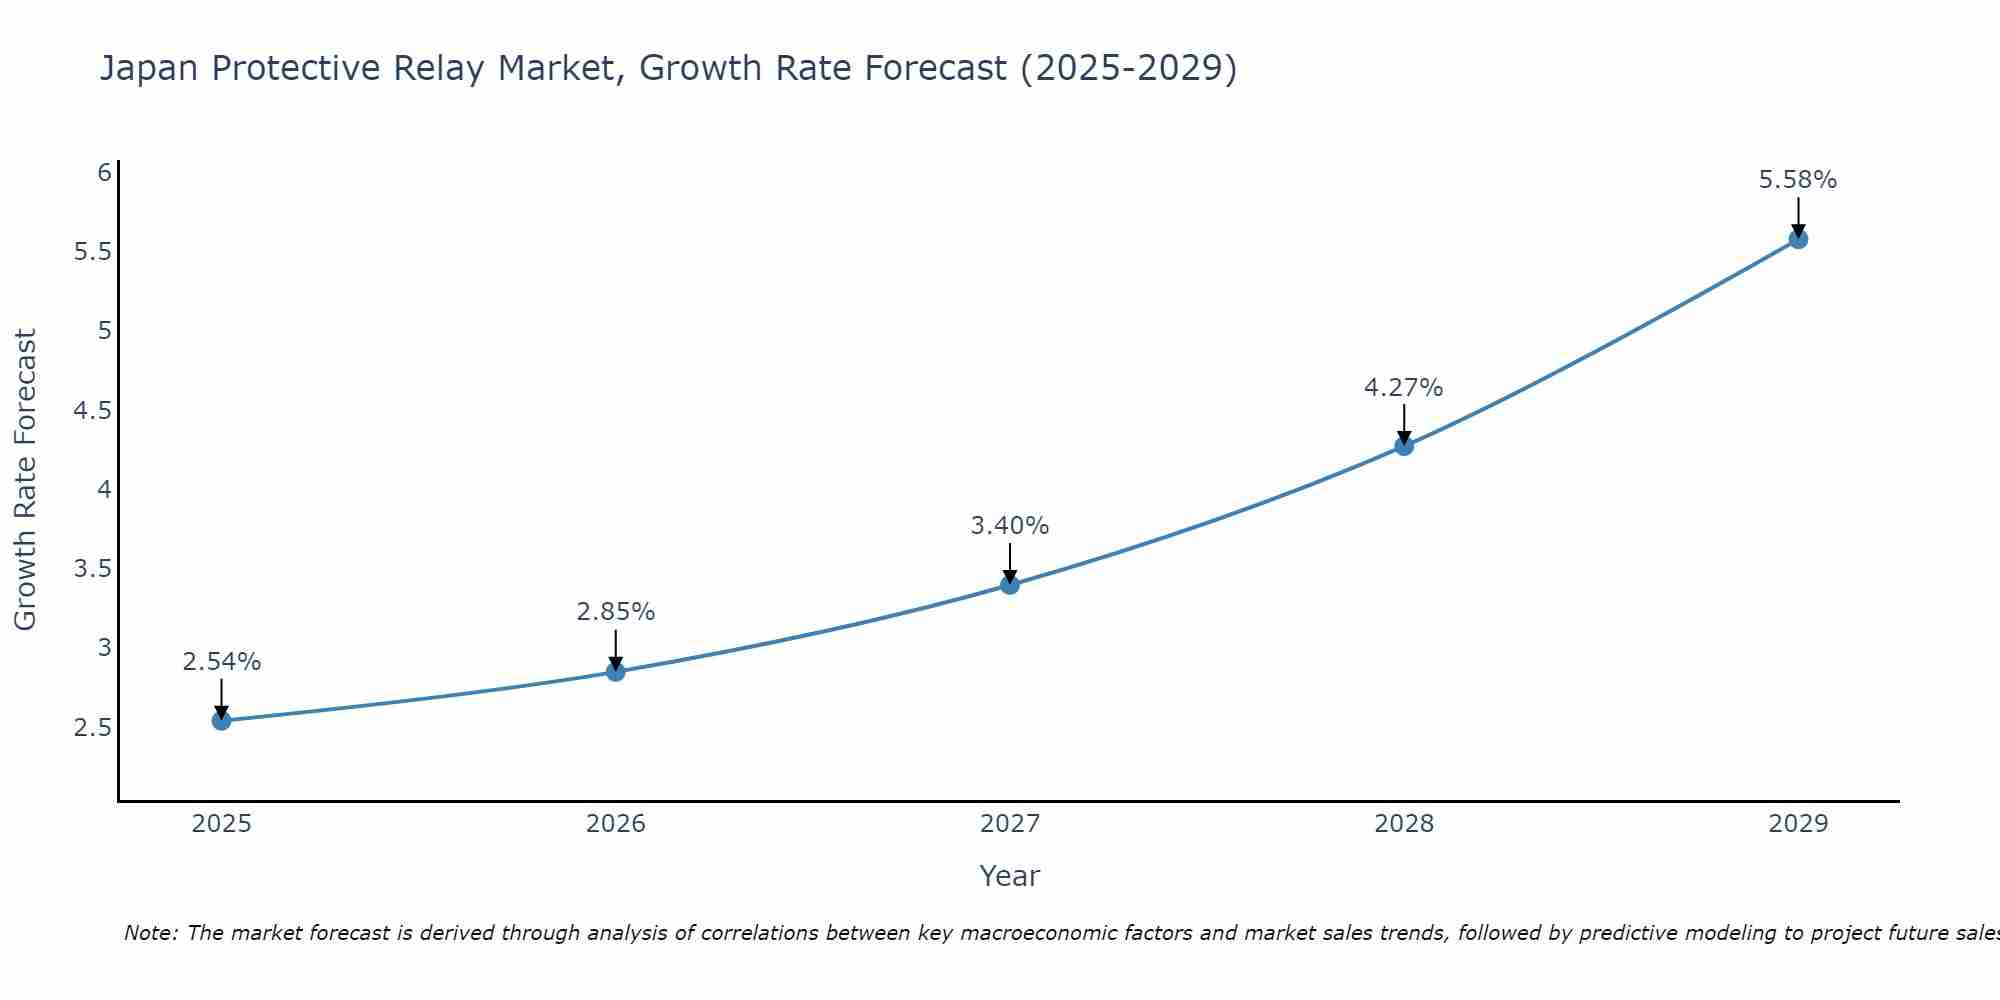
The Japan Protective Relay Market is poised for steady growth rate improvements from 2025 to 2029. From 2.54% in 2025, the growth rate steadily ascends to 5.58% in 2029.
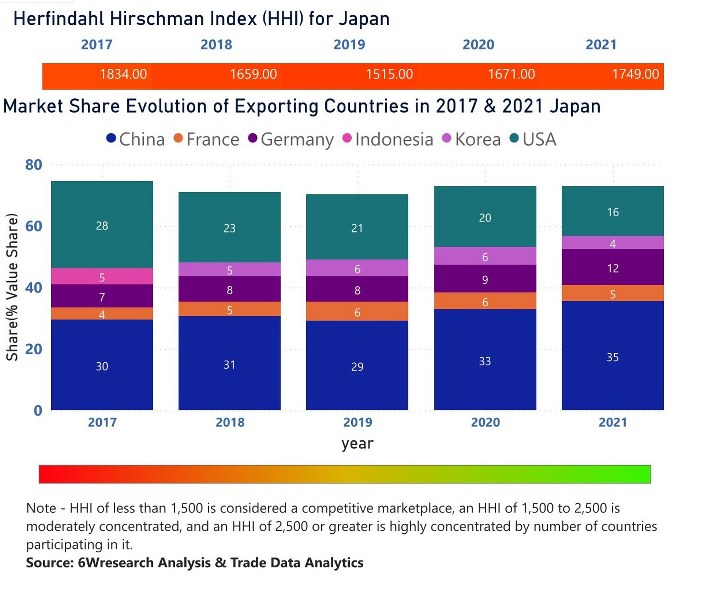
Japan Protective Relay Market | Country-Wise Share and Competition Analysis
In the year 2021, China was the largest exporter in terms of value, followed by USA. It has registered a growth of 29.58% over the previous year. While USA registered a decline of -1.27% as compare to the previous year. In the year 2017 China was the largest exporter followed by USA. In term of Herfindahl Index, which measures the competitiveness of countries exporting, Japan has the Herfindahl index of 1834 in 2017 which signifies moderately concentrated also in 2021 it registered a Herfindahl index of 1749 which signifies moderately concentrated in the market.
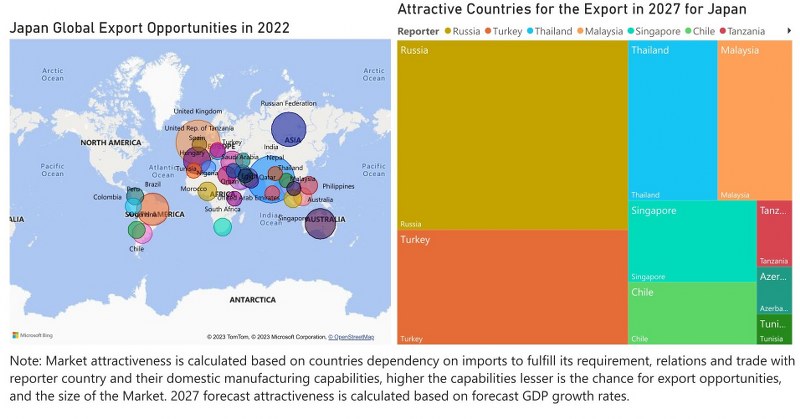
Japan Protective Relay Market - Export Market Opportunities
Key Highlights of the Report:
- Japan Protective Relay Market Outlook
- Market Size of Japan Protective Relay Market, 2021
- Forecast of Japan Protective Relay Market, 2028
- Historical Data and Forecast of Japan Protective Relay Revenues & Volume for the Period 2018 - 2028
- Japan Protective Relay Market Trend Evolution
- Japan Protective Relay Market Drivers and Challenges
- Japan Protective Relay Price Trends
- Japan Protective Relay Porter's Five Forces
- Japan Protective Relay Industry Life Cycle
- Historical Data and Forecast of Japan Protective Relay Market Revenues & Volume By Voltage for the Period 2018 - 2028
- Historical Data and Forecast of Japan Protective Relay Market Revenues & Volume By Low for the Period 2018 - 2028
- Historical Data and Forecast of Japan Protective Relay Market Revenues & Volume By Medium for the Period 2018 - 2028
- Historical Data and Forecast of Japan Protective Relay Market Revenues & Volume By High for the Period 2018 - 2028
- Historical Data and Forecast of Japan Protective Relay Market Revenues & Volume By End-User for the Period 2018 - 2028
- Historical Data and Forecast of Japan Protective Relay Market Revenues & Volume By Utilities for the Period 2018 - 2028
- Historical Data and Forecast of Japan Protective Relay Market Revenues & Volume By Industrial for the Period 2018 - 2028
- Historical Data and Forecast of Japan Protective Relay Market Revenues & Volume By Railways for the Period 2018 - 2028
- Historical Data and Forecast of Japan Protective Relay Market Revenues & Volume By Others for the Period 2018 - 2028
- Historical Data and Forecast of Japan Protective Relay Market Revenues & Volume By Technology for the Period 2018 - 2028
- Historical Data and Forecast of Japan Protective Relay Market Revenues & Volume By Electromechanical & Static Relay for the Period 2018 - 2028
- Historical Data and Forecast of Japan Protective Relay Market Revenues & Volume By Digital & Numerical Relay for the Period 2018 - 2028
- Historical Data and Forecast of Japan Protective Relay Market Revenues & Volume By Application for the Period 2018 - 2028
- Historical Data and Forecast of Japan Protective Relay Market Revenues & Volume By Transmission line for the Period 2018 - 2028
- Historical Data and Forecast of Japan Protective Relay Market Revenues & Volume By Busbar for the Period 2018 - 2028
- Historical Data and Forecast of Japan Protective Relay Market Revenues & Volume By Transformer for the Period 2018 - 2028
- Historical Data and Forecast of Japan Protective Relay Market Revenues & Volume By Feeder for the Period 2018 - 2028
- Historical Data and Forecast of Japan Protective Relay Market Revenues & Volume By Generator for the Period 2018 - 2028
- Historical Data and Forecast of Japan Protective Relay Market Revenues & Volume By Motor for the Period 2018 - 2028
- Historical Data and Forecast of Japan Protective Relay Market Revenues & Volume By Others for the Period 2018 - 2028
- Japan Protective Relay Import Export Trade Statistics
- Market Opportunity Assessment By Voltage
- Market Opportunity Assessment By End-User
- Market Opportunity Assessment By Technology
- Market Opportunity Assessment By Application
- Japan Protective Relay Top Companies Market Share
- Japan Protective Relay Competitive Benchmarking By Technical and Operational Parameters
- Japan Protective Relay Company Profiles
- Japan Protective Relay Key Strategic Recommendations
Frequently Asked Questions About the Market Study (FAQs):
6Wresearch actively monitors the Japan Protective Relay Market and publishes its comprehensive annual report, highlighting emerging trends, growth drivers, revenue analysis, and forecast outlook. Our insights help businesses to make data-backed strategic decisions with ongoing market dynamics. Our analysts track relevent industries related to the Japan Protective Relay Market, allowing our clients with actionable intelligence and reliable forecasts tailored to emerging regional needs.
Yes, we provide customisation as per your requirements. To learn more, feel free to contact us on sales@6wresearch.com
| 1 Executive Summary |
| 2 Introduction |
| 2.1 Key Highlights of the Report |
| 2.2 Report Description |
| 2.3 Market Scope & Segmentation |
| 2.4 Research Methodology |
| 2.5 Assumptions |
| 3 Japan Protective Relay Market Overview |
| 3.1 Japan Country Macro Economic Indicators |
| 3.2 Japan Protective Relay Market Revenues & Volume, 2021 & 2028F |
| 3.3 Japan Protective Relay Market - Industry Life Cycle |
| 3.4 Japan Protective Relay Market - Porter's Five Forces |
| 3.5 Japan Protective Relay Market Revenues & Volume Share, By Voltage, 2021 & 2028F |
| 3.6 Japan Protective Relay Market Revenues & Volume Share, By End-User, 2021 & 2028F |
| 3.7 Japan Protective Relay Market Revenues & Volume Share, By Technology, 2021 & 2028F |
| 3.8 Japan Protective Relay Market Revenues & Volume Share, By Application, 2021 & 2028F |
| 4 Japan Protective Relay Market Dynamics |
| 4.1 Impact Analysis |
| 4.2 Market Drivers |
| 4.2.1 Increasing investments in upgrading and modernizing power infrastructure in Japan |
| 4.2.2 Rising focus on grid reliability and minimizing power outages |
| 4.2.3 Growing adoption of smart grid technology in the country |
| 4.3 Market Restraints |
| 4.3.1 High initial costs associated with implementing protective relay systems |
| 4.3.2 Lack of skilled professionals for the installation and maintenance of protective relays |
| 4.3.3 Regulatory challenges and compliance requirements in the Japanese market |
| 5 Japan Protective Relay Market Trends |
| 6 Japan Protective Relay Market, By Types |
| 6.1 Japan Protective Relay Market, By Voltage |
| 6.1.1 Overview and Analysis |
| 6.1.2 Japan Protective Relay Market Revenues & Volume, By Voltage, 2018 - 2028F |
| 6.1.3 Japan Protective Relay Market Revenues & Volume, By Low, 2018 - 2028F |
| 6.1.4 Japan Protective Relay Market Revenues & Volume, By Medium, 2018 - 2028F |
| 6.1.5 Japan Protective Relay Market Revenues & Volume, By High, 2018 - 2028F |
| 6.2 Japan Protective Relay Market, By End-User |
| 6.2.1 Overview and Analysis |
| 6.2.2 Japan Protective Relay Market Revenues & Volume, By Utilities, 2018 - 2028F |
| 6.2.3 Japan Protective Relay Market Revenues & Volume, By Industrial, 2018 - 2028F |
| 6.2.4 Japan Protective Relay Market Revenues & Volume, By Railways, 2018 - 2028F |
| 6.2.5 Japan Protective Relay Market Revenues & Volume, By Others, 2018 - 2028F |
| 6.3 Japan Protective Relay Market, By Technology |
| 6.3.1 Overview and Analysis |
| 6.3.2 Japan Protective Relay Market Revenues & Volume, By Electromechanical & Static Relay, 2018 - 2028F |
| 6.3.3 Japan Protective Relay Market Revenues & Volume, By Digital & Numerical Relay, 2018 - 2028F |
| 6.4 Japan Protective Relay Market, By Application |
| 6.4.1 Overview and Analysis |
| 6.4.2 Japan Protective Relay Market Revenues & Volume, By Transmission line, 2018 - 2028F |
| 6.4.3 Japan Protective Relay Market Revenues & Volume, By Busbar, 2018 - 2028F |
| 6.4.4 Japan Protective Relay Market Revenues & Volume, By Transformer, 2018 - 2028F |
| 6.4.5 Japan Protective Relay Market Revenues & Volume, By Feeder, 2018 - 2028F |
| 6.4.6 Japan Protective Relay Market Revenues & Volume, By Generator, 2018 - 2028F |
| 6.4.7 Japan Protective Relay Market Revenues & Volume, By Motor, 2018 - 2028F |
| 7 Japan Protective Relay Market Import-Export Trade Statistics |
| 7.1 Japan Protective Relay Market Export to Major Countries |
| 7.2 Japan Protective Relay Market Imports from Major Countries |
| 8 Japan Protective Relay Market Key Performance Indicators |
8.1 Percentage increase in the adoption of digital protective relay systems |
8.2 Number of new infrastructure projects incorporating protective relay technology |
8.3 Rate of investment in research and development for advanced protective relay solutions |
| 9 Japan Protective Relay Market - Opportunity Assessment |
| 9.1 Japan Protective Relay Market Opportunity Assessment, By Voltage, 2021 & 2028F |
| 9.2 Japan Protective Relay Market Opportunity Assessment, By End-User, 2021 & 2028F |
| 9.3 Japan Protective Relay Market Opportunity Assessment, By Technology, 2021 & 2028F |
| 9.4 Japan Protective Relay Market Opportunity Assessment, By Application, 2021 & 2028F |
| 10 Japan Protective Relay Market - Competitive Landscape |
| 10.1 Japan Protective Relay Market Revenue Share, By Companies, 2021 |
| 10.2 Japan Protective Relay Market Competitive Benchmarking, By Operating and Technical Parameters |
| 11 Company Profiles |
| 12 Recommendations |
| 13 Disclaimer |
Export potential assessment - trade Analytics for 2030
Export potential enables firms to identify high-growth global markets with greater confidence by combining advanced trade intelligence with a structured quantitative methodology. The framework analyzes emerging demand trends and country-level import patterns while integrating macroeconomic and trade datasets such as GDP and population forecasts, bilateral import–export flows, tariff structures, elasticity differentials between developed and developing economies, geographic distance, and import demand projections. Using weighted trade values from 2020–2024 as the base period to project country-to-country export potential for 2030, these inputs are operationalized through calculated drivers such as gravity model parameters, tariff impact factors, and projected GDP per-capita growth. Through an analysis of hidden potentials, demand hotspots, and market conditions that are most favorable to success, this method enables firms to focus on target countries, maximize returns, and global expansion with data, backed by accuracy.
By factoring in the projected importer demand gap that is currently unmet and could be potential opportunity, it identifies the potential for the Exporter (Country) among 190 countries, against the general trade analysis, which identifies the biggest importer or exporter.
To discover high-growth global markets and optimize your business strategy:
Click Here
Pricing
- Single User License$ 1,995
- Department License$ 2,400
- Site License$ 3,120
- Global License$ 3,795

Search
Thought Leadership and Analyst Meet


Our Clients
Related Reports
- India Switchgear Market Outlook (2026 - 2032) | Size, Share, Trends, Growth, Revenue, Forecast, Analysis, Value, Outlook
- Pakistan Contraceptive Implants Market (2025-2031) | Demand, Growth, Size, Share, Industry, Pricing Analysis, Competitive, Strategic Insights, Strategy, Consumer Insights, Analysis, Investment Trends, Opportunities, Revenue, Segments, Value, Segmentation, Supply, Forecast, Restraints, Outlook, Competition, Drivers, Trends, Companies, Challenges
- Sri Lanka Packaging Market (2026-2032) | Outlook, Competition, Drivers, Trends, Demand, Pricing Analysis, Competitive, Strategic Insights, Companies, Challenges, Strategy, Consumer Insights, Analysis, Investment Trends, Opportunities, Growth, Size, Share, Industry, Revenue, Segments, Value, Segmentation, Supply, Forecast, Restraints
- India Kids Watches Market (2026-2032) | Strategy, Consumer Insights, Analysis, Investment Trends, Opportunities, Growth, Size, Share, Industry, Revenue, Segments, Value, Segmentation, Supply, Forecast, Restraints, Outlook, Competition, Drivers, Trends, Demand, Pricing Analysis, Competitive, Strategic Insights, Companies, Challenges
- Saudi Arabia Core Assurance Service Market (2025-2031) | Strategy, Consumer Insights, Analysis, Investment Trends, Opportunities, Growth, Size, Share, Industry, Revenue, Segments, Value, Segmentation, Supply, Forecast, Restraints, Outlook, Competition, Drivers, Trends, Demand, Pricing Analysis, Competitive, Strategic Insights, Companies, Challenges
- Romania Uninterruptible Power Supply (UPS) Market (2026-2032) | Industry, Analysis, Revenue, Size, Forecast, Outlook, Value, Trends, Share, Growth & Companies
- Saudi Arabia Car Window Tinting Film, Paint Protection Film (PPF), and Ceramic Coating Market (2025-2031) | Strategy, Consumer Insights, Analysis, Investment Trends, Opportunities, Growth, Size, Share, Industry, Revenue, Segments, Value, Segmentation, Supply, Forecast, Restraints, Outlook, Competition, Drivers, Trends, Demand, Pricing Analysis, Competitive, Strategic Insights, Companies, Challenges
- South Africa Stationery Market (2025-2031) | Share, Size, Industry, Value, Growth, Revenue, Analysis, Trends, Segmentation & Outlook
- Afghanistan Rocking Chairs And Adirondack Chairs Market (2026-2032) | Size & Revenue, Competitive Landscape, Share, Segmentation, Industry, Value, Outlook, Analysis, Trends, Growth, Forecast, Companies
- Afghanistan Apparel Market (2026-2032) | Growth, Outlook, Industry, Segmentation, Forecast, Size, Companies, Trends, Value, Share, Analysis & Revenue
Industry Events and Analyst Meet

India EV Show 2026

EV tech India Expo 2026

Auto Tech Asia 2026

Battery Tech India 2026

Smart Production Solutions Guangzhou 2026
Whitepaper
- Middle East & Africa Commercial Security Market Click here to view more.
- Middle East & Africa Fire Safety Systems & Equipment Market Click here to view more.
- GCC Drone Market Click here to view more.
- Middle East Lighting Fixture Market Click here to view more.
- GCC Physical & Perimeter Security Market Click here to view more.
6WResearch In News
- Doha a strategic location for EV manufacturing hub: IPA Qatar
- Demand for luxury TVs surging in the GCC, says Samsung
- Empowering Growth: The Thriving Journey of Bangladesh’s Cable Industry
- Demand for luxury TVs surging in the GCC, says Samsung
- Video call with a traditional healer? Once unthinkable, it’s now common in South Africa
- Intelligent Buildings To Smooth GCC’s Path To Net Zero