Japan Sulphuric Acid Market Outlook | Size, Industry, Value, Companies, Trends, Share, Growth, Forecast, COVID-19 IMPACT, Revenue & Analysis
Market Forecast By Raw Material (Elemental sulfur, Base metal smelters, Pyrite ore, Others), By Applications (Fertilizers, Chemical manufacturing, Metal processing, Petroleum refining, Textile industry, Automotive, Paper & pulp, Others) And Competitive Landscape
| Product Code: ETC074561 | Publication Date: Jun 2021 | Updated Date: Oct 2025 | Product Type: Report | |
| Publisher: 6Wresearch | Author: Ravi Bhandari | No. of Pages: 70 | No. of Figures: 35 | No. of Tables: 5 |
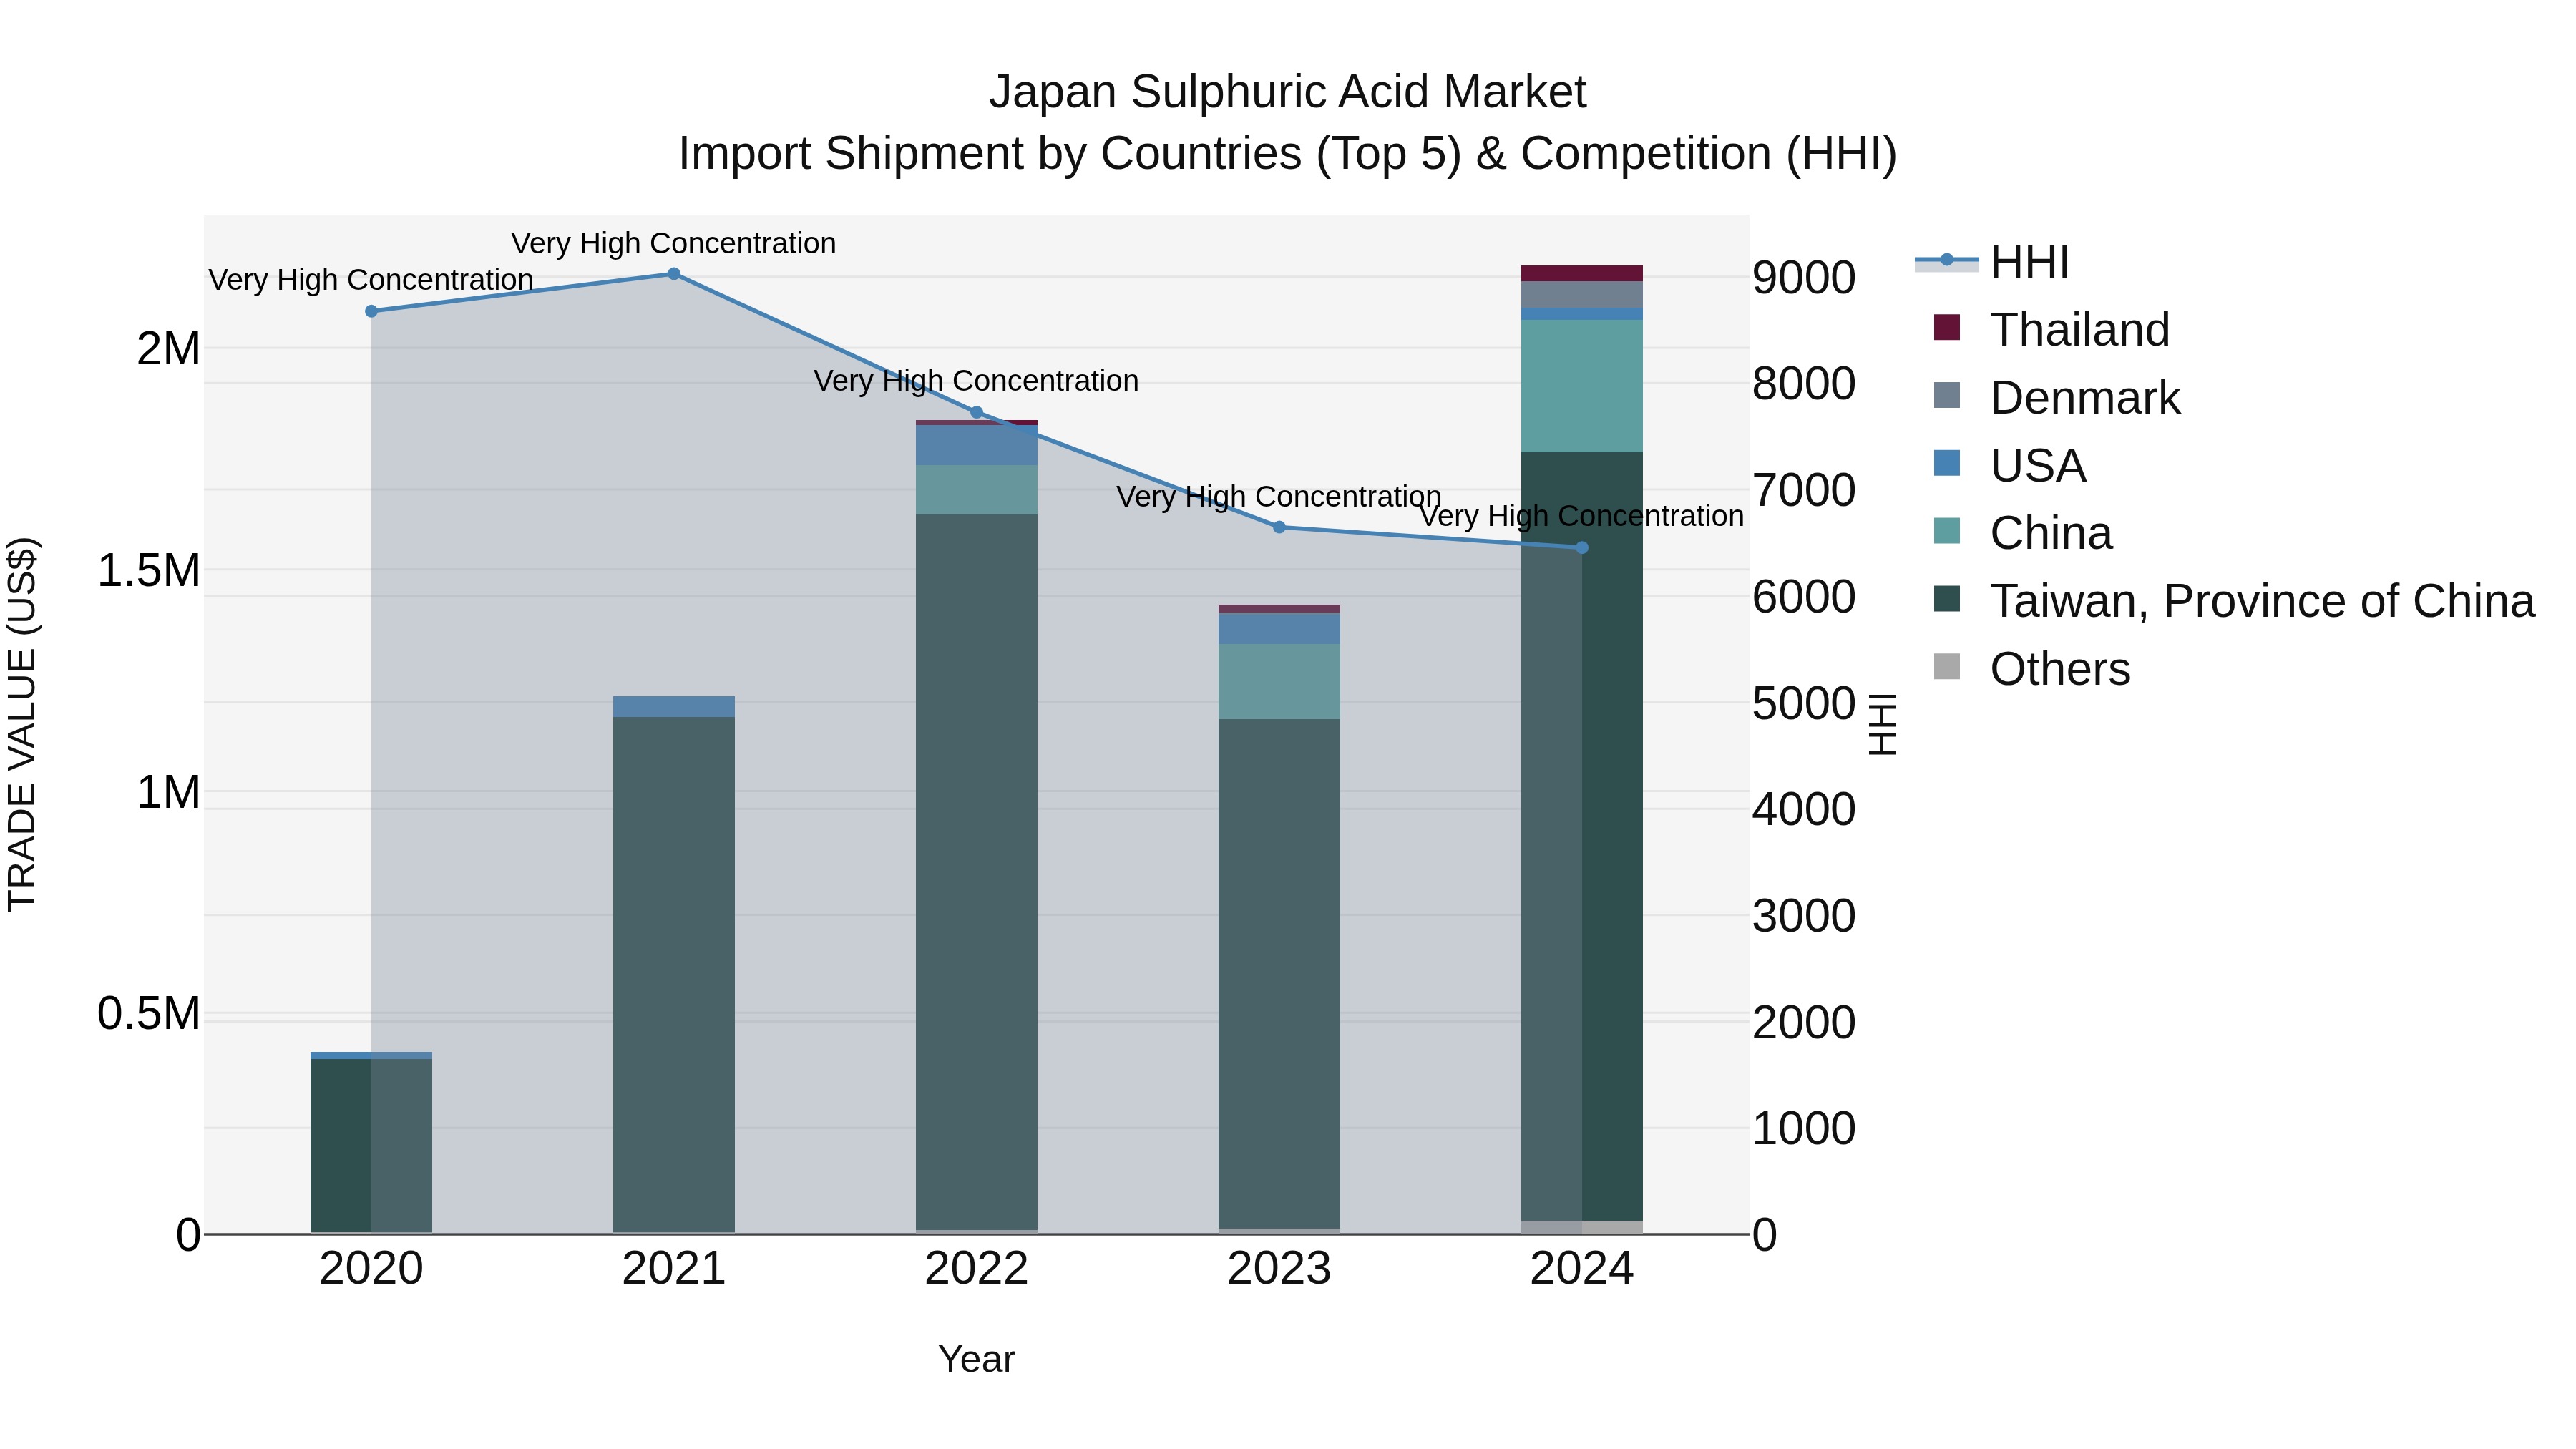
Japan Sulphuric Acid Market Import Shipment by Countries (Top 5) & Competition (HHI)
Japan's sulphuric acid import market saw significant growth in 2024, with top exporting countries being Taiwan, China, Denmark, Thailand, and the USA. The high Herfindahl-Hirschman Index (HHI) indicates a concentrated market, while the impressive Compound Annual Growth Rate (CAGR) of 51.77% from 2020 to 2024 reflects a robust industry expansion. Moreover, the growth rate spike of 53.88% from 2023 to 2024 suggests a continued upward trajectory in sulphuric acid imports for Japan. This data underscores the importance of monitoring these trends for stakeholders in the market.
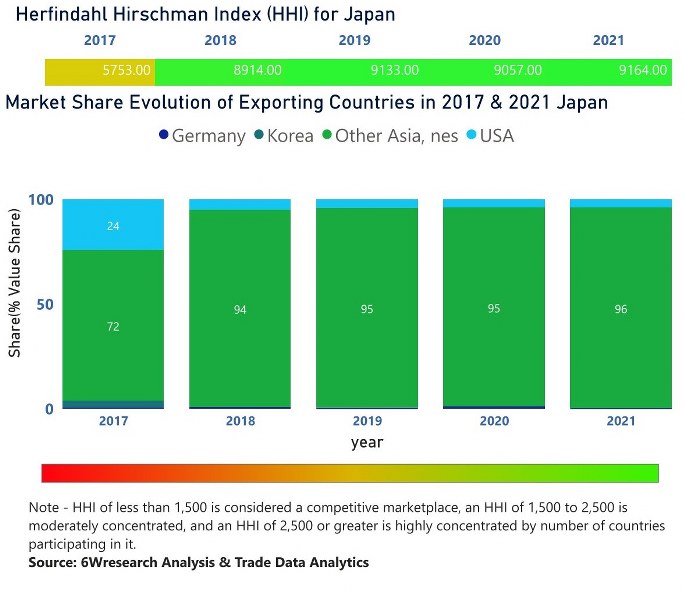
Japan Sulphuric Acid Market | Country-Wise Share and Competition Analysis
In the year 2021, Other Asia, nes was the largest exporter in terms of value, followed by USA. It has registered a growth of 196.61% over the previous year. While USA registered a growth of 200.53% as compare to the previous year. In the year 2017 Other Asia, nes was the largest exporter followed by USA. In term of Herfindahl Index, which measures the competitiveness of countries exporting, Japan has the Herfindahl index of 5753 in 2017 which signifies high concentration also in 2021 it registered a Herfindahl index of 9164 which signifies high concentration in the market.
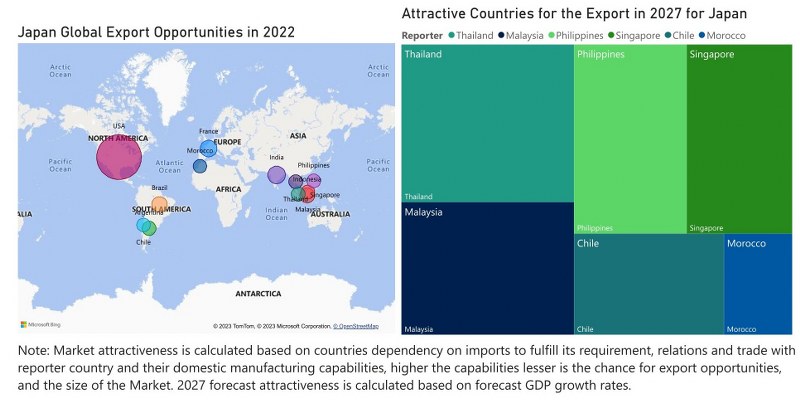
Japan Sulphuric Acid Market - Export Market Opportunities
Key Highlights of the Report:
- Japan Sulphuric Acid Market Outlook
- Market Size of Japan Sulphuric Acid Market, 2020
- Forecast of Japan Sulphuric Acid Market, 2027
- Historical Data and Forecast of Japan Sulphuric Acid Revenues & Volume for the Period 2018 - 2027
- Japan Sulphuric Acid Market Trend Evolution
- Japan Sulphuric Acid Market Drivers and Challenges
- Japan Sulphuric Acid Price Trends
- Japan Sulphuric Acid Porter's Five Forces
- Japan Sulphuric Acid Industry Life Cycle
- Historical Data and Forecast of Japan Sulphuric Acid Market Revenues & Volume By Raw Material for the Period 2018 - 2027
- Historical Data and Forecast of Japan Sulphuric Acid Market Revenues & Volume By Elemental sulfur for the Period 2018 - 2027
- Historical Data and Forecast of Japan Sulphuric Acid Market Revenues & Volume By Base metal smelters for the Period 2018 - 2027
- Historical Data and Forecast of Japan Sulphuric Acid Market Revenues & Volume By Pyrite ore for the Period 2018 - 2027
- Historical Data and Forecast of Japan Sulphuric Acid Market Revenues & Volume By Others for the Period 2018 - 2027
- Historical Data and Forecast of Japan Sulphuric Acid Market Revenues & Volume By Applications for the Period 2018 - 2027
- Historical Data and Forecast of Japan Sulphuric Acid Market Revenues & Volume By Fertilizers for the Period 2018 - 2027
- Historical Data and Forecast of Japan Sulphuric Acid Market Revenues & Volume By Chemical manufacturing for the Period 2018 - 2027
- Historical Data and Forecast of Japan Sulphuric Acid Market Revenues & Volume By Metal processing for the Period 2018 - 2027
- Historical Data and Forecast of Japan Sulphuric Acid Market Revenues & Volume By Petroleum refining for the Period 2018 - 2027
- Historical Data and Forecast of Japan Sulphuric Acid Market Revenues & Volume By Textile industry for the Period 2018 - 2027
- Historical Data and Forecast of Japan Sulphuric Acid Market Revenues & Volume By Automotive for the Period 2018 - 2027
- Historical Data and Forecast of Japan Sulphuric Acid Market Revenues & Volume By Paper & pulp for the Period 2018 - 2027
- Historical Data and Forecast of Japan Sulphuric Acid Market Revenues & Volume By Others for the Period 2018 - 2027
- Japan Sulphuric Acid Import Export Trade Statistics
- Market Opportunity Assessment By Raw Material
- Market Opportunity Assessment By Applications
- Japan Sulphuric Acid Top Companies Market Share
- Japan Sulphuric Acid Competitive Benchmarking By Technical and Operational Parameters
- Japan Sulphuric Acid Company Profiles
- Japan Sulphuric Acid Key Strategic Recommendations
Frequently Asked Questions About the Market Study (FAQs):
6Wresearch actively monitors the Japan Sulphuric Acid Market and publishes its comprehensive annual report, highlighting emerging trends, growth drivers, revenue analysis, and forecast outlook. Our insights help businesses to make data-backed strategic decisions with ongoing market dynamics. Our analysts track relevent industries related to the Japan Sulphuric Acid Market, allowing our clients with actionable intelligence and reliable forecasts tailored to emerging regional needs.
Yes, we provide customisation as per your requirements. To learn more, feel free to contact us on sales@6wresearch.com
| 1 Executive Summary |
| 2 Introduction |
| 2.1 Key Highlights of the Report |
| 2.2 Report Description |
| 2.3 Market Scope & Segmentation |
| 2.4 Research Methodology |
| 2.5 Assumptions |
| 3 Japan Sulphuric Acid Market Overview |
| 3.1 Japan Country Macro Economic Indicators |
| 3.2 Japan Sulphuric Acid Market Revenues & Volume, 2020 & 2027F |
| 3.3 Japan Sulphuric Acid Market - Industry Life Cycle |
| 3.4 Japan Sulphuric Acid Market - Porter's Five Forces |
| 3.5 Japan Sulphuric Acid Market Revenues & Volume Share, By Raw Material, 2020 & 2027F |
| 3.6 Japan Sulphuric Acid Market Revenues & Volume Share, By Applications, 2020 & 2027F |
| 4 Japan Sulphuric Acid Market Dynamics |
| 4.1 Impact Analysis |
| 4.2 Market Drivers |
| 4.2.1 Increasing demand from industries such as chemicals, pharmaceuticals, and electronics |
| 4.2.2 Growth in the agriculture sector leading to higher demand for fertilizers, which are major consumers of sulphuric acid |
| 4.2.3 Government initiatives promoting industrial growth and development |
| 4.3 Market Restraints |
| 4.3.1 Fluctuating prices of raw materials such as sulfur and energy sources |
| 4.3.2 Stringent regulations related to environmental concerns and emissions control |
| 4.3.3 Competition from alternative products or substitutes in certain applications |
| 5 Japan Sulphuric Acid Market Trends |
| 6 Japan Sulphuric Acid Market, By Types |
| 6.1 Japan Sulphuric Acid Market, By Raw Material |
| 6.1.1 Overview and Analysis |
| 6.1.2 Japan Sulphuric Acid Market Revenues & Volume, By Raw Material, 2018 - 2027F |
| 6.1.3 Japan Sulphuric Acid Market Revenues & Volume, By Elemental sulfur, 2018 - 2027F |
| 6.1.4 Japan Sulphuric Acid Market Revenues & Volume, By Base metal smelters, 2018 - 2027F |
| 6.1.5 Japan Sulphuric Acid Market Revenues & Volume, By Pyrite ore, 2018 - 2027F |
| 6.1.6 Japan Sulphuric Acid Market Revenues & Volume, By Others, 2018 - 2027F |
| 6.2 Japan Sulphuric Acid Market, By Applications |
| 6.2.1 Overview and Analysis |
| 6.2.2 Japan Sulphuric Acid Market Revenues & Volume, By Fertilizers, 2018 - 2027F |
| 6.2.3 Japan Sulphuric Acid Market Revenues & Volume, By Chemical manufacturing, 2018 - 2027F |
| 6.2.4 Japan Sulphuric Acid Market Revenues & Volume, By Metal processing, 2018 - 2027F |
| 6.2.5 Japan Sulphuric Acid Market Revenues & Volume, By Petroleum refining, 2018 - 2027F |
| 6.2.6 Japan Sulphuric Acid Market Revenues & Volume, By Textile industry, 2018 - 2027F |
| 6.2.7 Japan Sulphuric Acid Market Revenues & Volume, By Automotive, 2018 - 2027F |
| 6.2.8 Japan Sulphuric Acid Market Revenues & Volume, By Others, 2018 - 2027F |
| 6.2.9 Japan Sulphuric Acid Market Revenues & Volume, By Others, 2018 - 2027F |
| 7 Japan Sulphuric Acid Market Import-Export Trade Statistics |
| 7.1 Japan Sulphuric Acid Market Export to Major Countries |
| 7.2 Japan Sulphuric Acid Market Imports from Major Countries |
| 8 Japan Sulphuric Acid Market Key Performance Indicators |
8.1 Capacity utilization rate of sulphuric acid production facilities |
8.2 Average selling price of sulphuric acid in the market |
8.3 Utilization rate of sulphuric acid in key end-use industries such as fertilizers, chemicals, and electronics |
| 9 Japan Sulphuric Acid Market - Opportunity Assessment |
| 9.1 Japan Sulphuric Acid Market Opportunity Assessment, By Raw Material, 2020 & 2027F |
| 9.2 Japan Sulphuric Acid Market Opportunity Assessment, By Applications, 2020 & 2027F |
| 10 Japan Sulphuric Acid Market - Competitive Landscape |
| 10.1 Japan Sulphuric Acid Market Revenue Share, By Companies, 2020 |
| 10.2 Japan Sulphuric Acid Market Competitive Benchmarking, By Operating and Technical Parameters |
| 11 Company Profiles |
| 12 Recommendations |
| 13 Disclaimer |
Global Go To Market Strategy - 2030
Export potential enables firms to identify high-growth global markets with greater confidence by combining advanced trade intelligence with a structured quantitative methodology. The framework analyzes emerging demand trends and country-level import patterns while integrating macroeconomic and trade datasets such as GDP and population forecasts, bilateral import–export flows, tariff structures, elasticity differentials between developed and developing economies, geographic distance, and import demand projections. Using weighted trade values from 2020–2024 as the base period to project country-to-country export potential for 2030, these inputs are operationalized through calculated drivers such as gravity model parameters, tariff impact factors, and projected GDP per-capita growth. Through an analysis of hidden potentials, demand hotspots, and market conditions that are most favorable to success, this method enables firms to focus on target countries, maximize returns, and global expansion with data, backed by accuracy.
By factoring in the projected importer demand gap that is currently unmet and could be potential opportunity, it identifies the potential for the Exporter (Country) among 190 countries, against the general trade analysis, which identifies the biggest importer or exporter.
To discover high-growth global markets and optimize your business strategy:
Click Here
Pricing
- Single User License$ 1,995
- Department License$ 2,400
- Site License$ 3,120
- Global License$ 3,795

Leadership Perspectives from Industry Events
Search
Thought Leadership and Analyst Meet


Our Clients
6WResearch In News
- India Air Conditioner Market Set for Strong Rebound in 2026 After Weather-Led Correction and GST-Driven Recovery: 6Wresearch
- ADAS in India: How Automatic Emergency Braking, Blind Spot Detection & Driver Monitoring are Transforming Road Safety
- Doha a strategic location for EV manufacturing hub: IPA Qatar
- Demand for luxury TVs surging in the GCC, says Samsung
- Empowering Growth: The Thriving Journey of Bangladesh’s Cable Industry
- Demand for luxury TVs surging in the GCC, says Samsung
Latest Reports
- Nicaragua RPG Gaming Market (2026-2032)
- New Zealand RPG Gaming Market (2026-2032)
- Netherlands RPG Gaming Market (2026-2032)
- Nauru RPG Gaming Market (2026-2032)
- Namibia RPG Gaming Market (2026-2032)
- Mozambique RPG Gaming Market (2026-2032)
- Montenegro RPG Gaming Market (2026-2032)
- Mongolia RPG Gaming Market (2026-2032)
- Monaco RPG Gaming Market (2026-2032)
- Micronesia RPG Gaming Market (2026-2032)
Industry Events and Analyst Meet

HIMTEX 2026

India Refining Summit 2026

India EV Show 2026

EV tech India Expo 2026

Auto Tech Asia 2026
Whitepaper
- Middle East & Africa Commercial Security Market Click here to view more.
- Middle East & Africa Fire Safety Systems & Equipment Market Click here to view more.
- GCC Drone Market Click here to view more.
- Middle East Lighting Fixture Market Click here to view more.
- GCC Physical & Perimeter Security Market Click here to view more.