Kazakhstan Cordial Drink Market (2026-2032) Outlook | Analysis, Size, Forecast, Industry, Growth, Value, Companies, Revenue, Share, Trends
Market Forecast By Type (Fruit Cordials, Mango, Orange, Strawberry, Vegetable Cordials, Herbs, Spices Cordials), By Distribution Channel (Supermarkets/Hypermarkets, Departmental Stores, Online Retail) And Competitive Landscape
| Product Code: ETC189550 | Publication Date: May 2022 | Updated Date: Mar 2026 | Product Type: Market Research Report | |
| Publisher: 6Wresearch | Author: Ravi Bhandari | No. of Pages: 60 | No. of Figures: 40 | No. of Tables: 7 |
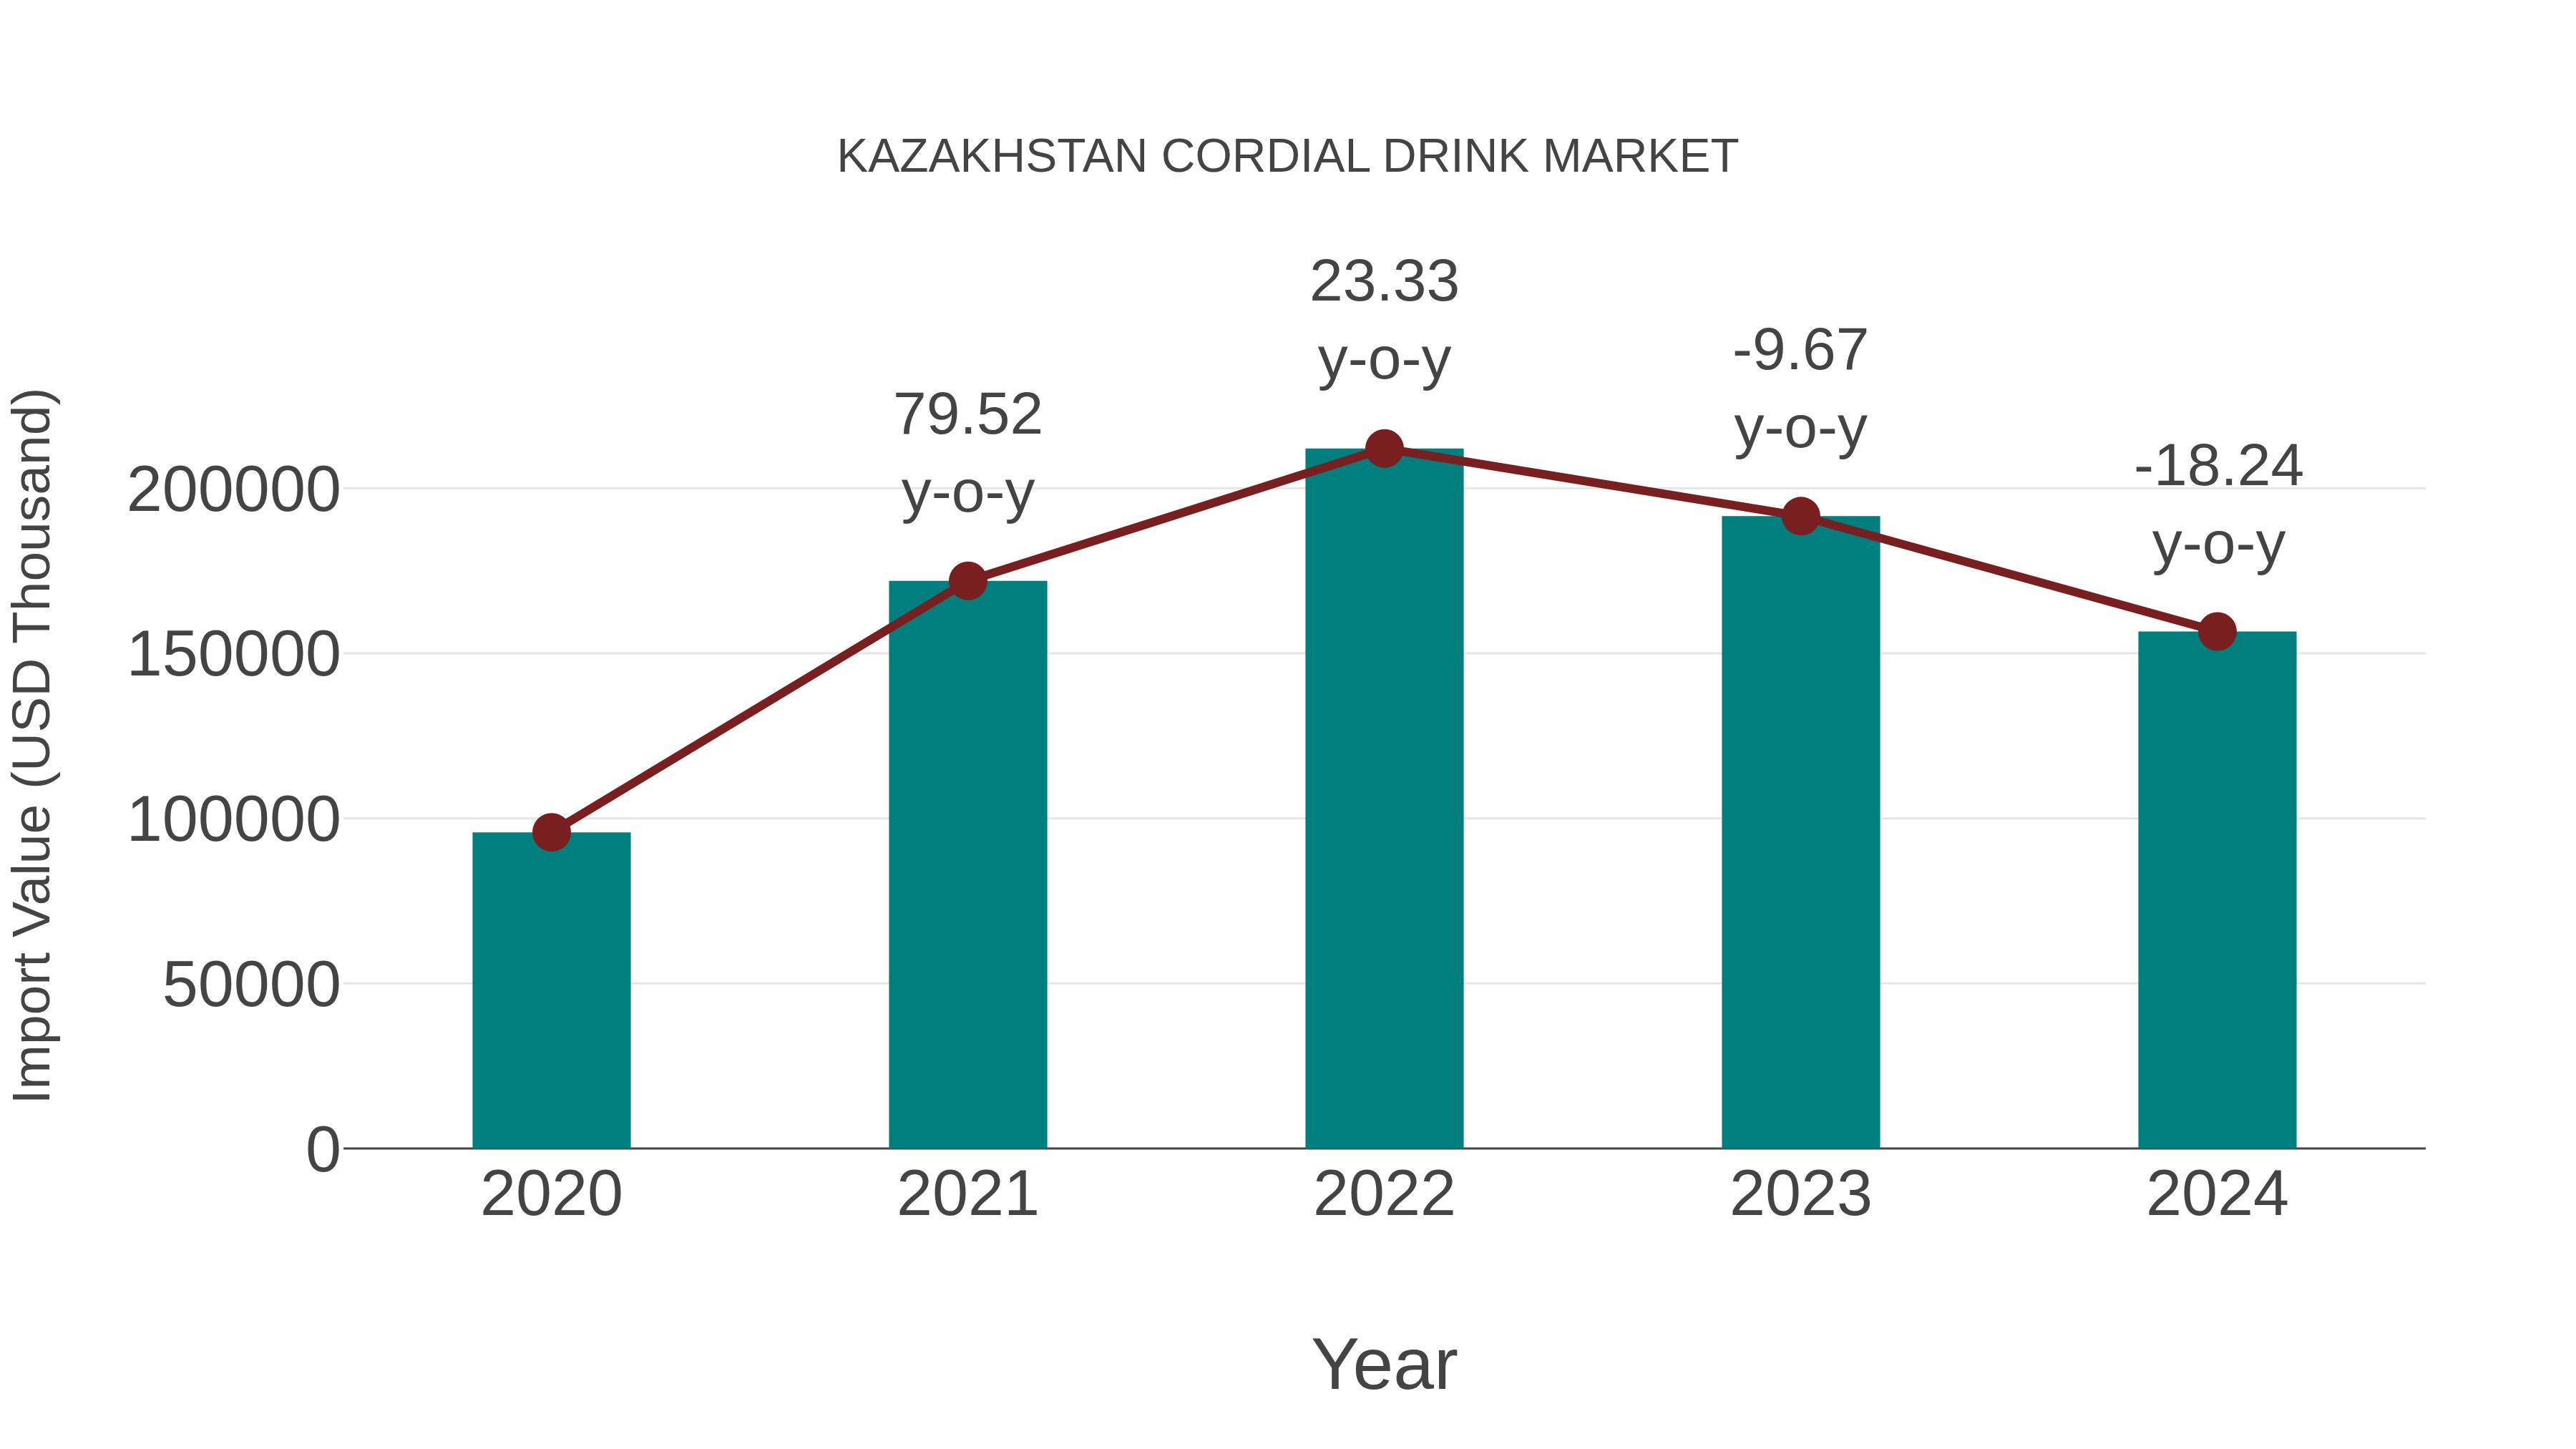
Kazakhstan Cordial Drink Market: Import Trend Analysis
In the Kazakhstan cordial drink market, the import trend experienced a decline from 2023 to 2024, with a growth rate of -18.24%. However, the compound annual growth rate (CAGR) from 2020 to 2024 stood at 13.08%. This shift could be attributed to changing consumer preferences or adjustments in trade policies impacting import momentum.
Kazakhstan Cordial Drink Market Overview
The Kazakhstan Cordial Drink Market is experiencing steady growth, fueled by changing consumer preferences, urbanization, and the rising disposable income of the population. The market is characterized by a wide variety of flavors and packaging formats catering to diverse consumer preferences. Moreover, the growing trend towards healthy and natural beverages is driving the demand for cordial drinks made from organic ingredients.
Drivers of the market
Changing consumer preferences and lifestyle trends drive the demand for cordial drinks in Kazakhstan. Cordials, including fruit syrups, concentrates, and flavored beverages, offer a convenient and refreshing option for consumers seeking non-alcoholic alternatives. Moreover, the growing popularity of homemade cocktails and mocktails fuels the demand for premium cordial drinks with unique flavors and natural ingredients. As manufacturers innovate to meet consumer demands for healthier and more diverse beverage options, the cordial drink market in Kazakhstan is expected to witness steady growth.
Challenges of the market
The cordial drink market in Kazakhstan faces challenges such as changing consumer preferences and regulatory hurdles. Increasing health consciousness among consumers is leading to a shift away from sugary beverages towards healthier alternatives, affecting the demand for traditional cordial drinks. Additionally, compliance with food safety and labeling regulations can be complex and costly, requiring manufacturers to invest in quality control and regulatory expertise.
Government Policy of the market
Policies supporting the growth of the cordial drink market are being introduced to promote the beverage industry. The government is encouraging innovation in product development and ensuring compliance with health and safety standards.
Key Highlights of the Report:
- Kazakhstan Cordial Drink Market Outlook
- Market Size of Kazakhstan Cordial Drink Market, 2025
- Forecast of Kazakhstan Cordial Drink Market, 2032
- Historical Data and Forecast of Kazakhstan Cordial Drink Revenues & Volume for the Period 2022-2032F
- Kazakhstan Cordial Drink Market Trend Evolution
- Kazakhstan Cordial Drink Market Drivers and Challenges
- Kazakhstan Cordial Drink Price Trends
- Kazakhstan Cordial Drink Porter's Five Forces
- Kazakhstan Cordial Drink Industry Life Cycle
- Historical Data and Forecast of Kazakhstan Cordial Drink Market Revenues & Volume By Type for the Period 2022-2032F
- Historical Data and Forecast of Kazakhstan Cordial Drink Market Revenues & Volume By Fruit Cordials for the Period 2022-2032F
- Historical Data and Forecast of Kazakhstan Cordial Drink Market Revenues & Volume By Mango, Orange for the Period 2022-2032F
- Historical Data and Forecast of Kazakhstan Cordial Drink Market Revenues & Volume By Strawberry for the Period 2022-2032F
- Historical Data and Forecast of Kazakhstan Cordial Drink Market Revenues & Volume By Vegetable Cordials for the Period 2022-2032F
- Historical Data and Forecast of Kazakhstan Cordial Drink Market Revenues & Volume By Herbs for the Period 2022-2032F
- Historical Data and Forecast of Kazakhstan Cordial Drink Market Revenues & Volume By Spices Cordials for the Period 2022-2032F
- Historical Data and Forecast of Kazakhstan Cordial Drink Market Revenues & Volume By Distribution Channel for the Period 2022-2032F
- Historical Data and Forecast of Kazakhstan Cordial Drink Market Revenues & Volume By Supermarkets/Hypermarkets for the Period 2022-2032F
- Historical Data and Forecast of Kazakhstan Cordial Drink Market Revenues & Volume By Departmental Stores for the Period 2022-2032F
- Historical Data and Forecast of Kazakhstan Cordial Drink Market Revenues & Volume By Online Retail for the Period 2022-2032F
- Kazakhstan Cordial Drink Import Export Trade Statistics
- Market Opportunity Assessment By Type
- Market Opportunity Assessment By Distribution Channel
- Kazakhstan Cordial Drink Top Companies Market Share
- Kazakhstan Cordial Drink Competitive Benchmarking By Technical and Operational Parameters
- Kazakhstan Cordial Drink Company Profiles
- Kazakhstan Cordial Drink Key Strategic Recommendations
Kazakhstan Cordial Drink Market (2026-2032): FAQs
6Wresearch actively monitors the Kazakhstan Cordial Drink Market and publishes its comprehensive annual report, highlighting emerging trends, growth drivers, revenue analysis, and forecast outlook. Our insights help businesses to make data-backed strategic decisions with ongoing market dynamics. Our analysts track relevent industries related to the Kazakhstan Cordial Drink Market, allowing our clients with actionable intelligence and reliable forecasts tailored to emerging regional needs.
Yes, we provide customisation as per your requirements. To learn more, feel free to contact us on sales@6wresearch.com
1 Executive Summary |
2 Introduction |
2.1 Key Highlights of the Report |
2.2 Report Description |
2.3 Market Scope & Segmentation |
2.4 Research Methodology |
2.5 Assumptions |
3 Kazakhstan Cordial Drink Market Overview |
3.1 Kazakhstan Country Macro Economic Indicators |
3.2 Kazakhstan Cordial Drink Market Revenues & Volume, 2022 & 2032F |
3.3 Kazakhstan Cordial Drink Market - Industry Life Cycle |
3.4 Kazakhstan Cordial Drink Market - Porter's Five Forces |
3.5 Kazakhstan Cordial Drink Market Revenues & Volume Share, By Type, 2022 & 2032F |
3.6 Kazakhstan Cordial Drink Market Revenues & Volume Share, By Distribution Channel, 2022 & 2032F |
4 Kazakhstan Cordial Drink Market Dynamics |
4.1 Impact Analysis |
4.2 Market Drivers |
4.2.1 Increasing consumer awareness about health benefits of cordial drinks |
4.2.2 Growing demand for natural and organic ingredients in beverages |
4.2.3 Rising disposable income leading to higher spending on premium cordial drinks |
4.3 Market Restraints |
4.3.1 Fluctuating prices of raw materials impacting production costs |
4.3.2 Intense competition from other non-alcoholic beverage segments |
4.3.3 Stringent government regulations on food and beverage industry |
5 Kazakhstan Cordial Drink Market Trends |
6 Kazakhstan Cordial Drink Market, By Types |
6.1 Kazakhstan Cordial Drink Market, By Type |
6.1.1 Overview and Analysis |
6.1.2 Kazakhstan Cordial Drink Market Revenues & Volume, By Type, 2022-2032F |
6.1.3 Kazakhstan Cordial Drink Market Revenues & Volume, By Fruit Cordials, 2022-2032F |
6.1.4 Kazakhstan Cordial Drink Market Revenues & Volume, By Mango, Orange, 2022-2032F |
6.1.5 Kazakhstan Cordial Drink Market Revenues & Volume, By Strawberry, 2022-2032F |
6.1.6 Kazakhstan Cordial Drink Market Revenues & Volume, By Vegetable Cordials, 2022-2032F |
6.1.7 Kazakhstan Cordial Drink Market Revenues & Volume, By Herbs, 2022-2032F |
6.1.8 Kazakhstan Cordial Drink Market Revenues & Volume, By Spices Cordials, 2022-2032F |
6.2 Kazakhstan Cordial Drink Market, By Distribution Channel |
6.2.1 Overview and Analysis |
6.2.2 Kazakhstan Cordial Drink Market Revenues & Volume, By Supermarkets/Hypermarkets, 2022-2032F |
6.2.3 Kazakhstan Cordial Drink Market Revenues & Volume, By Departmental Stores, 2022-2032F |
6.2.4 Kazakhstan Cordial Drink Market Revenues & Volume, By Online Retail, 2022-2032F |
7 Kazakhstan Cordial Drink Market Import-Export Trade Statistics |
7.1 Kazakhstan Cordial Drink Market Export to Major Countries |
7.2 Kazakhstan Cordial Drink Market Imports from Major Countries |
8 Kazakhstan Cordial Drink Market Key Performance Indicators |
8.1 Consumer engagement on social media platforms for cordial drink brands |
8.2 Number of new product launches and innovations in the cordial drink market |
8.3 Growth in distribution channels and availability of cordial drinks in retail outlets |
9 Kazakhstan Cordial Drink Market - Opportunity Assessment |
9.1 Kazakhstan Cordial Drink Market Opportunity Assessment, By Type, 2022 & 2032F |
9.2 Kazakhstan Cordial Drink Market Opportunity Assessment, By Distribution Channel, 2022 & 2032F |
10 Kazakhstan Cordial Drink Market - Competitive Landscape |
10.1 Kazakhstan Cordial Drink Market Revenue Share, By Companies, 2025 |
10.2 Kazakhstan Cordial Drink Market Competitive Benchmarking, By Operating and Technical Parameters |
11 Company Profiles |
12 Recommendations |
13 Disclaimer |
Export potential assessment - trade Analytics for 2030
Export potential enables firms to identify high-growth global markets with greater confidence by combining advanced trade intelligence with a structured quantitative methodology. The framework analyzes emerging demand trends and country-level import patterns while integrating macroeconomic and trade datasets such as GDP and population forecasts, bilateral import–export flows, tariff structures, elasticity differentials between developed and developing economies, geographic distance, and import demand projections. Using weighted trade values from 2020–2024 as the base period to project country-to-country export potential for 2030, these inputs are operationalized through calculated drivers such as gravity model parameters, tariff impact factors, and projected GDP per-capita growth. Through an analysis of hidden potentials, demand hotspots, and market conditions that are most favorable to success, this method enables firms to focus on target countries, maximize returns, and global expansion with data, backed by accuracy.
By factoring in the projected importer demand gap that is currently unmet and could be potential opportunity, it identifies the potential for the Exporter (Country) among 190 countries, against the general trade analysis, which identifies the biggest importer or exporter.
To discover high-growth global markets and optimize your business strategy:
Click Here
Pricing
- Single User License$ 1,995
- Department License$ 2,400
- Site License$ 3,120
- Global License$ 3,795

Search
Thought Leadership and Analyst Meet


Our Clients
Latest Reports
- India Ultrasonic Smart Water Meter Market (2026-2032) | Outlook, Competition, Drivers, Trends, Demand, Competitive, Strategic Insights, Companies, Challenges, Strategy, Consumer Insights, Analysis, Opportunities, Growth, Size, Share, Industry, Revenue, Segments, Value, Segmentation, Supply, Forecast, Restraints,
- India Electromagnetic Bulk Flow Meter Market (2026-2032) | Analysis, Challenges, Strategic Insights, Supply, Forecast, Growth, Share, Consumer Insights, Competitive, Value, Outlook, Size & Demand,
- India Battery Powered Bulk Flow Meter Market (2026-2032) | Outlook, Analysis, Competitive Landscape, Growth, Size, Trends, Value, Revenue, Companies, Segmentation, Share & Forecast
- Bosnia and Herzegovina Fuel-Efficient Winglets Market (2026-2032) | Growth, Competition, Strategy, Restraints, Trends, Challenges, segmentation, Value, Outlook, Investment Opportunities, Analysis, Revenue, Companies, Insights, Pricing, Size, Drivers, Demand, Share, Forecast
- Canada Cloud CFD Market (2026-2032) | Size & Revenue, Industry, Growth, Competitive Landscape, Forecast, Segmentation, Value, Outlook, Trends, Share, Analysis, Companies
- Taiwan Food Delivery Platform Market (2026-2032) | Companies, Outlook, Analysis, Trends, Value, Revenue, Segmentation, Share, Forecast, Competitive Landscape, Growth, Size & Forecast
- United Kingdom (UK) Long-term Care Insurance Market (2026-2032) | Growth, Share, Consumer Insights, Drivers, Opportunities, Competition, Pricing Analysis, Segments, Restraints, Companies, Competitive, Value, Outlook, Size, Demand, Analysis, Challenges, Strategic Insights, Investment Trends, Revenue, Trends, Supply, Forecast
- United Kingdom (UK) Long Term Care Market (2026-2032) | Companies, Outlook, Analysis, Trends, Value, Revenue, Segmentation, Share, Forecast, Competitive Landscape, Growth, Size & Forecast
- Iraq Insulation and Waterproofing Market (2026-2032) | Outlook, Drivers, Growth, Size, Share, Industry, Revenue, Trends, Demand, Competitive, Strategic Insights, Opportunities, Segments, Companies, Challenges, Strategy, Consumer Insights, Analysis, Investment Trends, Value, Segmentation, Forecast, Restraints
- India Switchgear Market Outlook (2026-2032) | Size, Share, Trends, Growth, Revenue, Forecast, Analysis, Value, Outlook
Industry Events and Analyst Meet

India EV Show 2026

EV tech India Expo 2026

Auto Tech Asia 2026

Battery Tech India 2026

Smart Production Solutions Guangzhou 2026
Whitepaper
- Middle East & Africa Commercial Security Market Click here to view more.
- Middle East & Africa Fire Safety Systems & Equipment Market Click here to view more.
- GCC Drone Market Click here to view more.
- Middle East Lighting Fixture Market Click here to view more.
- GCC Physical & Perimeter Security Market Click here to view more.
6WResearch In News
- Doha a strategic location for EV manufacturing hub: IPA Qatar
- Demand for luxury TVs surging in the GCC, says Samsung
- Empowering Growth: The Thriving Journey of Bangladesh’s Cable Industry
- Demand for luxury TVs surging in the GCC, says Samsung
- Video call with a traditional healer? Once unthinkable, it’s now common in South Africa
- Intelligent Buildings To Smooth GCC’s Path To Net Zero