Kenya Gas Equipment Market (2026-2032) | Revenue, Outlook, Size, Trends, Share, Growth, Analysis, Forecast, Value, Companies & Industry
Market Forecast By Equipment Type (Gas Delivery Systems, Gas Regulators, Flow Devices, Purifiers & Filters, Gas Generating Systems, Gas Detection Systems, Cryogenic Products, Accessories), By Process (Gas Generation, Gas Storage, Gas Detection, Gas Transportation), By End-Gas (Nitrogen, Hydrogen, Helium, Oxygen, Carbon Dioxide, Others), By End-Users (Metal Fabrication, Chemicals, Healthcare, Oil and Gas, Food and Beverage, Others) And Competitive Landscape
| Product Code: ETC048090 | Publication Date: Jan 2021 | Updated Date: Jun 2026 | Product Type: Report | |
| Publisher: 6Wresearch | Author: Bhawna Singh | No. of Pages: 70 | No. of Figures: 35 | No. of Tables: 5 |
Kenya Gas Equipment Market Size, Share & Growth Rate
The Kenya Gas Equipment Market was estimated at USD 169 Million in 2025 and is projected to reach USD 224 Million by 2032, growing at a CAGR of 4.1% from 2026 to 2032. This steady growth is being fueled by an increasing shift towards clean energy solutions, particularly liquefied petroleum gas (LPG), as more households and businesses recognize the benefits of gas over traditional cooking methods. Additionally, government policies promoting the use of LPG for cooking and heating are creating a favorable environment for market expansion.
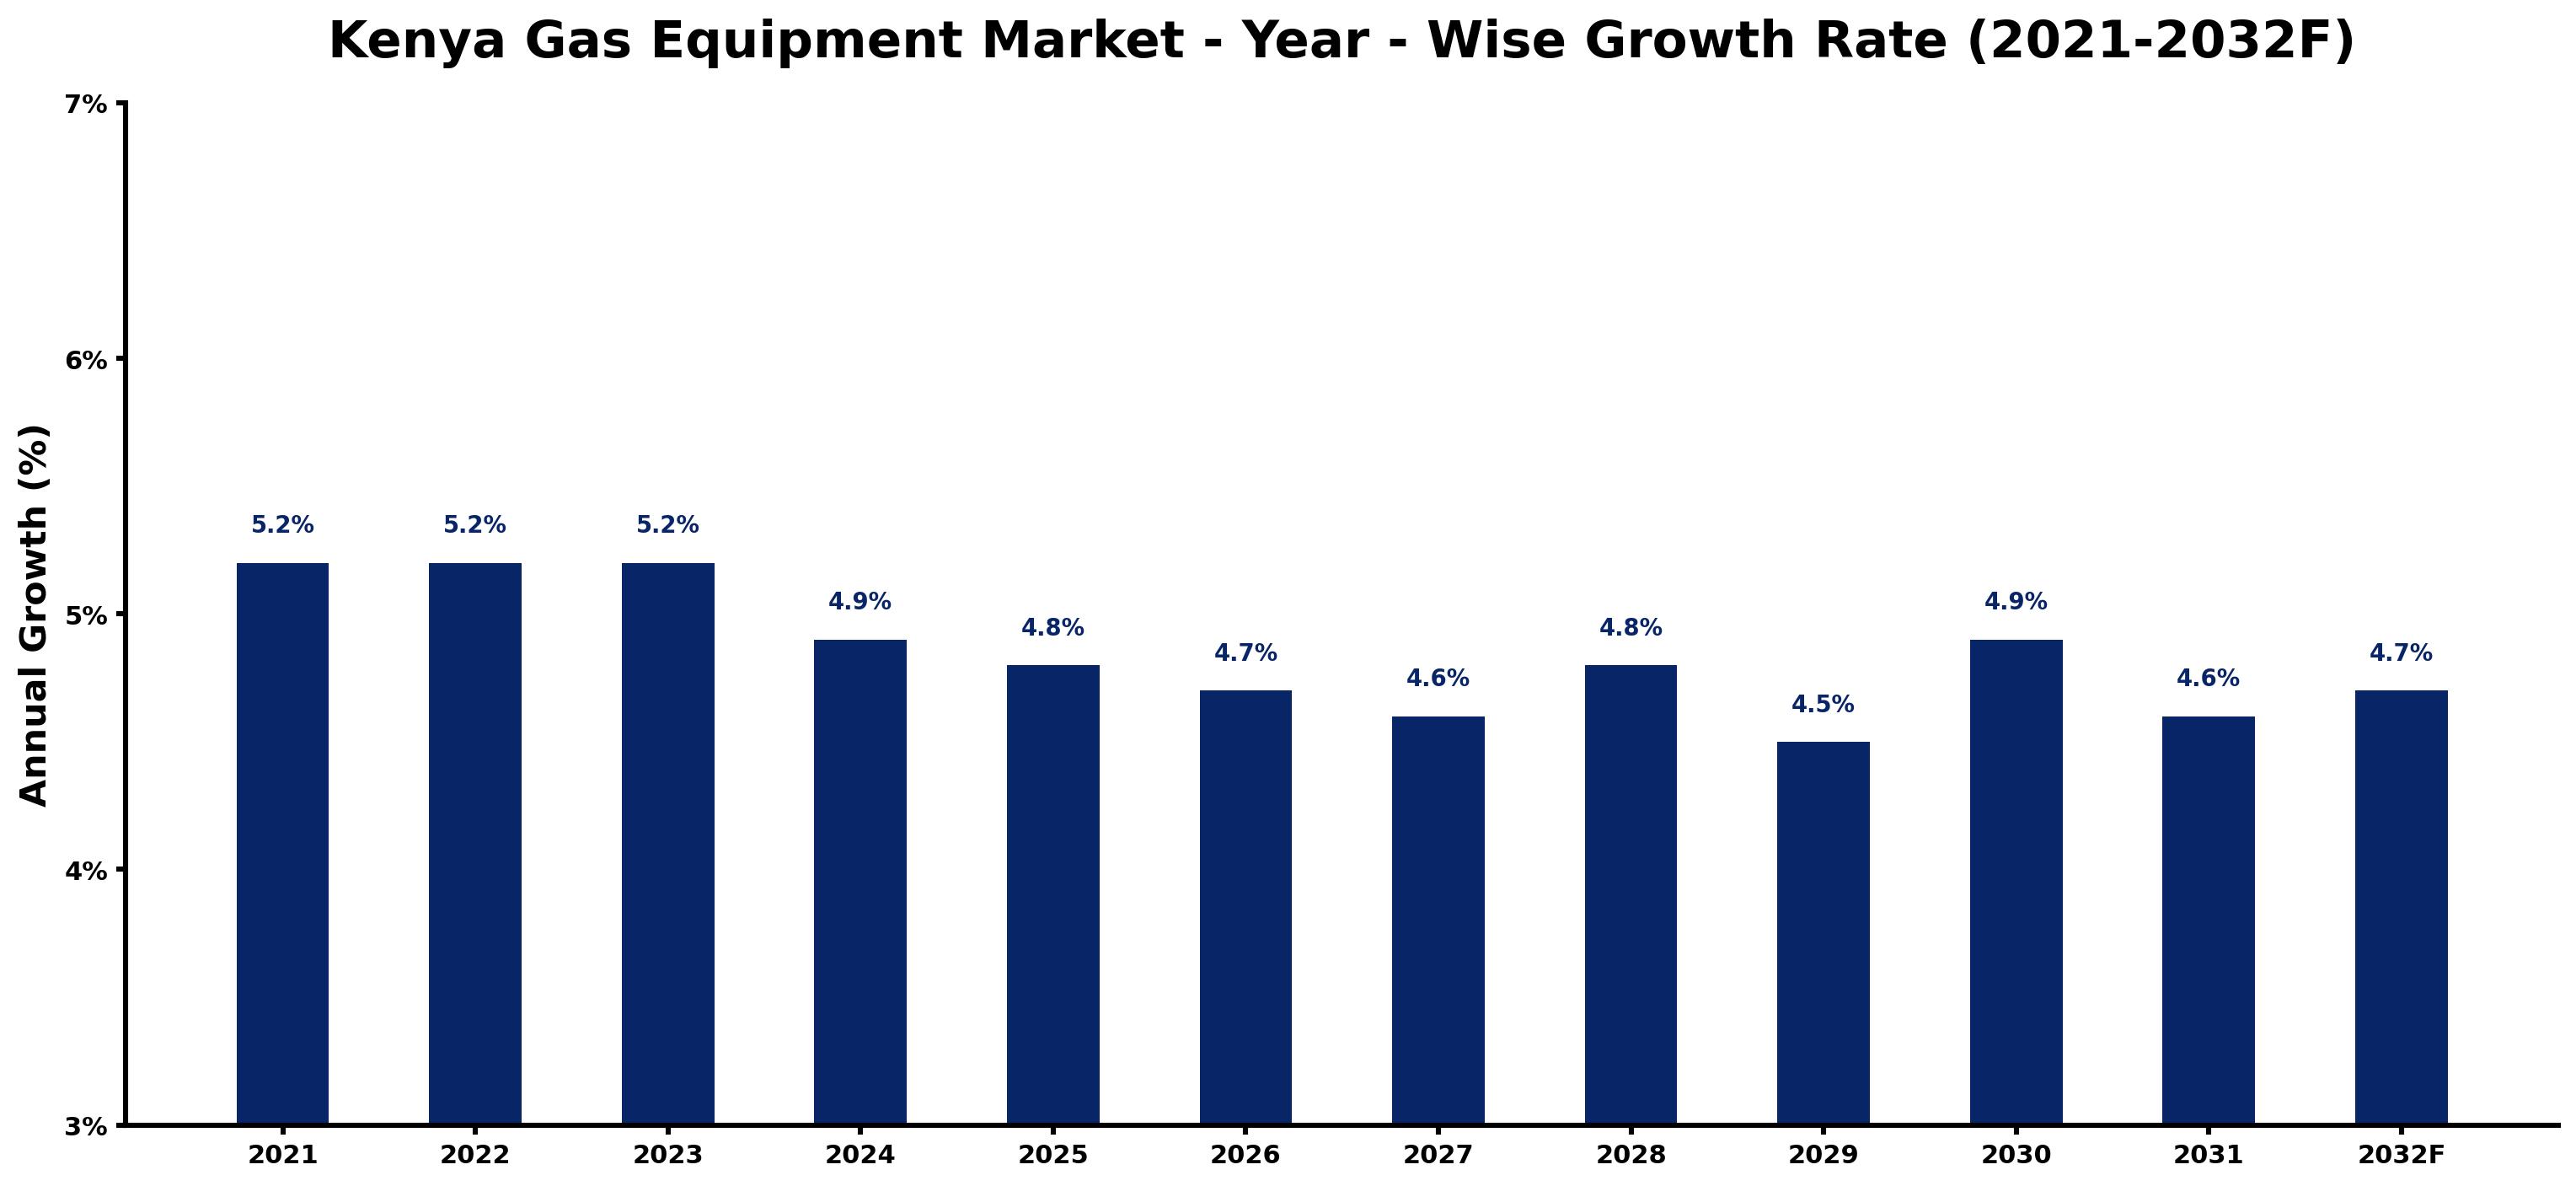
Kenya Gas Equipment Market Growth Rate Analysis (2021-2032)
The Kenya Gas Equipment Market has exhibited a stable growth pattern, showing a steady increase of 5.2% in both 2021 and 2022. This momentum continued into 2023, driven by rising consumer demand for cleaner energy solutions and significant investments in infrastructure development. However, as we approach 2024, growth is expected to slightly slow to 4.9%. The decline in growth rate can be attributed to increased competition and the maturation of the market. As the years progress, we foresee fluctuations, with growth projected at 4.6% in 2027 before a slight rebound to 4.9% in 2030, highlighting the ongoing shifts in energy policies and technology adoption within the sector.
Kenya Gas Equipment Market Year-wise Growth Rate and Key Drivers
This graph highlights how the Kenya Gas Equipment Market has steadily grown over the past five years, supported by major growth factors.
The table below presents the year‑wise growth rates along with the key drivers influencing the market
| Year | Growth Rate | Major Drivers |
| 2021 | 5.2% | Increasing smart city development projects |
| 2022 | 5.2% | Expansion of commercial construction activities |
| 2023 | 5.2% | Increasing adoption of advanced technologies |
| 2024 | 4.9% | Expansion of transportation and logistics networks |
| 2025 | 4.8% | Expansion of manufacturing activities |
| 2026 | 4.7% | Expansion of transportation and logistics networks |
| 2027 | 4.6% | Increasing adoption of advanced technologies |
| 2028 | 4.8% | Increasing industrial infrastructure investments |
| 2029 | 4.5% | Rapid growth in telecom and data center sectors |
| 2030 | 4.9% | Expansion of manufacturing activities |
| 2031 | 4.6% | Expansion of manufacturing activities |
| 2032 | 4.7% | Expansion of commercial construction activities |
Note - Market size estimations and growth projections presented in this report are based on 6Wresearch’s advanced forecasting approach, validated with industry datasets as of June 2026.
Kenya Gas Equipment Market Synopsis
The strongest force shaping the Kenya Gas Equipment Market is the government’s commitment to promoting safe and sustainable energy sources. Regulatory frameworks are designed to ensure the safety and efficiency of gas equipment, which is fostering consumer trust and encouraging adoption. Concurrently, rising urbanization and disposable incomes are further driving the demand for gas equipment among a growing middle class seeking modern and convenient cooking solutions.
In this evolving landscape, both local and international players are intensifying their efforts to capture market share, leading to heightened competition. This competitive dynamic is pushing manufacturers to innovate, introducing technologically advanced products that cater to the desires of environmentally conscious consumers looking for energy-efficient appliances.
Kenya Gas Equipment Market Key Takeaways
- The market is on a growth trajectory driven by rising urbanization and increased disposable incomes.
- Government initiatives are actively promoting the use of LPG, enhancing consumer adoption of gas equipment.
- Product innovation is central to market competitiveness, with advancements in safety and convenience features.
- Awareness of environmental sustainability is influencing consumer preferences towards cleaner cooking solutions.
- Challenges in infrastructure and financing remain hurdles that need addressing for sustained growth.
Evaluation of Restraints in Kenya Gas Equipment Market
Despite its growth potential, the Kenya Gas Equipment Market faces several constraints. One significant barrier is the high initial investment required to establish gas equipment businesses, particularly for small and medium enterprises. Additionally, inconsistent government policies and regulations can create uncertainty, deterring investment. There's also considerable competition from cheaper, traditional fuel alternatives like charcoal and firewood, which still dominate in many areas. Furthermore, infrastructure challenges, including inadequate distribution networks and storage facilities, hinder the efficient reach of gas products to consumers, impacting market growth.
Kenya Gas Equipment Market Trends
Emerging trends in the Kenya Gas Equipment Market reflect a shift towards eco-friendly and energy-efficient appliances. Consumers increasingly favor products that combine sustainability with cost-effectiveness, pushing manufacturers to enhance their offerings. There is also a noticeable rise in the popularity of portable and compact gas equipment, particularly appealing to urban residents and those seeking outdoor cooking options. Moreover, advanced features such as digital controls and safety sensors are becoming standard expectations among consumers, pushing manufacturers to innovate continually.
Kenya Gas Equipment Market Opportunities
The market offers significant investment opportunities, particularly in the supply of essential components such as gas cylinders, regulators, and safety equipment. As urbanization continues, there is a pressing need for expanded distribution networks and storage facilities to support the growing demand for cooking gas. Investors can also explore ventures focused on innovative gas appliances that meet the rising consumer expectations for efficiency and safety. With favorable government policies and an increasing focus on clean energy solutions, the Kenya Gas Equipment Market presents a fertile ground for growth.
Government Initiatives in the Kenya Gas Equipment Market
The Kenyan government has rolled out various initiatives aimed at regulating and promoting the gas equipment market, focusing on safety and environmental sustainability. The Energy Act empowers the Energy Regulatory Commission to oversee the licensing of gas equipment suppliers, ensuring compliance with stringent safety standards. Furthermore, training and certification programs for gas technicians are being established to bolster safety across the industry, while regulations advocating the adoption of clean energy sources like LPG are designed to minimize reliance on traditional fuels.
Future Insights of the Kenya Gas Equipment Market
Looking ahead to 2026-2032, the Kenya Gas Equipment Market is set for dynamic expansion. The combination of rising disposable incomes, urban growth, and government incentives for cleaner energy usage indicates a robust demand for gas equipment. As more consumers transition from traditional fuels to cleaner alternatives, the market will likely see enhanced growth opportunities. Additionally, the emphasis on innovative technologies and sustainable solutions will further shape the landscape, presenting ongoing challenges and opportunities for stakeholders involved.
Kenya Gas Equipment Market Latest Developments (May 2025 - June 2026)
In recent months, the Kenya Gas Equipment Market has witnessed strategic movements aimed at enhancing product offerings and distribution networks. Companies are increasingly focusing on the launch of new eco-friendly gas appliances that align with consumer demands for sustainability. Moreover, partnerships aimed at improving the logistics of gas distribution are emerging, seeking to bridge infrastructure gaps and enhance market accessibility. Ongoing training programs for technicians are also being reinforced to ensure safety and compliance within the industry, reflecting the government's commitment to promoting a secure gas equipment market.
Kenya Gas Equipment Market - Key Attractiveness of the Report
- 10 Years of Market Numbers
- Historical Data Starting from 2022 to 2025
- Base Year: 2025
- Forecast Data until 2032
- Key Performance Indicators Impacting the Market
- Major Upcoming Developments and Projects
Key Highlights of the Report:
- Kenya Gas Equipment Market Outlook
- Market Size of Kenya Gas Equipment Market, 2025
- Forecast of Kenya Gas Equipment Market, 2032
- Historical Data and Forecast of Kenya Gas Equipment Revenues & Volume for the Period 2022-2032F
- Kenya Gas Equipment Market Trend Evolution
- Kenya Gas Equipment Market Drivers and Challenges
- Kenya Gas Equipment Price Trends
- Kenya Gas Equipment Porter's Five Forces
- Kenya Gas Equipment Industry Life Cycle
- Historical Data and Forecast of Kenya Gas Equipment Market Revenues & Volume By Equipment Type for the Period 2022-2032F
- Historical Data and Forecast of Kenya Gas Equipment Market Revenues & Volume By Gas Delivery Systems for the Period 2022-2032F
- Historical Data and Forecast of Kenya Gas Equipment Market Revenues & Volume By Gas Regulators for the Period 2022-2032F
- Historical Data and Forecast of Kenya Gas Equipment Market Revenues & Volume By Flow Devices for the Period 2022-2032F
- Historical Data and Forecast of Kenya Gas Equipment Market Revenues & Volume By Purifiers & Filters for the Period 2022-2032F
- Historical Data and Forecast of Kenya Gas Equipment Market Revenues & Volume By Gas Generating Systems for the Period 2022-2032F
- Historical Data and Forecast of Kenya Gas Equipment Market Revenues & Volume By Gas Detection Systems for the Period 2022-2032F
- Historical Data and Forecast of Kenya Gas Equipment Market Revenues & Volume By Cryogenic Products for the Period 2022-2032F
- Historical Data and Forecast of Kenya Gas Delivery Systems Gas Equipment Market Revenues & Volume By Accessories for the Period 2022-2032F
- Historical Data and Forecast of Kenya Gas Equipment Market Revenues & Volume By Process for the Period 2022-2032F
- Historical Data and Forecast of Kenya Gas Equipment Market Revenues & Volume By Gas Generation for the Period 2022-2032F
- Historical Data and Forecast of Kenya Gas Equipment Market Revenues & Volume By Gas Storage for the Period 2022-2032F
- Historical Data and Forecast of Kenya Gas Equipment Market Revenues & Volume By Gas Detection for the Period 2022-2032F
- Historical Data and Forecast of Kenya Gas Equipment Market Revenues & Volume By Gas Transportation for the Period 2022-2032F
- Historical Data and Forecast of Kenya Gas Equipment Market Revenues & Volume By End-Gas for the Period 2022-2032F
- Historical Data and Forecast of Kenya Gas Equipment Market Revenues & Volume By Nitrogen for the Period 2022-2032F
- Historical Data and Forecast of Kenya Gas Equipment Market Revenues & Volume By Hydrogen for the Period 2022-2032F
- Historical Data and Forecast of Kenya Gas Equipment Market Revenues & Volume By Helium for the Period 2022-2032F
- Historical Data and Forecast of Kenya Gas Equipment Market Revenues & Volume By Oxygen for the Period 2022-2032F
- Historical Data and Forecast of Kenya Gas Equipment Market Revenues & Volume By Carbon Dioxide for the Period 2022-2032F
- Historical Data and Forecast of Kenya Gas Equipment Market Revenues & Volume By Others for the Period 2022-2032F
- Historical Data and Forecast of Kenya Gas Equipment Market Revenues & Volume By End-Users for the Period 2022-2032F
- Historical Data and Forecast of Kenya Gas Equipment Market Revenues & Volume By Metal Fabrication for the Period 2022-2032F
- Historical Data and Forecast of Kenya Gas Equipment Market Revenues & Volume By Chemicals for the Period 2022-2032F
- Historical Data and Forecast of Kenya Gas Equipment Market Revenues & Volume By Healthcare for the Period 2022-2032F
- Historical Data and Forecast of Kenya Gas Equipment Market Revenues & Volume By Oil and Gas for the Period 2022-2032F
- Historical Data and Forecast of Kenya Gas Equipment Market Revenues & Volume By Food and Beverage for the Period 2022-2032F
- Historical Data and Forecast of Kenya Gas Equipment Market Revenues & Volume By Others for the Period 2022-2032F
- Kenya Gas Equipment Import Export Trade Statistics
- Market Opportunity Assessment By Equipment Type
- Market Opportunity Assessment By Process
- Market Opportunity Assessment By End-Gas
- Market Opportunity Assessment By End-Users
- Kenya Gas Equipment Top Companies Market Share
- Kenya Gas Equipment Competitive Benchmarking By Technical and Operational Parameters
- Kenya Gas Equipment Company Profiles
- Kenya Gas Equipment Key Strategic Recommendations
Kenya Gas Equipment Market - Frequently Asked Questions
The market was estimated at USD 169 Million in 2025 and is expected to reach USD 224 Million by 2032, with a CAGR of 4.1% from 2026 to 2032.
The government is actively regulating safety standards and promoting the use of LPG, which encourages consumer adoption and confidence in gas equipment.
A growing focus on eco-friendly, energy-efficient appliances and the demand for advanced features like safety sensors are key trends currently shaping consumer choices.
Yes, high initial investment costs and limited access to financing options significantly challenge small and medium enterprises looking to enter the market.
Investors can benefit from the increasing demand for gas cylinders, safety equipment, and innovations in gas appliances, alongside the growing urban population.
6Wresearch actively monitors the Kenya Gas Equipment Market and publishes its comprehensive annual report, highlighting emerging trends, growth drivers, revenue analysis, and forecast outlook. Our insights help businesses to make data-backed strategic decisions with ongoing market dynamics. Our analysts track relevent industries related to the Kenya Gas Equipment Market, allowing our clients with actionable intelligence and reliable forecasts tailored to emerging regional needs.
Yes, we provide customisation as per your requirements. To learn more, feel free to contact us on sales@6wresearch.com
1 Executive Summary |
2 Introduction |
2.1 Key Highlights of the Report |
2.2 Report Description |
2.3 Market Scope & Segmentation |
2.4 Research Methodology |
2.5 Assumptions |
3 Kenya Gas Equipment Market Overview |
3.1 Kenya Country Macro Economic Indicators |
3.2 Kenya Gas Equipment Market Revenues & Volume, 2022 & 2032F |
3.3 Kenya Gas Equipment Market - Industry Life Cycle |
3.4 Kenya Gas Equipment Market - Porter's Five Forces |
3.5 Kenya Gas Equipment Market Revenues & Volume Share, By Equipment Type, 2022 & 2032F |
3.6 Kenya Gas Equipment Market Revenues & Volume Share, By Process, 2022 & 2032F |
3.7 Kenya Gas Equipment Market Revenues & Volume Share, By End-Gas, 2022 & 2032F |
3.8 Kenya Gas Equipment Market Revenues & Volume Share, By End-Users, 2022 & 2032F |
4 Kenya Gas Equipment Market Dynamics |
4.1 Impact Analysis |
4.2 Market Drivers |
4.3 Market Restraints |
5 Kenya Gas Equipment Market Trends |
6 Kenya Gas Equipment Market, By Types |
6.1 Kenya Gas Equipment Market, By Equipment Type |
6.1.1 Overview and Analysis |
6.1.2 Kenya Gas Equipment Market Revenues & Volume, By Equipment Type, 2022-2032F |
6.1.3 Kenya Gas Equipment Market Revenues & Volume, By Gas Delivery Systems, 2022-2032F |
6.1.4 Kenya Gas Equipment Market Revenues & Volume, By Gas Regulators, 2022-2032F |
6.1.5 Kenya Gas Equipment Market Revenues & Volume, By Flow Devices, 2022-2032F |
6.1.6 Kenya Gas Equipment Market Revenues & Volume, By Purifiers & Filters, 2022-2032F |
6.1.7 Kenya Gas Equipment Market Revenues & Volume, By Gas Generating Systems, 2022-2032F |
6.1.8 Kenya Gas Equipment Market Revenues & Volume, By Gas Detection Systems, 2022-2032F |
6.1.9 Kenya Gas Equipment Market Revenues & Volume, By Accessories, 2022-2032F |
6.1.10 Kenya Gas Equipment Market Revenues & Volume, By Accessories, 2022-2032F |
6.2 Kenya Gas Equipment Market, By Process |
6.2.1 Overview and Analysis |
6.2.2 Kenya Gas Equipment Market Revenues & Volume, By Gas Generation, 2022-2032F |
6.2.3 Kenya Gas Equipment Market Revenues & Volume, By Gas Storage, 2022-2032F |
6.2.4 Kenya Gas Equipment Market Revenues & Volume, By Gas Detection, 2022-2032F |
6.2.5 Kenya Gas Equipment Market Revenues & Volume, By Gas Transportation, 2022-2032F |
6.3 Kenya Gas Equipment Market, By End-Gas |
6.3.1 Overview and Analysis |
6.3.2 Kenya Gas Equipment Market Revenues & Volume, By Nitrogen, 2022-2032F |
6.3.3 Kenya Gas Equipment Market Revenues & Volume, By Hydrogen, 2022-2032F |
6.3.4 Kenya Gas Equipment Market Revenues & Volume, By Helium, 2022-2032F |
6.3.5 Kenya Gas Equipment Market Revenues & Volume, By Oxygen, 2022-2032F |
6.3.6 Kenya Gas Equipment Market Revenues & Volume, By Carbon Dioxide, 2022-2032F |
6.3.7 Kenya Gas Equipment Market Revenues & Volume, By Others, 2022-2032F |
6.4 Kenya Gas Equipment Market, By End-Users |
6.4.1 Overview and Analysis |
6.4.2 Kenya Gas Equipment Market Revenues & Volume, By Metal Fabrication, 2022-2032F |
6.4.3 Kenya Gas Equipment Market Revenues & Volume, By Chemicals, 2022-2032F |
6.4.4 Kenya Gas Equipment Market Revenues & Volume, By Healthcare, 2022-2032F |
6.4.5 Kenya Gas Equipment Market Revenues & Volume, By Oil and Gas, 2022-2032F |
6.4.6 Kenya Gas Equipment Market Revenues & Volume, By Food and Beverage, 2022-2032F |
6.4.7 Kenya Gas Equipment Market Revenues & Volume, By Others, 2022-2032F |
7 Kenya Gas Equipment Market Import-Export Trade Statistics |
7.1 Kenya Gas Equipment Market Export to Major Countries |
7.2 Kenya Gas Equipment Market Imports from Major Countries |
8 Kenya Gas Equipment Market Key Performance Indicators |
9 Kenya Gas Equipment Market - Opportunity Assessment |
9.1 Kenya Gas Equipment Market Opportunity Assessment, By Equipment Type, 2022 & 2032F |
9.2 Kenya Gas Equipment Market Opportunity Assessment, By Process, 2022 & 2032F |
9.3 Kenya Gas Equipment Market Opportunity Assessment, By End-Gas, 2022 & 2032F |
9.4 Kenya Gas Equipment Market Opportunity Assessment, By End-Users, 2022 & 2032F |
10 Kenya Gas Equipment Market - Competitive Landscape |
10.1 Kenya Gas Equipment Market Revenue Share, By Companies, 2025 |
10.2 Kenya Gas Equipment Market Competitive Benchmarking, By Operating and Technical Parameters |
11 Company Profiles |
12 Recommendations |
13 Disclaimer |
Global Go To Market Strategy - 2030
Export potential enables firms to identify high-growth global markets with greater confidence by combining advanced trade intelligence with a structured quantitative methodology. The framework analyzes emerging demand trends and country-level import patterns while integrating macroeconomic and trade datasets such as GDP and population forecasts, bilateral import–export flows, tariff structures, elasticity differentials between developed and developing economies, geographic distance, and import demand projections. Using weighted trade values from 2020–2024 as the base period to project country-to-country export potential for 2030, these inputs are operationalized through calculated drivers such as gravity model parameters, tariff impact factors, and projected GDP per-capita growth. Through an analysis of hidden potentials, demand hotspots, and market conditions that are most favorable to success, this method enables firms to focus on target countries, maximize returns, and global expansion with data, backed by accuracy.
By factoring in the projected importer demand gap that is currently unmet and could be potential opportunity, it identifies the potential for the Exporter (Country) among 190 countries, against the general trade analysis, which identifies the biggest importer or exporter.
To discover high-growth global markets and optimize your business strategy:
Click Here
Pricing
- Single User License$ 1,995
- Department License$ 2,400
- Site License$ 3,120
- Global License$ 3,795

Leadership Perspectives from Industry Events
Search
Thought Leadership and Analyst Meet


Our Clients
6WResearch In News
- India Air Conditioner Market Set for Strong Rebound in 2026 After Weather-Led Correction and GST-Driven Recovery: 6Wresearch
- ADAS in India: How Automatic Emergency Braking, Blind Spot Detection & Driver Monitoring are Transforming Road Safety
- Doha a strategic location for EV manufacturing hub: IPA Qatar
- Demand for luxury TVs surging in the GCC, says Samsung
- Empowering Growth: The Thriving Journey of Bangladesh’s Cable Industry
- Demand for luxury TVs surging in the GCC, says Samsung
Latest Reports
- Poland Fire Protection Systems Market (2026-2032)
- Cape Verde Portable Hand-Thrown Extinguisher Market (2026-2032)
- Canada Portable Hand-Thrown Extinguisher Market (2026-2032)
- Cameroon Portable Hand-Thrown Extinguisher Market (2026-2032)
- Burundi Portable Hand-Thrown Extinguisher Market (2026-2032)
- Burkina Faso Portable Hand-Thrown Extinguisher Market (2026-2032)
- Bulgaria Portable Hand-Thrown Extinguisher Market (2026-2032)
- Brunei Portable Hand-Thrown Extinguisher Market (2026-2032)
- Botswana Portable Hand-Thrown Extinguisher Market (2026-2032)
- Bosnia and Herzegovina Portable Hand-Thrown Extinguisher Market (2026-2032)
Industry Events and Analyst Meet

HIMTEX 2026

India Refining Summit 2026

India EV Show 2026

EV tech India Expo 2026

Auto Tech Asia 2026
Whitepaper
- Middle East & Africa Commercial Security Market Click here to view more.
- Middle East & Africa Fire Safety Systems & Equipment Market Click here to view more.
- GCC Drone Market Click here to view more.
- Middle East Lighting Fixture Market Click here to view more.
- GCC Physical & Perimeter Security Market Click here to view more.