Kenya Inulin Market | COVID-19 IMPACT, Trends, Size, Forecast, Companies, Share, Analysis, Value, Industry, Revenue & Growth
Market Forecast By Form (Powder, Liquid), By Nature (Organic, Conventional), By Source (Agave, Chicory, Jerusalem Artichoke, Others), By Application (Food & Beverages, Dietary Supplements, Pharmaceuticals, Animal Feed) And Competitive Landscape
| Product Code: ETC179949 | Publication Date: Jan 2022 | Updated Date: Aug 2025 | Product Type: Market Research Report | |
| Publisher: 6Wresearch | Author: Ravi Bhandari | No. of Pages: 70 | No. of Figures: 35 | No. of Tables: 5 |
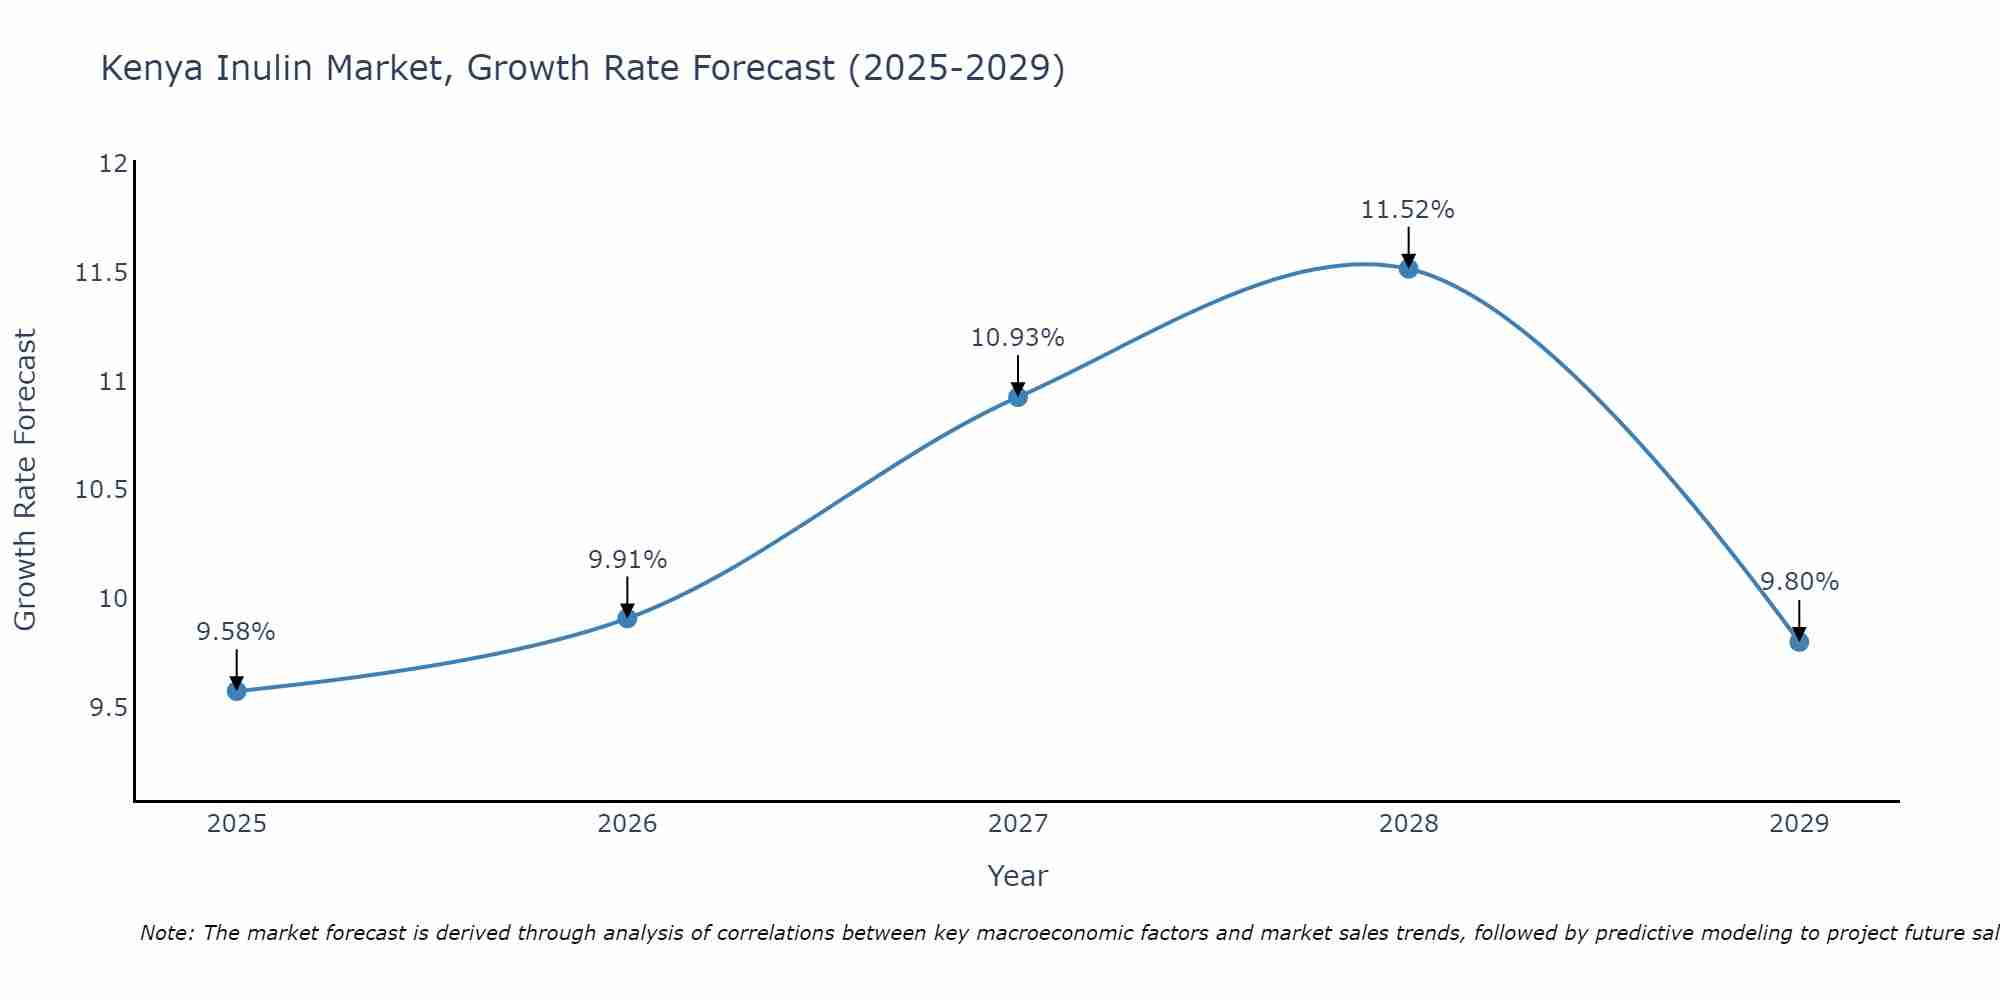
Kenya Inulin Market Size Growth Rate
The Kenya Inulin Market is projected to witness mixed growth rate patterns during 2025 to 2029. The growth rate begins at 9.58% in 2025, climbs to a high of 11.52% in 2028, and moderates to 9.80% by 2029.
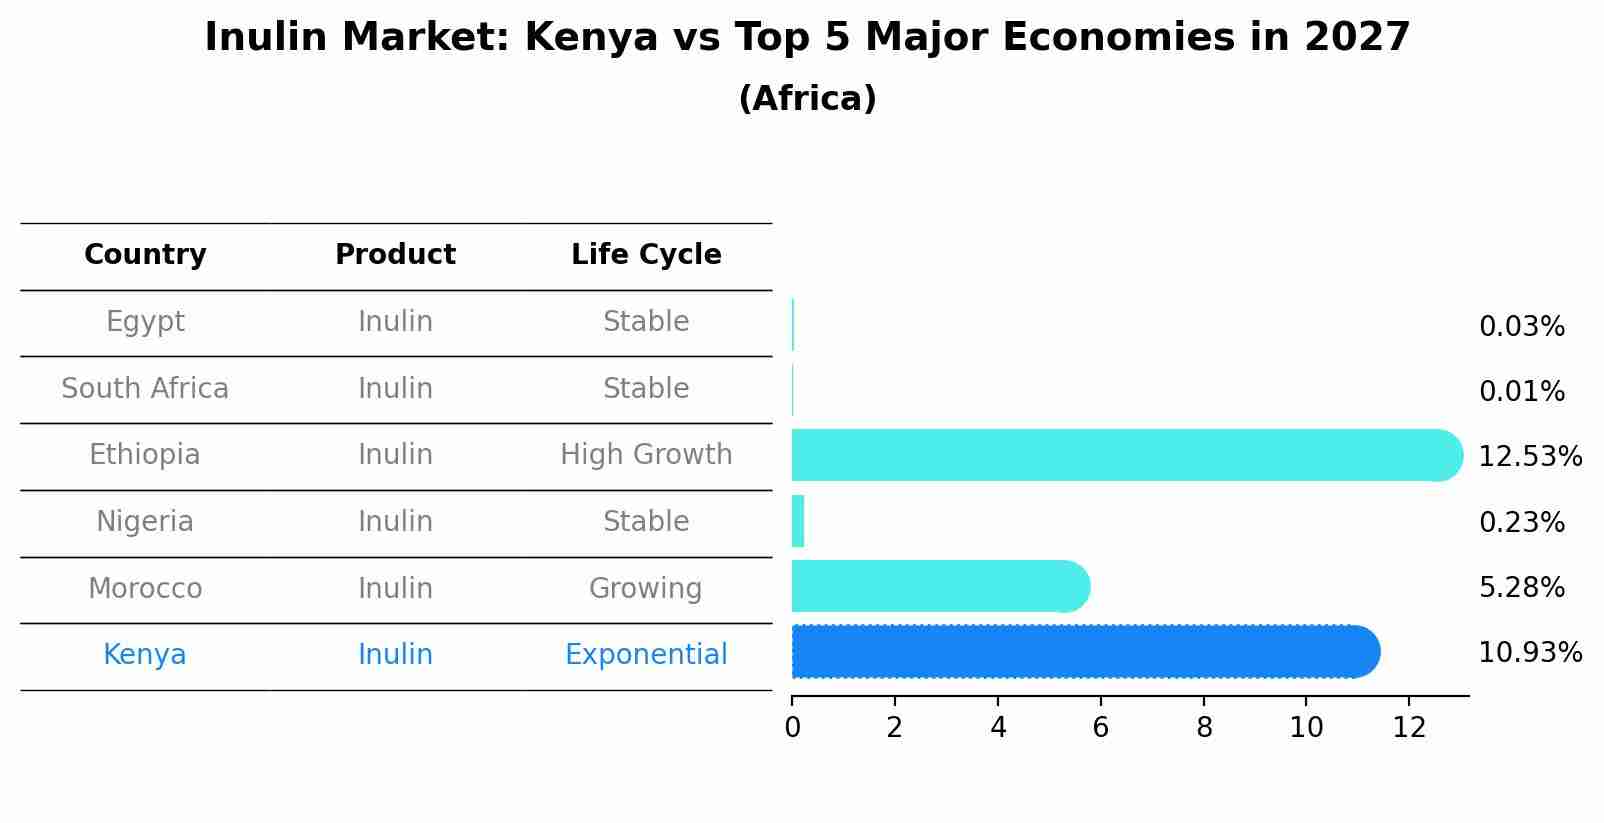
Inulin Market: Kenya vs Top 5 Major Economies in 2027 (Africa)
By 2027, the Inulin market in Kenya is anticipated to reach a growth rate of 10.93%, as part of an increasingly competitive Africa region, where Egypt remains at the forefront, supported by South Africa, Ethiopia, Nigeria and Morocco, driving innovations and market adoption across sectors.
Kenya Inulin Market Overview
In Kenya, the inulin market is driven by the growing health consciousness among consumers and the increasing demand for functional foods. Inulin, a natural dietary fiber, is used as a prebiotic to promote gut health and is incorporated into various food and beverage products. The market is bolstered by the rise in health-focused diets and the expanding food and beverage industry, which seeks to offer healthier alternatives to traditional products.
Drivers of the market
The Kenya inulin market is witnessing robust growth driven by the increasing demand for natural and functional food ingredients in the food and beverage industry. Inulin is a soluble dietary fiber extracted from chicory roots, offering health benefits such as prebiotic effects, blood sugar regulation, and fat reduction. Moreover, growing consumer awareness about digestive health, clean label trends, and the shift towards natural and organic food products are driving market demand for inulin in Kenya.
Challenges of the market
In Kenya, challenges in the inulin market include ensuring inulin purity, quality, and availability for diverse food and beverage applications. Addressing sourcing and extraction challenges, managing regulatory compliance, and educating consumers about the health benefits of inulin pose hurdles for market players
Government Policy of the market
With applications in food and beverage, dietary supplements, and pharmaceuticals, the inulin market in Kenya may be influenced by government regulations related to food safety, nutrition labeling, and health claims. Initiatives promoting functional foods, dietary guidelines, and consumer awareness may shape market dynamics in this segment.
Key Highlights of the Report:
- Kenya Inulin Market Outlook
- Market Size of Kenya Inulin Market, 2021
- Forecast of Kenya Inulin Market, 2028
- Historical Data and Forecast of Kenya Inulin Revenues & Volume for the Period 2018 - 2028
- Kenya Inulin Market Trend Evolution
- Kenya Inulin Market Drivers and Challenges
- Kenya Inulin Price Trends
- Kenya Inulin Porter's Five Forces
- Kenya Inulin Industry Life Cycle
- Historical Data and Forecast of Kenya Inulin Market Revenues & Volume By Form for the Period 2018 - 2028
- Historical Data and Forecast of Kenya Inulin Market Revenues & Volume By Powder for the Period 2018 - 2028
- Historical Data and Forecast of Kenya Inulin Market Revenues & Volume By Liquid for the Period 2018 - 2028
- Historical Data and Forecast of Kenya Inulin Market Revenues & Volume By Nature for the Period 2018 - 2028
- Historical Data and Forecast of Kenya Inulin Market Revenues & Volume By Organic for the Period 2018 - 2028
- Historical Data and Forecast of Kenya Inulin Market Revenues & Volume By Conventional for the Period 2018 - 2028
- Historical Data and Forecast of Kenya Inulin Market Revenues & Volume By Source for the Period 2018 - 2028
- Historical Data and Forecast of Kenya Inulin Market Revenues & Volume By Agave for the Period 2018 - 2028
- Historical Data and Forecast of Kenya Inulin Market Revenues & Volume By Chicory for the Period 2018 - 2028
- Historical Data and Forecast of Kenya Inulin Market Revenues & Volume By Jerusalem Artichoke for the Period 2018 - 2028
- Historical Data and Forecast of Kenya Inulin Market Revenues & Volume By Others for the Period 2018 - 2028
- Historical Data and Forecast of Kenya Inulin Market Revenues & Volume By Application for the Period 2018 - 2028
- Historical Data and Forecast of Kenya Inulin Market Revenues & Volume By Food & Beverages for the Period 2018 - 2028
- Historical Data and Forecast of Kenya Inulin Market Revenues & Volume By Dietary Supplements for the Period 2018 - 2028
- Historical Data and Forecast of Kenya Inulin Market Revenues & Volume By Pharmaceuticals for the Period 2018 - 2028
- Historical Data and Forecast of Kenya Inulin Market Revenues & Volume By Animal Feed for the Period 2018 - 2028
- Kenya Inulin Import Export Trade Statistics
- Market Opportunity Assessment By Form
- Market Opportunity Assessment By Nature
- Market Opportunity Assessment By Source
- Market Opportunity Assessment By Application
- Kenya Inulin Top Companies Market Share
- Kenya Inulin Competitive Benchmarking By Technical and Operational Parameters
- Kenya Inulin Company Profiles
- Kenya Inulin Key Strategic Recommendations
Frequently Asked Questions About the Market Study (FAQs):
6Wresearch actively monitors the Kenya Inulin Market and publishes its comprehensive annual report, highlighting emerging trends, growth drivers, revenue analysis, and forecast outlook. Our insights help businesses to make data-backed strategic decisions with ongoing market dynamics. Our analysts track relevent industries related to the Kenya Inulin Market, allowing our clients with actionable intelligence and reliable forecasts tailored to emerging regional needs.
Yes, we provide customisation as per your requirements. To learn more, feel free to contact us on sales@6wresearch.com
1 Executive Summary |
2 Introduction |
2.1 Key Highlights of the Report |
2.2 Report Description |
2.3 Market Scope & Segmentation |
2.4 Research Methodology |
2.5 Assumptions |
3 Kenya Inulin Market Overview |
3.1 Kenya Country Macro Economic Indicators |
3.2 Kenya Inulin Market Revenues & Volume, 2021 & 2028F |
3.3 Kenya Inulin Market - Industry Life Cycle |
3.4 Kenya Inulin Market - Porter's Five Forces |
3.5 Kenya Inulin Market Revenues & Volume Share, By Form, 2021 & 2028F |
3.6 Kenya Inulin Market Revenues & Volume Share, By Nature, 2021 & 2028F |
3.7 Kenya Inulin Market Revenues & Volume Share, By Source, 2021 & 2028F |
3.8 Kenya Inulin Market Revenues & Volume Share, By Application, 2021 & 2028F |
4 Kenya Inulin Market Dynamics |
4.1 Impact Analysis |
4.2 Market Drivers |
4.2.1 Increasing awareness about the health benefits of inulin in Kenya |
4.2.2 Growing demand for natural and organic food ingredients |
4.2.3 Rise in diabetic population in Kenya leading to higher demand for low glycemic index products |
4.3 Market Restraints |
4.3.1 Limited availability of inulin sources in Kenya |
4.3.2 High cost of production and processing of inulin |
4.3.3 Lack of regulatory framework specific to inulin in Kenya |
5 Kenya Inulin Market Trends |
6 Kenya Inulin Market, By Types |
6.1 Kenya Inulin Market, By Form |
6.1.1 Overview and Analysis |
6.1.2 Kenya Inulin Market Revenues & Volume, By Form, 2018 - 2028F |
6.1.3 Kenya Inulin Market Revenues & Volume, By Powder, 2018 - 2028F |
6.1.4 Kenya Inulin Market Revenues & Volume, By Liquid, 2018 - 2028F |
6.2 Kenya Inulin Market, By Nature |
6.2.1 Overview and Analysis |
6.2.2 Kenya Inulin Market Revenues & Volume, By Organic, 2018 - 2028F |
6.2.3 Kenya Inulin Market Revenues & Volume, By Conventional, 2018 - 2028F |
6.3 Kenya Inulin Market, By Source |
6.3.1 Overview and Analysis |
6.3.2 Kenya Inulin Market Revenues & Volume, By Agave, 2018 - 2028F |
6.3.3 Kenya Inulin Market Revenues & Volume, By Chicory, 2018 - 2028F |
6.3.4 Kenya Inulin Market Revenues & Volume, By Jerusalem Artichoke, 2018 - 2028F |
6.3.5 Kenya Inulin Market Revenues & Volume, By Others, 2018 - 2028F |
6.4 Kenya Inulin Market, By Application |
6.4.1 Overview and Analysis |
6.4.2 Kenya Inulin Market Revenues & Volume, By Food & Beverages, 2018 - 2028F |
6.4.3 Kenya Inulin Market Revenues & Volume, By Dietary Supplements, 2018 - 2028F |
6.4.4 Kenya Inulin Market Revenues & Volume, By Pharmaceuticals, 2018 - 2028F |
6.4.5 Kenya Inulin Market Revenues & Volume, By Animal Feed, 2018 - 2028F |
7 Kenya Inulin Market Import-Export Trade Statistics |
7.1 Kenya Inulin Market Export to Major Countries |
7.2 Kenya Inulin Market Imports from Major Countries |
8 Kenya Inulin Market Key Performance Indicators |
8.1 Number of new product launches containing inulin in the Kenyan market |
8.2 Growth rate of the health and wellness sector in Kenya |
8.3 Number of research studies conducted on the benefits of inulin for health in Kenya |
8.4 Percentage increase in the diabetic population in Kenya |
8.5 Rate of adoption of natural and organic food products in Kenya |
9 Kenya Inulin Market - Opportunity Assessment |
9.1 Kenya Inulin Market Opportunity Assessment, By Form, 2021 & 2028F |
9.2 Kenya Inulin Market Opportunity Assessment, By Nature, 2021 & 2028F |
9.3 Kenya Inulin Market Opportunity Assessment, By Source, 2021 & 2028F |
9.4 Kenya Inulin Market Opportunity Assessment, By Application, 2021 & 2028F |
10 Kenya Inulin Market - Competitive Landscape |
10.1 Kenya Inulin Market Revenue Share, By Companies, 2021 |
10.2 Kenya Inulin Market Competitive Benchmarking, By Operating and Technical Parameters |
11 Company Profiles |
12 Recommendations |
13 Disclaimer |
Export potential assessment - trade Analytics for 2030
Export potential enables firms to identify high-growth global markets with greater confidence by combining advanced trade intelligence with a structured quantitative methodology. The framework analyzes emerging demand trends and country-level import patterns while integrating macroeconomic and trade datasets such as GDP and population forecasts, bilateral import–export flows, tariff structures, elasticity differentials between developed and developing economies, geographic distance, and import demand projections. Using weighted trade values from 2020–2024 as the base period to project country-to-country export potential for 2030, these inputs are operationalized through calculated drivers such as gravity model parameters, tariff impact factors, and projected GDP per-capita growth. Through an analysis of hidden potentials, demand hotspots, and market conditions that are most favorable to success, this method enables firms to focus on target countries, maximize returns, and global expansion with data, backed by accuracy.
By factoring in the projected importer demand gap that is currently unmet and could be potential opportunity, it identifies the potential for the Exporter (Country) among 190 countries, against the general trade analysis, which identifies the biggest importer or exporter.
To discover high-growth global markets and optimize your business strategy:
Click Here
Pricing
- Single User License$ 1,995
- Department License$ 2,400
- Site License$ 3,120
- Global License$ 3,795

Search
Thought Leadership and Analyst Meet


Our Clients
Related Reports
- Saudi Arabia Core Assurance Service Market (2025-2031) | Strategy, Consumer Insights, Analysis, Investment Trends, Opportunities, Growth, Size, Share, Industry, Revenue, Segments, Value, Segmentation, Supply, Forecast, Restraints, Outlook, Competition, Drivers, Trends, Demand, Pricing Analysis, Competitive, Strategic Insights, Companies, Challenges
- Romania Uninterruptible Power Supply (UPS) Market (2026-2032) | Industry, Analysis, Revenue, Size, Forecast, Outlook, Value, Trends, Share, Growth & Companies
- Saudi Arabia Car Window Tinting Film, Paint Protection Film (PPF), and Ceramic Coating Market (2025-2031) | Strategy, Consumer Insights, Analysis, Investment Trends, Opportunities, Growth, Size, Share, Industry, Revenue, Segments, Value, Segmentation, Supply, Forecast, Restraints, Outlook, Competition, Drivers, Trends, Demand, Pricing Analysis, Competitive, Strategic Insights, Companies, Challenges
- South Africa Stationery Market (2025-2031) | Share, Size, Industry, Value, Growth, Revenue, Analysis, Trends, Segmentation & Outlook
- Afghanistan Rocking Chairs And Adirondack Chairs Market (2026-2032) | Size & Revenue, Competitive Landscape, Share, Segmentation, Industry, Value, Outlook, Analysis, Trends, Growth, Forecast, Companies
- Afghanistan Apparel Market (2026-2032) | Growth, Outlook, Industry, Segmentation, Forecast, Size, Companies, Trends, Value, Share, Analysis & Revenue
- Canada Oil and Gas Market (2026-2032) | Share, Segmentation, Value, Industry, Trends, Forecast, Analysis, Size & Revenue, Growth, Competitive Landscape, Outlook, Companies
- Germany Breakfast Food Market (2026-2032) | Industry, Share, Growth, Size, Companies, Value, Analysis, Revenue, Trends, Forecast & Outlook
- Australia Briquette Market (2025-2031) | Growth, Size, Revenue, Forecast, Analysis, Trends, Value, Share, Industry & Companies
- Vietnam System Integrator Market (2026-2032) | Size, Companies, Analysis, Industry, Value, Forecast, Growth, Trends, Revenue & Share
Industry Events and Analyst Meet

Stationery & Paper Expo Saudi Arabia 2026

Kids & Toys Expo Saudi Arabia 2026

Gifts & Homeware Expo Saudi Arabia 2026

Smart Home Expo 2026

Industrial Facilities Management Expo 2025
Whitepaper
- Middle East & Africa Commercial Security Market Click here to view more.
- Middle East & Africa Fire Safety Systems & Equipment Market Click here to view more.
- GCC Drone Market Click here to view more.
- Middle East Lighting Fixture Market Click here to view more.
- GCC Physical & Perimeter Security Market Click here to view more.
6WResearch In News
- Doha a strategic location for EV manufacturing hub: IPA Qatar
- Demand for luxury TVs surging in the GCC, says Samsung
- Empowering Growth: The Thriving Journey of Bangladesh’s Cable Industry
- Demand for luxury TVs surging in the GCC, says Samsung
- Video call with a traditional healer? Once unthinkable, it’s now common in South Africa
- Intelligent Buildings To Smooth GCC’s Path To Net Zero