Kenya Plant Extracts Market (2025-2031) | Value, Outlook, Forecast, Share, Industry, Analysis, Revenue, Size, Companies, Trends & Growth
Market Forecast By Product Type (Spices, Essential oils, Flavors & fragrances, Phytomedicines & herbal extracts), By Applications (Pharmaceuticals & dietary supplements, Food & beverages, Cosmetics, Others), By Source Types (Leaves, Fruits, Flowers, and Bulbs, Rhizomes & roots, Barks & stems, Others) And Competitive Landscape
| Product Code: ETC009970 | Publication Date: Oct 2020 | Updated Date: Apr 2025 | Product Type: Report | |
| Publisher: 6Wresearch | Author: Ravi Bhandari | No. of Pages: 70 | No. of Figures: 35 | No. of Tables: 5 |
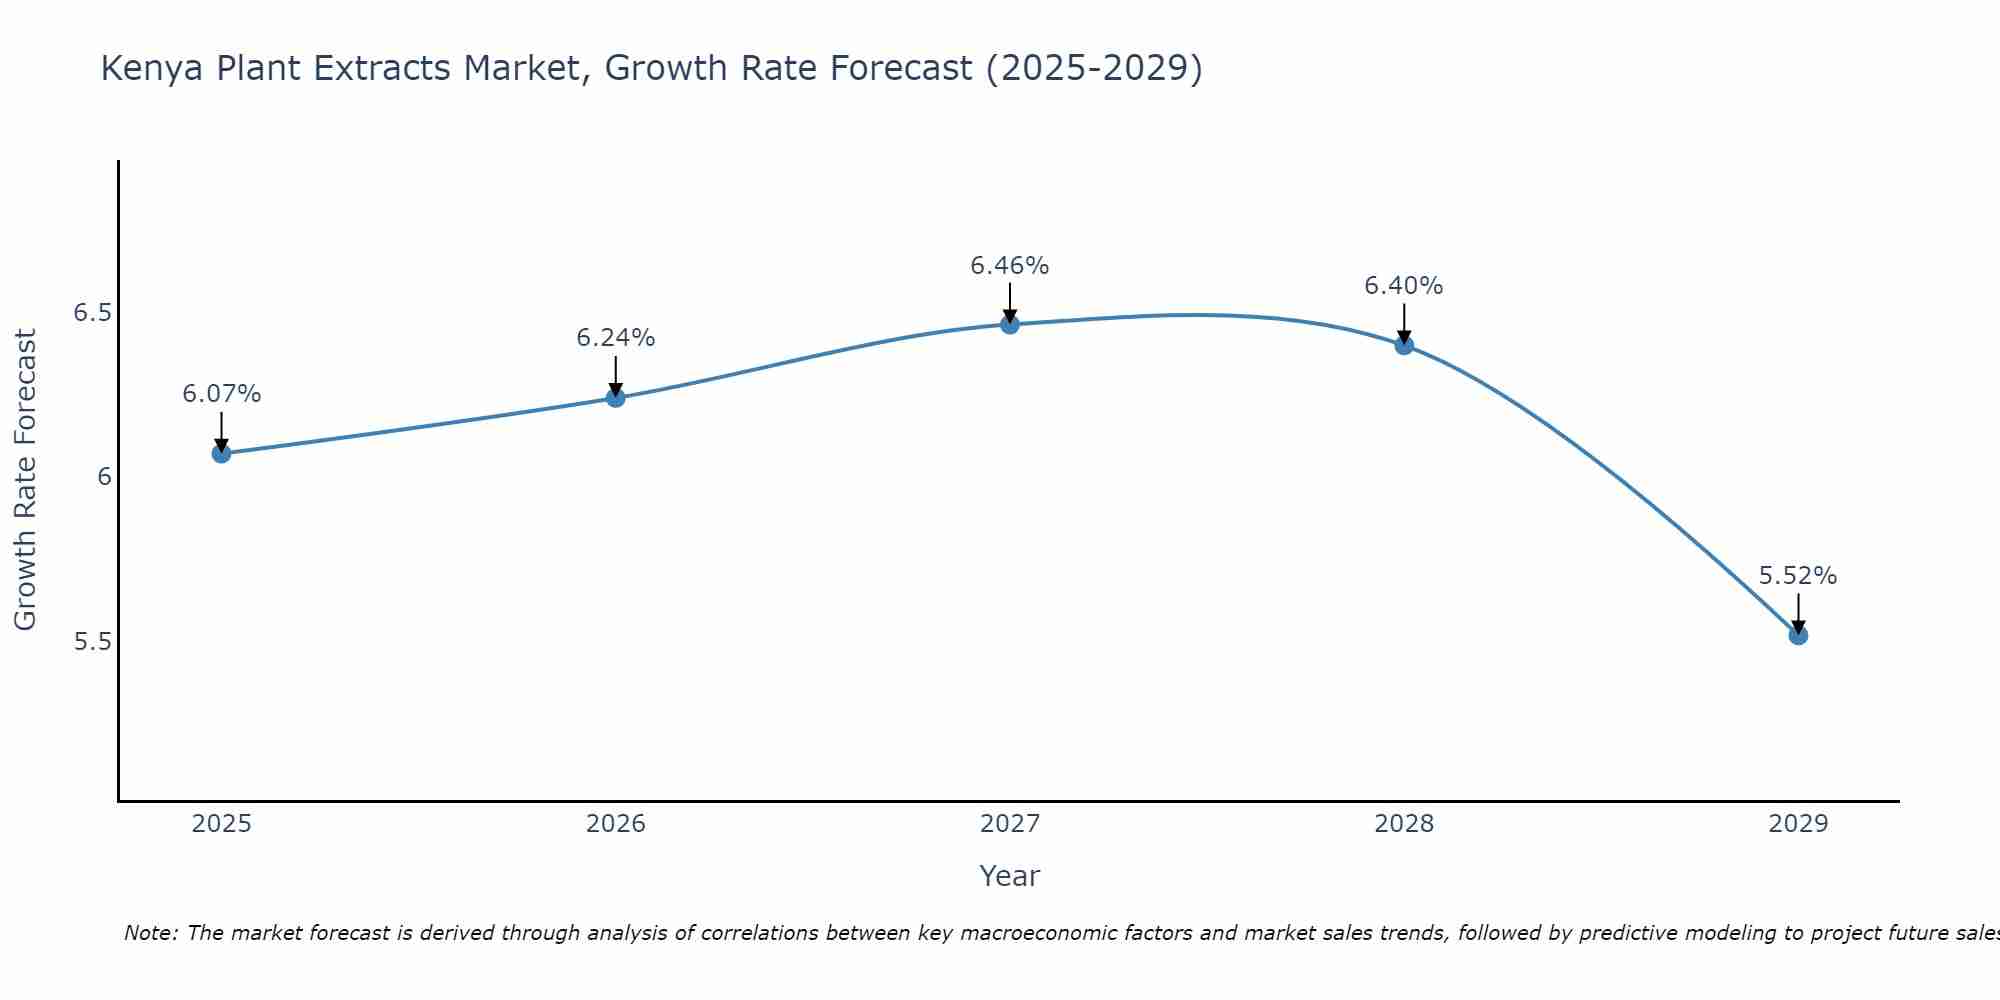
Kenya Plant Extracts Market Size Growth Rate
The Kenya Plant Extracts Market is projected to witness mixed growth rate patterns during 2025 to 2029. Growth accelerates to 6.46% in 2027, following an initial rate of 6.07%, before easing to 5.52% at the end of the period.
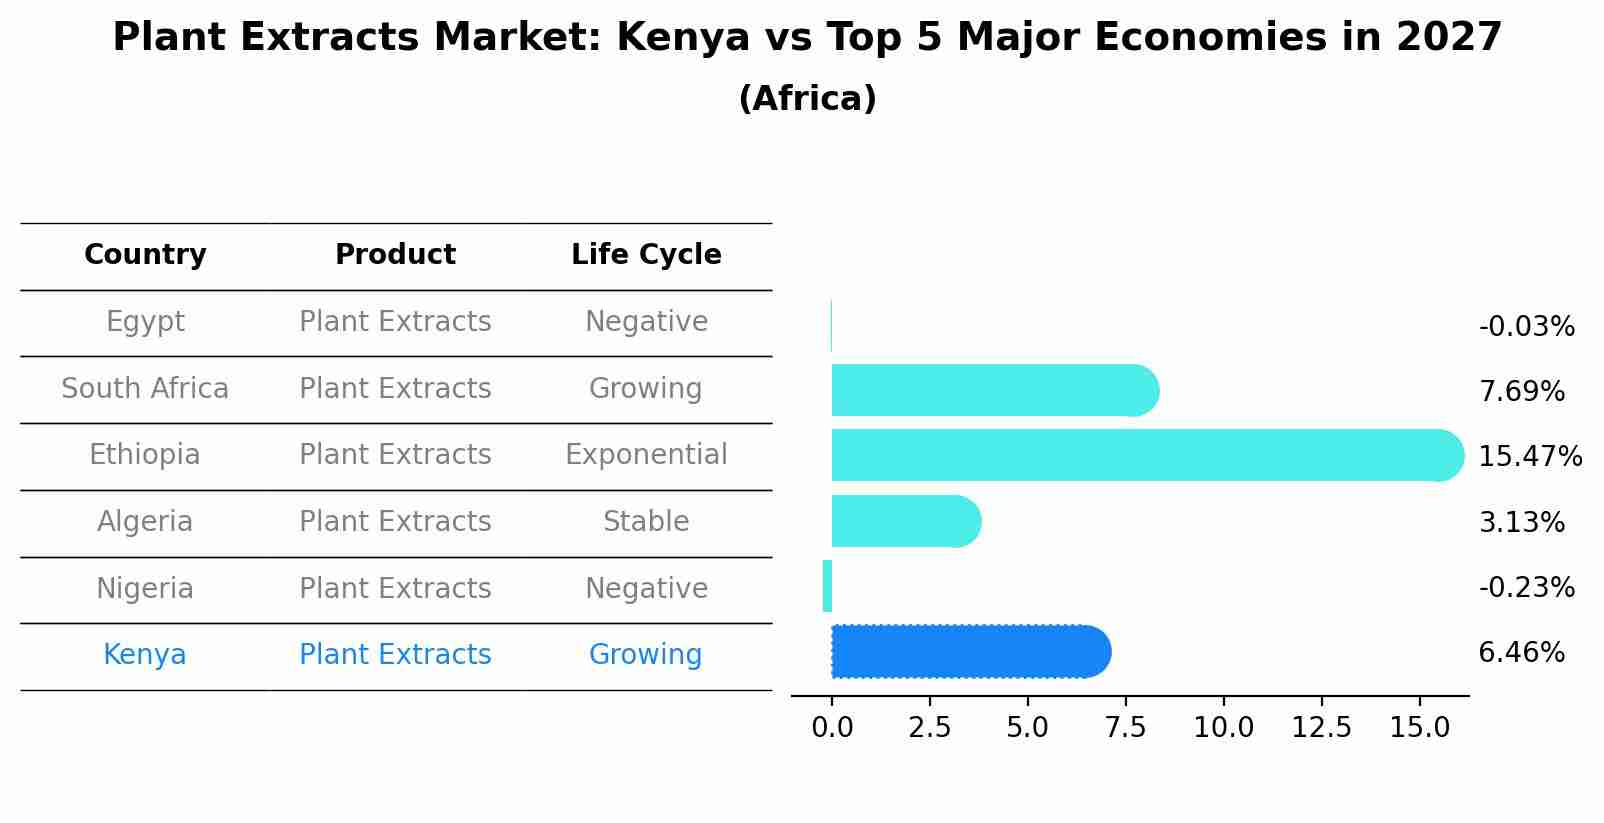
Plant Extracts Market: Kenya vs Top 5 Major Economies in 2027 (Africa)
The Plant Extracts market in Kenya is projected to grow at a growing growth rate of 6.46% by 2027, within the Africa region led by Egypt, along with other countries like South Africa, Ethiopia, Algeria and Nigeria, collectively shaping a dynamic and evolving market environment driven by innovation and increasing adoption of emerging technologies.
Kenya Plant Extracts Market Overview
The plant extracts market in Kenya is expanding as demand for natural and organic products rises across various industries, including food and beverages, pharmaceuticals, and cosmetics. Plant extracts are valued for their medicinal properties, flavoring, and nutritional benefits. The market is supported by Kenya rich biodiversity, providing a wide range of raw materials for extraction. However, challenges include maintaining consistent quality, ensuring sustainable sourcing, and competing with synthetic alternatives.
Drivers of the market
The plant extracts market in Kenya is driven by the growing demand for natural and herbal products in pharmaceuticals, cosmetics, and food and beverages, fueled by consumer preferences for organic and sustainable ingredients.
Challenges of the market
The plant extracts market in Kenya faces significant hurdles due to limited technological advancements and insufficient infrastructure for large-scale extraction and processing. High production costs, driven by the need for imported equipment and raw materials, make it difficult for local producers to compete with international suppliers. Additionally, there is a lack of regulatory frameworks and quality standards, which hampers market trust and growth. Inconsistent supply chains and seasonal variations in raw material availability further challenge market stability.
Government Policy of the market
The plant extracts market in Kenya faces various challenges. High production costs and limited availability of quality raw materials drive up prices. There is also limited awareness and understanding of the benefits and applications of plant extracts among potential users. The market is constrained by inadequate local manufacturing capabilities and reliance on imports, which can lead to supply chain vulnerabilities. Additionally, regulatory challenges and the need for compliance with international quality standards add complexity to the market.
Key Highlights of the Report:
- Kenya Plant Extracts Market Outlook
- Market Size of Kenya Plant Extracts Market, 2024
- Forecast of Kenya Plant Extracts Market, 2031
- Historical Data and Forecast of Kenya Plant Extracts Revenues & Volume for the Period 2021-2031
- Kenya Plant Extracts Market Trend Evolution
- Kenya Plant Extracts Market Drivers and Challenges
- Kenya Plant Extracts Price Trends
- Kenya Plant Extracts Porter's Five Forces
- Kenya Plant Extracts Industry Life Cycle
- Historical Data and Forecast of Kenya Plant Extracts Market Revenues & Volume By Product Type for the Period 2021-2031
- Historical Data and Forecast of Kenya Plant Extracts Market Revenues & Volume By Spices for the Period 2021-2031
- Historical Data and Forecast of Kenya Plant Extracts Market Revenues & Volume By Essential oils for the Period 2021-2031
- Historical Data and Forecast of Kenya Plant Extracts Market Revenues & Volume By Flavors & fragrances for the Period 2021-2031
- Historical Data and Forecast of Kenya Plant Extracts Market Revenues & Volume By Phytomedicines & herbal extracts for the Period 2021-2031
- Historical Data and Forecast of Kenya Plant Extracts Market Revenues & Volume By Applications for the Period 2021-2031
- Historical Data and Forecast of Kenya Plant Extracts Market Revenues & Volume By Pharmaceuticals & dietary supplements for the Period 2021-2031
- Historical Data and Forecast of Kenya Plant Extracts Market Revenues & Volume By Food & beverages for the Period 2021-2031
- Historical Data and Forecast of Kenya Plant Extracts Market Revenues & Volume By Cosmetics for the Period 2021-2031
- Historical Data and Forecast of Kenya Plant Extracts Market Revenues & Volume By Others for the Period 2021-2031
- Historical Data and Forecast of Kenya Plant Extracts Market Revenues & Volume By Source Types for the Period 2021-2031
- Historical Data and Forecast of Kenya Plant Extracts Market Revenues & Volume By Leaves for the Period 2021-2031
- Historical Data and Forecast of Kenya Plant Extracts Market Revenues & Volume By Fruits, Flowers, and Bulbs for the Period 2021-2031
- Historical Data and Forecast of Kenya Plant Extracts Market Revenues & Volume By Rhizomes & roots for the Period 2021-2031
- Historical Data and Forecast of Kenya Plant Extracts Market Revenues & Volume By Barks & stems for the Period 2021-2031
- Historical Data and Forecast of Kenya Plant Extracts Market Revenues & Volume By Others for the Period 2021-2031
- Kenya Plant Extracts Import Export Trade Statistics
- Market Opportunity Assessment By Product Type
- Market Opportunity Assessment By Applications
- Market Opportunity Assessment By Source Types
- Kenya Plant Extracts Top Companies Market Share
- Kenya Plant Extracts Competitive Benchmarking By Technical and Operational Parameters
- Kenya Plant Extracts Company Profiles
- Kenya Plant Extracts Key Strategic Recommendations
Frequently Asked Questions About the Market Study (FAQs):
6Wresearch actively monitors the Kenya Plant Extracts Market and publishes its comprehensive annual report, highlighting emerging trends, growth drivers, revenue analysis, and forecast outlook. Our insights help businesses to make data-backed strategic decisions with ongoing market dynamics. Our analysts track relevent industries related to the Kenya Plant Extracts Market, allowing our clients with actionable intelligence and reliable forecasts tailored to emerging regional needs.
Yes, we provide customisation as per your requirements. To learn more, feel free to contact us on sales@6wresearch.com
1 Executive Summary |
2 Introduction |
2.1 Key Highlights of the Report |
2.2 Report Description |
2.3 Market Scope & Segmentation |
2.4 Research Methodology |
2.5 Assumptions |
3 Kenya Plant Extracts Market Overview |
3.1 Kenya Country Macro Economic Indicators |
3.2 Kenya Plant Extracts Market Revenues & Volume, 2021 & 2031F |
3.3 Kenya Plant Extracts Market - Industry Life Cycle |
3.4 Kenya Plant Extracts Market - Porter's Five Forces |
3.5 Kenya Plant Extracts Market Revenues & Volume Share, By Product Type, 2021 & 2031F |
3.6 Kenya Plant Extracts Market Revenues & Volume Share, By Applications, 2021 & 2031F |
3.7 Kenya Plant Extracts Market Revenues & Volume Share, By Source Types, 2021 & 2031F |
4 Kenya Plant Extracts Market Dynamics |
4.1 Impact Analysis |
4.2 Market Drivers |
4.3 Market Restraints |
5 Kenya Plant Extracts Market Trends |
6 Kenya Plant Extracts Market, By Types |
6.1 Kenya Plant Extracts Market, By Product Type |
6.1.1 Overview and Analysis |
6.1.2 Kenya Plant Extracts Market Revenues & Volume, By Product Type, 2021-2031F |
6.1.3 Kenya Plant Extracts Market Revenues & Volume, By Spices, 2021-2031F |
6.1.4 Kenya Plant Extracts Market Revenues & Volume, By Essential oils, 2021-2031F |
6.1.5 Kenya Plant Extracts Market Revenues & Volume, By Flavors & fragrances, 2021-2031F |
6.1.6 Kenya Plant Extracts Market Revenues & Volume, By Phytomedicines & herbal extracts, 2021-2031F |
6.2 Kenya Plant Extracts Market, By Applications |
6.2.1 Overview and Analysis |
6.2.2 Kenya Plant Extracts Market Revenues & Volume, By Pharmaceuticals & dietary supplements, 2021-2031F |
6.2.3 Kenya Plant Extracts Market Revenues & Volume, By Food & beverages, 2021-2031F |
6.2.4 Kenya Plant Extracts Market Revenues & Volume, By Cosmetics, 2021-2031F |
6.2.5 Kenya Plant Extracts Market Revenues & Volume, By Others , 2021-2031F |
6.3 Kenya Plant Extracts Market, By Source Types |
6.3.1 Overview and Analysis |
6.3.2 Kenya Plant Extracts Market Revenues & Volume, By Leaves, 2021-2031F |
6.3.3 Kenya Plant Extracts Market Revenues & Volume, By Fruits, Flowers, and Bulbs, 2021-2031F |
6.3.4 Kenya Plant Extracts Market Revenues & Volume, By Rhizomes & roots , 2021-2031F |
6.3.5 Kenya Plant Extracts Market Revenues & Volume, By Barks & stems, 2021-2031F |
6.3.6 Kenya Plant Extracts Market Revenues & Volume, By Others , 2021-2031F |
7 Kenya Plant Extracts Market Import-Export Trade Statistics |
7.1 Kenya Plant Extracts Market Export to Major Countries |
7.2 Kenya Plant Extracts Market Imports from Major Countries |
8 Kenya Plant Extracts Market Key Performance Indicators |
9 Kenya Plant Extracts Market - Opportunity Assessment |
9.1 Kenya Plant Extracts Market Opportunity Assessment, By Product Type, 2021 & 2031F |
9.2 Kenya Plant Extracts Market Opportunity Assessment, By Applications, 2021 & 2031F |
9.3 Kenya Plant Extracts Market Opportunity Assessment, By Source Types, 2021 & 2031F |
10 Kenya Plant Extracts Market - Competitive Landscape |
10.1 Kenya Plant Extracts Market Revenue Share, By Companies, 2024 |
10.2 Kenya Plant Extracts Market Competitive Benchmarking, By Operating and Technical Parameters |
11 Company Profiles |
12 Recommendations |
13 Disclaimer |
Export potential assessment - trade Analytics for 2030
Export potential enables firms to identify high-growth global markets with greater confidence by combining advanced trade intelligence with a structured quantitative methodology. The framework analyzes emerging demand trends and country-level import patterns while integrating macroeconomic and trade datasets such as GDP and population forecasts, bilateral import–export flows, tariff structures, elasticity differentials between developed and developing economies, geographic distance, and import demand projections. Using weighted trade values from 2020–2024 as the base period to project country-to-country export potential for 2030, these inputs are operationalized through calculated drivers such as gravity model parameters, tariff impact factors, and projected GDP per-capita growth. Through an analysis of hidden potentials, demand hotspots, and market conditions that are most favorable to success, this method enables firms to focus on target countries, maximize returns, and global expansion with data, backed by accuracy.
By factoring in the projected importer demand gap that is currently unmet and could be potential opportunity, it identifies the potential for the Exporter (Country) among 190 countries, against the general trade analysis, which identifies the biggest importer or exporter.
To discover high-growth global markets and optimize your business strategy:
Click Here
Pricing
- Single User License$ 1,995
- Department License$ 2,400
- Site License$ 3,120
- Global License$ 3,795

Search
Thought Leadership and Analyst Meet


Our Clients
Latest Reports
- United Kingdom (UK) Long-term Care Insurance Market (2026-2032) | Growth, Share, Consumer Insights, Drivers, Opportunities, Competition, Pricing Analysis, Segments, Restraints, Companies, Competitive, Value, Outlook, Size, Demand, Analysis, Challenges, Strategic Insights, Investment Trends, Revenue, Trends, Supply, Forecast
- United Kingdom (UK) Long Term Care Market (2026-2032) | Companies, Outlook, Analysis, Trends, Value, Revenue, Segmentation, Share, Forecast, Competitive Landscape, Growth, Size & Forecast
- Iraq Insulation and Waterproofing Market (2026-2032) | Outlook, Drivers, Growth, Size, Share, Industry, Revenue, Trends, Demand, Competitive, Strategic Insights, Opportunities, Segments, Companies, Challenges, Strategy, Consumer Insights, Analysis, Investment Trends, Value, Segmentation, Forecast, Restraints
- India Switchgear Market Outlook (2026 - 2032) | Size, Share, Trends, Growth, Revenue, Forecast, Analysis, Value, Outlook
- Pakistan Contraceptive Implants Market (2025-2031) | Demand, Growth, Size, Share, Industry, Pricing Analysis, Competitive, Strategic Insights, Strategy, Consumer Insights, Analysis, Investment Trends, Opportunities, Revenue, Segments, Value, Segmentation, Supply, Forecast, Restraints, Outlook, Competition, Drivers, Trends, Companies, Challenges
- Sri Lanka Packaging Market (2026-2032) | Outlook, Competition, Drivers, Trends, Demand, Pricing Analysis, Competitive, Strategic Insights, Companies, Challenges, Strategy, Consumer Insights, Analysis, Investment Trends, Opportunities, Growth, Size, Share, Industry, Revenue, Segments, Value, Segmentation, Supply, Forecast, Restraints
- India Kids Watches Market (2026-2032) | Strategy, Consumer Insights, Analysis, Investment Trends, Opportunities, Growth, Size, Share, Industry, Revenue, Segments, Value, Segmentation, Supply, Forecast, Restraints, Outlook, Competition, Drivers, Trends, Demand, Pricing Analysis, Competitive, Strategic Insights, Companies, Challenges
- Saudi Arabia Core Assurance Service Market (2025-2031) | Strategy, Consumer Insights, Analysis, Investment Trends, Opportunities, Growth, Size, Share, Industry, Revenue, Segments, Value, Segmentation, Supply, Forecast, Restraints, Outlook, Competition, Drivers, Trends, Demand, Pricing Analysis, Competitive, Strategic Insights, Companies, Challenges
- Romania Uninterruptible Power Supply (UPS) Market (2026-2032) | Industry, Analysis, Revenue, Size, Forecast, Outlook, Value, Trends, Share, Growth & Companies
- Saudi Arabia Car Window Tinting Film, Paint Protection Film (PPF), and Ceramic Coating Market (2025-2031) | Strategy, Consumer Insights, Analysis, Investment Trends, Opportunities, Growth, Size, Share, Industry, Revenue, Segments, Value, Segmentation, Supply, Forecast, Restraints, Outlook, Competition, Drivers, Trends, Demand, Pricing Analysis, Competitive, Strategic Insights, Companies, Challenges
Industry Events and Analyst Meet

India EV Show 2026

EV tech India Expo 2026

Auto Tech Asia 2026

Battery Tech India 2026

Smart Production Solutions Guangzhou 2026
Whitepaper
- Middle East & Africa Commercial Security Market Click here to view more.
- Middle East & Africa Fire Safety Systems & Equipment Market Click here to view more.
- GCC Drone Market Click here to view more.
- Middle East Lighting Fixture Market Click here to view more.
- GCC Physical & Perimeter Security Market Click here to view more.
6WResearch In News
- Doha a strategic location for EV manufacturing hub: IPA Qatar
- Demand for luxury TVs surging in the GCC, says Samsung
- Empowering Growth: The Thriving Journey of Bangladesh’s Cable Industry
- Demand for luxury TVs surging in the GCC, says Samsung
- Video call with a traditional healer? Once unthinkable, it’s now common in South Africa
- Intelligent Buildings To Smooth GCC’s Path To Net Zero